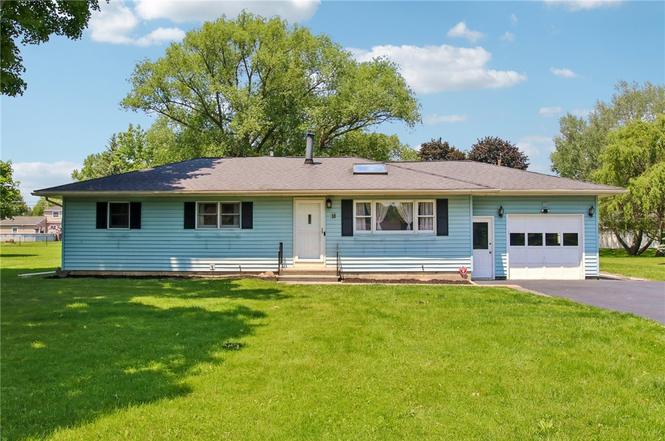
18 Wills Rd · Gates, NY
Flood risk 1/10 · Minimal
- FEMA flood zone
- X (unshaded)
- Chance of flooding over 30 yrs
- 0.0%
- Est. flood insurance / yr
- $473 – $860
Fire risk 1/10 · Minimal
- Est. fire insurance / yr
- $691 – $1,283
Heat risk 2/10 · Minimal
- Hot days now (above 95°F)
- 7 days/yr
- Hot days in 30 yrs
- 15 days/yr
Wind risk 1/10 · Minimal
- Chance of severe wind over 30 yrs
- —
Air-quality risk 2/10 · Minimal
- Unhealthy air days now
- 1 days/yr
- Unhealthy air days in 30 yrs
- 2 days/yr
Risk factors via First Street. Map © Google.
Why this score? — see what drove the C+ grade
The composite is a weighted blend of 9 inputs, each scored 0–100. Each bar is that input's sub-score; the figure is the points it added to the 100-point composite (weight × sub-score).
- Cash flow +22.5/30.0
- ARV discount +15.0/15.0
- DSCR +7.2/10.0
- 1% rule +6.3/10.0
- Schools +4.8/10.0
- Livability +3.4/5.0
- Rent growth +2.5/5.0
- Condition / age +2.5/5.0
- Appreciation +0.0/10.0
$229,900
🖨 Deal sheet 📄 Offer letter ✓ Due diligence
Listing remarks MLS
Original owner! This fantastic ranch home in a great location, features a true in-law (added in 1989 along with a full basement under addition), lots of light thanks to several skylights, and a total of 4 bedrooms, 2 bathrooms and two kitchens ready for your personal updates. Updated mechanics include a tankless hot water heater (‘11), a full tear off roof (’07), sump pump (’17), and A/C & furnace (’07). Other updates include a stamped patio and a new shed with electric service and pond in the beautiful backyard. Home is available for a quick close.
Key facts
- First floor laundry
- Cathedral ceilings
- Eat-in kitchen
Tags
Property features AI
Exterior
- Parking: Attached garage with garage door opener; Driveway; Garage has electricity; 1.5 garage spaces
- Security: Leased security system
- Utilities: Public water connected; Sewer connected; Cable available; High-speed internet available; Circuit breaker electrical service
- Home design: Single-story home; In-law suite included; Resale property
- Construction: Vinyl siding; Copper plumbing; Asphalt architectural shingle roof; Block foundation; Existing (previously built)
- Exterior features: Blacktop driveway; Patio; Shed(s) / storage
Interior
- Kitchen: Gas oven and gas range; Range hood; Dishwasher; Refrigerator; Exhaust fan; Eat-in layout; Pantry
- Bedrooms: 4 bedrooms (all on the main level)
- Flooring: Ceramic tile; Tile; Luxury vinyl; Varies
- Bathrooms: 2 full bathrooms (both on the main level)
- Heating & cooling: Gas forced air heating; Central air conditioning
- Interior features: Ceiling fans; Cathedral ceilings; Eat-in kitchen; Separate formal living room; Pantry; Skylights; In-law floorplan; Main level primary; Programmable thermostat; Thermal windows
- Laundry & utility: Washer and dryer included; Main-level laundry with accessible utilities
Neighborhood map
What this means for you Summary
Snapshot
- This is a 4-bed/2.0-bath single-family listed at $230k.
Deal economics
- At list price, monthly cash flow is $389 ($5k/yr) — positive.
- The deal already cash-flows at list — no discount required.
- Meets the 1% rule at list price ($3k rent vs $230k).
- Cap rate 8.3% vs local median 5.9% in Gates — top-decile yield for the area; either an underpriced asset or a hidden risk that comps aren't pricing in. Stress-test before assuming the spread holds.
Location & tenants
- Location reads 67/100 on livability (#582 in NY) — a middle-class / working-renter tenant base. Strengths: housing A+, health & safety A+; Watch: amenities F, commute F.
- Churchville-Chili Central School District (rural): math 53% / reading 57% proficiency, ranked #291 of 590 in NY (top 49%) — acceptable for families but not a draw, mixed tenant base, ~2y average lease.
- Market conditions: 127 active listings in the ZIP; solid renter incomes; 1,169 units permitted in Monroe County in 2024 (591 in 5+ unit buildings).
- This rent runs 36% of the median local income ($88k/yr) — at the standard rent-burdened threshold; future hikes will face affordability resistance.
Forward outlook
- Local home prices are declining (-3.0%/yr); year-one equity from $2k of loan paydown is wiped out by about $7k of value loss. Plan a longer hold.
- Monroe County population projected to shrink 6% by 2050 — rents likely to lag national; underwrite the cash flow, not the appreciation.
Negotiation context
- Only 7 days on market — expect competitive offers; lowballing is unlikely to land.
- 2 sale attempts since 7y ago with the ask held roughly flat each time — persistent listings suggest the price (not the market) is what's stuck; bring a comps-based counter.
- Current owner paid $138k; list at $230k implies a 67% gain — meaningful room to come down on a strong offer.
Risks & watch-outs
- Watch-outs: built in 1957 — expect roof / HVAC / electrical / plumbing capex.
Questions for the listing agent
- Built in 1957 — when were the roof, HVAC, electrical panel, plumbing, and water heater last replaced?
- Is there a deadline driving the sale (1031 exchange, divorce, estate, relocation)? That informs how much negotiation room exists.
- Schools are B-rated — typically a magnet for longer-tenancy family renters. What's the average tenant stay here, and is there a school-zone premium baked into asking?
- What's the average days-on-market for RENTAL listings here right now (not sales)? A rising rental-DOM trend means longer vacancies and softer asking-rent achievability than the comps imply.
- What's the recent tenant-quality profile in this submarket — average credit score on applications, eviction rate, late-payment / NSF rate, and stable-employment percentage? A property-management company in the area should have these aggregated.
- How much new for-sale + rental construction is in the pipeline within 1–3 miles? Heavy new supply typically softens prices + rents 12–24 months out; constrained supply supports both.
Investment metrics
- 1% rule
- 1.13% ✓
- Cap rate
- 8.32%
- Cash-on-cash
- 7.25%
- DSCR
- 1.32
- GRM
- 7.3
CMA / ARV
- ARV (on-the-fly)
- $310,800
- Comps found
- 12
Show comp detail 12 sales within ~0.75 mi
| Address | Dist | Beds/Ba | Sqft | Sold | Price | $/sf | Match |
|---|---|---|---|---|---|---|---|
| 6 Gateway Rd | 0.13mi | 4/1.5 | 1,790 (+1%) | 12mo | $326,500 | $182 | 80 |
| 1 Gateway Rd | 0.09mi | 3/2.5 (-1) | 1,745 (-2%) | 11mo | $227,000 | $130 | 77 |
| 12 Queensberry Ln | 0.38mi | 4/2.5 | 1,728 (-3%) | 3mo | $345,000 | $200 | 73 |
| 38 Omega Dr | 0.28mi | 4/2.5 | 1,836 (+3%) | 13mo | $350,000 | $191 | 68 |
| 929 Paul Rd | 0.05mi | 4/2.0 | 1,512 (-15%) | 9mo | $265,000 | $175 | 66 |
| 994 Paul Rd | 0.32mi | 4/1.0 | 1,676 (-6%) | 12mo | $251,000 | $150 | 62 |
| 37 Bucky Dr | 0.34mi | 4/2.0 | 1,671 (-6%) | 16mo | $249,900 | $150 | 61 |
| 21 Wethersfield Rd | 0.34mi | 3/2.5 (-1) | 1,851 (+4%) | 11mo | $348,500 | $188 | 61 |
| 15 San Mateo Rd | 0.73mi | 4/2.0 | 1,752 (-1%) | 13mo | $325,000 | $186 | 53 |
| 14 Ascot Dr | 0.47mi | 3/2.0 (-1) | 1,592 (-10%) | 6mo | $275,000 | $173 | 51 |
| 49 Brasser Dr | 0.67mi | 3/1.5 (-1) | 1,745 (-2%) | 11mo | $285,000 | $163 | 50 |
| 48 Brasser Dr | 0.70mi | 3/2.5 (-1) | 2,002 (+13%) | 2mo | $280,000 | $140 | 38 |
Match score weights: distance 35% · size 25% · config 20% · recency 20%. Top-matched comps best support the ARV.
Projected returns pro-forma
-3.0% appreciation · 3.0% rent growth · sell at horizon
- IRR
- -5.2%
- Equity multiple
- 0.81×
- Total profit
- $-12,402
- Equity at exit
- $34,279
- IRR
- 4.5%
- Equity multiple
- 1.33×
- Total profit
- $21,452
- Equity at exit
- $19,878
Cash invested: $64,372 (down + closing). Projections, not guarantees.
Landlord ↔ Tenant lean methodology
- Overall (STATE)
- 15 Strongly Tenant-Friendly
- State New York
- 15 Strongly Tenant-Friendly · D+10
- County
- — inherits STATE
- City
- — inherits STATE
ZIP-level market 14624
- Active inventory
- 127
- Price-to-rent
- 7.3×
Monthly cashflow live
- Estimated rent
- $2,609 medium interval (Pro) →
- Mortgage (P&I)
- −$1,206
- Tax from tax record
- −$371 /mo · $4,447/yr
- Insurance
- −$96
- HOA
- −$0
- Vacancy / Maint / Mgmt
- −$548
- Net cashflow
- $389
Break-even live
UW: 25.0% down · 7.5% · 30yr · 1.5% tax · 5.0% vac · 8.0% maint · 8.0% mgmt
Financing live
Cash to close
- Down payment
- $57,475
- Closing costs
- $6,897
- Reserves months
- —
- Total cash needed
- —
Loan-product check · same deal, 3 products live
Conventional
25% down · 7.5% · 30yr
- Down + closing
- —
- Monthly P&I
- —
- Monthly cashflow
- —
- DSCR
- —
- Eligible?
- —
Personal DTI + credit; lowest rate.
DSCR
20% down · 8.5% · 30yr
- Down + closing
- —
- Monthly P&I
- —
- Monthly cashflow
- —
- DSCR
- —
- Eligible?
- —
No personal income docs; deal must DSCR.
Hard money
10% down · 12.0% · 12mo
- Down + closing
- —
- Monthly P&I
- —
- Monthly cashflow
- —
- DSCR
- —
- Eligible?
- —
Short-term bridge; refi at stabilization.
Listing history 6 events
-
2026-06-17status $229,900 Pending 7 DOM
-
2026-06-17days on market $229,900 Active 7 DOM
-
2026-06-16days on market $229,900 Active 6 DOM
-
2026-06-15days on market $229,900 Active 5 DOM
-
2026-06-13remarks 650-char remark
-
2026-06-13$229,900 Active 3 DOM
ⓘ Source: listings_history table (triggers on properties + properties_extension) + one-shot
backfill from property_details.listing_events for pre-trigger history.
Tax reassessment forecast NY · Partial reset (capped growth)
- Current annual tax
- $4,447 · $371/mo
- Projected year-2 tax
- $4,447 · $371/mo
- Expected delta
- $0/yr ($0/mo · 0.0%)
ⓘ Screening estimate from a state-policy table — verify with the county assessor before closing.
Climate risk First Street
- Flood 1/10 Low FEMA zone X (unshaded) · 0% chance over 30 yrs
- Wildfire 1/10 Low
- Heat 2/10 Low 7 d/yr ≥95°F today · 15 d/yr by 30 yrs out
- Wind 1/10 Low
- Air quality 2/10 Low 1 unhealthy d/yr today · 2 by 30 yrs out
Nearby sold comps map
Loading sold comps map…
Walkable amenities ~0.75 mi
Loading nearby amenities…
Taxation est. · year 1
- Rental income
- $31,303
- − Mortgage interest
- −$12,878
- − Property taxes
- −$4,447
- − Insurance
- −$1,150
- − Repairs & maintenance
- −$2,504
- − Management
- −$2,504
- − Depreciation
- −$6,688
- Taxable income
- $1,132
- Est. tax owed @ 24.0%
- −$272
- After-tax cash flow
- $4,394/yr
For passive investors: Depreciation is non-cash, so a rental often shows a tax loss while cash-flowing — sheltering income. Rental losses are passive: they offset passive income freely, and up to $25,000/yr can offset ordinary (W-2) income if you actively participate and your MAGI is under $100k (phasing out to $0 by $150k); unused losses carry forward. On sale, claimed depreciation is recaptured at up to 25%, and gains may owe capital-gains tax (a 1031 exchange can defer both). Figures are a year-1 estimate at your 24.0% rate — not tax advice; consult a CPA.
Schools (NCES district)
- District
- Churchville-Chili Central School District
- NCES district ID
- 3607530
- Math proficiency
- 53% ▼ -13.00%
- Reading proficiency
- 57% ▲ 3.00%
- Median HH income
- $61,997
- Composite
- 48.07/100
- National rank
- #2191
- State rank
- #291 of 590 in NY
Livability — Gates
- Score
- 67/100
- State rank
- #582
- US rank
- #10531
Category grades
Schools grade is shown separately in the Schools card above.
Census & demographics
- County
- Monroe County · 674,131 people
- City population
- 27,478
- Metro
- Rochester, NY
- Population (ZIP)
- 38,626
- Household income
- $87,989
- Rent vs Own
- Severe rent burden
- 584.0
Population outlook (Monroe County) Hauer SSP2
- Today (2025)
- 759,460 people
- By 2030
- 757,154 · -0.3%
- By 2040
- 740,644 · -2.5%
- By 2050
- 714,443 · -5.9%
- By 2075
- 645,883 · -15.0%
- By 2100
- 547,084 · -28.0%
Race, ethnicity, and origin ACS 2023
- Neighborhood character
- Predominantly White (78%)
- Race & ethnicity
- White 78% Black 9% Hispanic / Latino 6% Two or more races 5% Asian 3%
- Hispanic origin (detail)
- Puerto Rican 4%
- Common ancestry
- Romanian 6% Iranian 2% Lithuanian 2%
- Foreign-born
- 7% · Canada, China, India
- Languages at home
- 90% English-only · Spanish 3% Other Indo-European 3% Russian/Polish/Slavic 1%
Political lean MEDSL · Monroe
- 2024 margin
- D (+19.1) · D 59.5% · R 40.5%
- 2008→2024 swing
- +1.4pp toward D · 2008: 17.7pp · 2024: 19.1pp
- All cycles
- 2024: D+19.1 2020: D+21.0 2016: D+14.1 2012: D+17.4 2008: D+17.7
Not yet ingested
- Civics
- —
Market trends
- HPI YoY
- ▼ -151.26%
- Current HPI
- 267.356
- Rent YoY
- —
- Metro
- Rochester, NY
- State GDP YoY
- ▲ 2.60%
- F500 in state
- 92
Industry mix (Fortune 500 HQ in NY)
| Industry | F500 HQs | Revenue |
|---|---|---|
| Financial Services | 10 | $950B |
|
||
| Consumer Goods | 9 | $162B |
|
||
| Insurance | 4 | $225B |
|
||
| Telecommunications | 2 | $144B |
|
||
| Pharmaceuticals | 2 | $112B |
|
||
| Media / Entertainment | 2 | $69B |
|
||
Price history
+53.4% since first listed6 events — show timeline
- 2026-06-10 Listed $229,900 UNYREIS
- 2020-01-06 Sold (MLS) $137,500 UNYREIS
- 2019-12-24 Sold (Public Records) $137,500 Public Records
- 2019-11-25 Pending — UNYREIS
- 2019-11-19 Contingent — UNYREIS
- 2019-10-28 Listed $149,900 UNYREIS
Property tax history
-0.1%/yrLatest (2025): $4,447 · -1.9% YoY. Source: county tax records.
Cash-flow waterfall
monthlySold comps — $/sqft
last 12 mo · ≤1 miLoading sold comps…