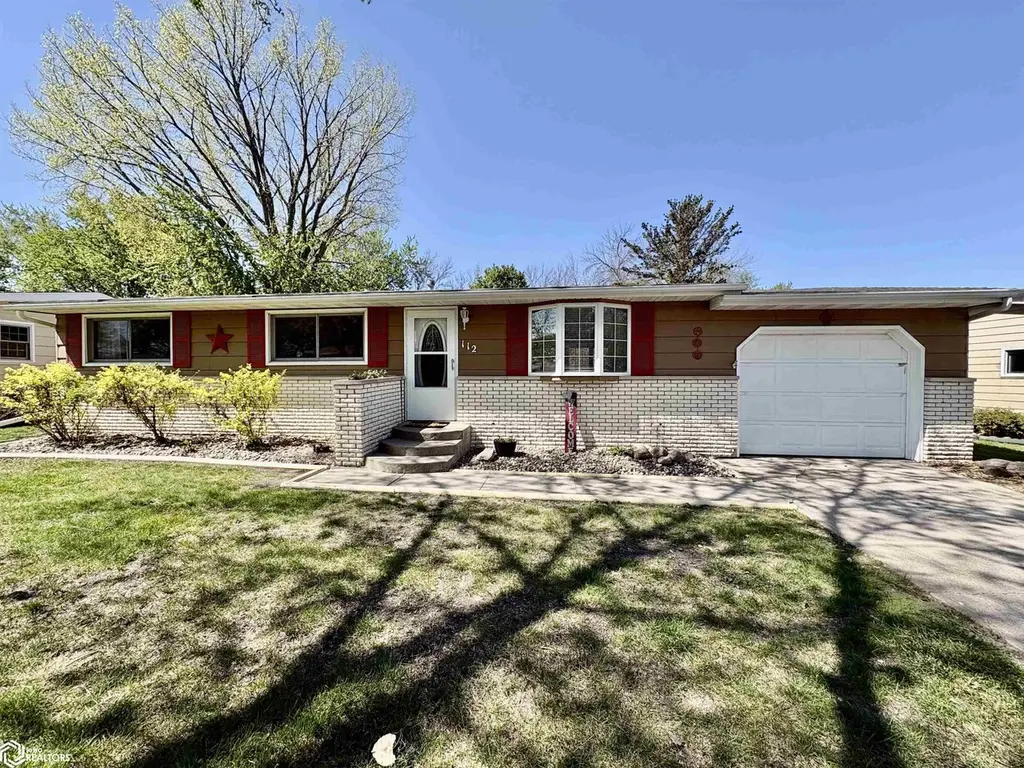
112 Winnebago Way · Forest City, IA
Flood risk 1/10 · Minimal
- FEMA flood zone
- X (unshaded)
- Chance of flooding over 30 yrs
- 0.0%
- Est. flood insurance / yr
- $473 – $860
Fire risk 2/10 · Minimal
- Est. fire insurance / yr
- $902 – $1,676
Heat risk 2/10 · Minimal
- Hot days now (above 100°F)
- 7 days/yr
- Hot days in 30 yrs
- 16 days/yr
Wind risk 2/10 · Minimal
- Chance of severe wind over 30 yrs
- —
Air-quality risk 1/10 · Minimal
- Unhealthy air days now
- 0 days/yr
- Unhealthy air days in 30 yrs
- 0 days/yr
Risk factors via First Street. Map © Google.
Why this score? — see what drove the D grade
The composite is a weighted blend of 9 inputs, each scored 0–100. Each bar is that input's sub-score; the figure is the points it added to the 100-point composite (weight × sub-score).
- ARV discount +15.0/15.0
- Cash flow +7.7/30.0
- Schools +6.1/10.0
- Livability +3.9/5.0
- Rent growth +2.5/5.0
- Condition / age +2.5/5.0
- 1% rule +2.1/10.0
- DSCR +1.8/10.0
- Appreciation +0.0/10.0
$139,500
🖨 Deal sheet (PDF) 📄 Offer letter ✓ Due diligence
Listing remarks
This home offers an inviting open-concept design, w/ a vaulted ceiling that creates a sense of spaciousness & connects the main living areas. The eat-in kitchen features an island & solid surface countertops. An open staircase adds interest to the LR. Natural light pours into the living areas through a LR picture window & the patio door in the dining area. An over-sized primary BR offers 3 closets, 2 w/ hanging rods & 1 w/ shelving. There's a second BR on the ML. The main bath, w/ tub & shower, has tiled flooring. A dedicated ML storage room, w/ shelving, offers the potential for a ML laundry, appealing to buyers seeking one-level living! The LL expands the liv
Key facts
- Vaulted ceiling
- Picture window
- Natural light
Tags
Property features AI
Exterior
- Parking: Attached garage; Concrete driveway/parking; Garage door opener; 1-car garage
- Utilities: Public water; Public sewer; Electric with circuit breakers
- Home design: Single-family residence; Residential property
- Construction: HardiPlank-type siding
- Exterior features: Shingle roof; Storage structure
Interior
- Kitchen: Range; Microwave; Refrigerator
- Bathrooms: 1 full bathroom; 1 three-quarter bathroom
- Heating & cooling: Forced air heating; Central air conditioning
- Interior features: Water softener (owned); Basement
- Laundry & utility: Washer; Dryer
Neighborhood map
What this means for you Summary
Snapshot
- This is a 2-bed/1.0-bath single-family listed at $140k.
Deal economics
- At list price, monthly cash flow is $-159 ($-2k/yr) — negative.
- To cash-flow at today's rent, offer at most $111k (20.1% below list).
- To meet the 1% rule (rent ≥ 1% of price), the offer needs to be $99k (28.8% below list).
- Recommended offer: $99k (28.8% below list) — sets the bar for 1% rule.
- Cap rate 4.9% vs local median 4.1% in Forest City — meaningfully above typical; check what's discounted (condition, days-on-market, listing class) to confirm the premium yield is real.
Location & tenants
- Location reads 77/100 on livability (#160 in IA, #2,902 nationally) — a middle-class / working-renter tenant base. Strengths: cost of living A+, health & safety A+, housing A; Watch: employment C-, amenities F, commute F.
- Forest City Community School District (town): math 67% / reading 78% proficiency, ranked #111 of 289 in IA (top 38%) — strong family-tenant draw, lease renewals of 3-5y typical.
- Zoned schools: Forest City Elementary School (math 62% / reading 72%, grade B+, #273 of 616 statewide, top 51%, 487 students, 39% FRL); Forest City Middle School (math 69% / reading 83%, grade A, #59 of 246 statewide, top 26%, 330 students, 41% FRL); Forest City High School (math 66% / reading 75%, grade B+, #140 of 336 statewide, top 43%, 324 students, 35% FRL).
- Market conditions: 45 active listings in the ZIP; 6 units permitted in Winnebago County in 2024 (0 in 5+ unit buildings).
Forward outlook
- Local home prices are declining (-3.0%/yr); year-one equity from $964 of loan paydown is wiped out by about $4k of value loss. Plan a longer hold.
- Winnebago County population projected at -10% by 2050 — secular population decline; favor cash flow + early exit over multi-decade hold.
Negotiation context
- It's been on market 42 days — a 3% lower offer ($135k) is reasonable based on typical stale-listing flexibility.
Questions for the listing agent
- What do current leases actually rent for vs. the listed asking? Can we see a recent rent roll and the last 12 months of T-12 income?
- It's been on market 42 days. Have you received any prior offers? Is the seller open to a 29% concession, seller financing, or rate buy-down credit?
- Built in 1972 — when were the roof, HVAC, electrical panel, plumbing, and water heater last replaced?
- Is there a deadline driving the sale (1031 exchange, divorce, estate, relocation)? That informs how much negotiation room exists.
- Schools are B-rated — typically a magnet for longer-tenancy family renters. What's the average tenant stay here, and is there a school-zone premium baked into asking?
- The area grade is low — what's the realistic commute time and amenity access for the typical tenant pool here? Any planned neighborhood developments (good or bad) we should know about?
- What's the average days-on-market for RENTAL listings here right now (not sales)? A rising rental-DOM trend means longer vacancies and softer asking-rent achievability than the comps imply.
- What's the recent tenant-quality profile in this submarket — average credit score on applications, eviction rate, late-payment / NSF rate, and stable-employment percentage? A property-management company in the area should have these aggregated.
- How much new for-sale + rental construction is in the pipeline within 1–3 miles? Heavy new supply typically softens prices + rents 12–24 months out; constrained supply supports both.
Investment metrics
- 1% rule
- 0.71% ✗
- Cap rate
- 4.93%
- Cash-on-cash
- -4.88%
- DSCR
- 0.78
- GRM
- 11.7
CMA / ARV
- ARV (median comp)
- $212,600
- List price
- $139,500
- Delta
- -34.38%
- Verdict
- UNDERPRICED
- Comps
- 20 within 1.0 mi
Show comp detail 8 sales within ~0.75 mi
| Address | Dist | Beds/Ba | Sqft | Sold | Price | $/sf | Match |
|---|---|---|---|---|---|---|---|
| 110 Indian Ave | 0.19mi | 3/2.0 (+1) | 1,092 (-6%) | 8mo | $180,000 | $165 | 66 |
| 1515 W I St | 0.32mi | 2/1.0 | 1,088 (-6%) | 19mo | $119,500 | $110 | 59 |
| 715 W J St | 0.58mi | 1/2.5 (-1) | 1,164 (+0%) | 12mo | $155,000 | $133 | 51 |
| 746 W M St | 0.71mi | 2/1.0 | 1,065 (-8%) | 8mo | $27,500 | $26 | 47 |
| 946 W M St | 0.65mi | 3/1.0 (+1) | 1,088 (-6%) | 16mo | $123,000 | $113 | 42 |
| 106 Lawnsdale Ct | 0.15mi | 3/3.0 (+1) | 1,304 (+13%) | 22mo | $243,000 | $186 | 41 |
| 215 N 10th St | 0.70mi | 3/1.0 (+1) | 1,037 (-10%) | 5mo | $61,000 | $59 | 41 |
| 536 W K St | 0.68mi | 3/1.5 (+1) | 1,046 (-10%) | 9mo | $95,000 | $91 | 38 |
Match score weights: distance 35% · size 25% · config 20% · recency 20%. Top-matched comps best support the ARV.
Projected returns pro-forma
-3.0% appreciation · 3.0% rent growth · sell at horizon
- IRR
- -24.6%
- Equity multiple
- 0.16×
- Total profit
- $-32,717
- Equity at exit
- $20,800
- IRR
- -20.2%
- Equity multiple
- -0.06×
- Total profit
- $-41,504
- Equity at exit
- $12,061
Cash invested: $39,060 (down + closing). Projections, not guarantees.
Landlord ↔ Tenant lean methodology
- Overall (STATE)
- 83 Strongly Landlord-Friendly
- State Iowa
- 83 Strongly Landlord-Friendly · R+6
- County
- — inherits STATE
- City
- — inherits STATE
ZIP-level market 50436
- Home prices YoY
- -25.3%
- Active inventory
- 45
- Price-to-rent
- 11.7×
Monthly cashflow live
- Estimated rent
- $993 medium interval (Pro) →
- Mortgage (P&I)
- −$732
- Tax from tax record
- −$154 /mo · $1,842/yr
- Insurance
- −$58
- HOA
- −$0
- Vacancy / Maint / Mgmt
- −$209
- Net cashflow
- $-159
Break-even live
Sensitivity live
| Price | -10% $-80 | -5% $-119 | +0% $-159 | +5% $-198 | +10% $-238 |
|---|---|---|---|---|---|
| Rent | -10% $-237 | -5% $-198 | +0% $-159 | +5% $-120 | +10% $-80 |
| Rate | -1.0pp $-89 | -0.5pp $-123 | base $-159 | +0.5pp $-195 | +1.0pp $-232 |
UW: 25.0% down · 7.5% · 30yr · 1.5% tax · 5.0% vac · 8.0% maint · 8.0% mgmt
Financing live
Cash to close
- Down payment
- $34,875
- Closing costs
- $4,185
- Reserves months
- —
- Total cash needed
- —
Loan-product check · same deal, 3 products live
Conventional
25% down · 7.5% · 30yr
- Down + closing
- —
- Monthly P&I
- —
- Monthly cashflow
- —
- DSCR
- —
- Eligible?
- —
Personal DTI + credit; lowest rate.
DSCR
20% down · 8.5% · 30yr
- Down + closing
- —
- Monthly P&I
- —
- Monthly cashflow
- —
- DSCR
- —
- Eligible?
- —
No personal income docs; deal must DSCR.
Hard money
10% down · 12.0% · 12mo
- Down + closing
- —
- Monthly P&I
- —
- Monthly cashflow
- —
- DSCR
- —
- Eligible?
- —
Short-term bridge; refi at stabilization.
Listing history 19 events
-
2026-06-22days on market $139,500 Active 42 DOM
-
2026-06-21days on market $139,500 Active 41 DOM
-
2026-06-21days on market $139,500 Active 40 DOM
-
2026-06-18days on market $139,500 Active 38 DOM
-
2026-06-17days on market $139,500 Active 37 DOM
-
2026-06-16pricedays on market $139,500 Active 36 DOM
-
2026-06-15days on market $149,500 Active 35 DOM
-
2026-06-13days on market $149,500 Active 33 DOM
-
2026-06-12days on market $149,500 Active 32 DOM
-
2026-06-09days on market $149,500 Active 29 DOM
-
2026-06-08days on market $149,500 Active 28 DOM
-
2026-06-07days on market $149,500 Active 27 DOM
-
2026-06-07days on market $149,500 Active 26 DOM
-
2026-06-04days on market $149,500 Active 23 DOM
-
2026-06-02days on market $149,500 Active 22 DOM
-
2026-06-01days on market $149,500 Active 21 DOM
-
2026-05-31days on market $149,500 Active 20 DOM
-
2026-05-31days on market $149,500 Active 19 DOM
-
2026-05-11$155,000 Active 1556-char remark
ⓘ Source: listings_history table (triggers on properties + properties_extension) + one-shot
backfill from property_details.listing_events for pre-trigger history.
Tax reassessment forecast IA · Partial reset (capped growth)
- Current annual tax
- $1,842 · $154/mo
- Projected year-2 tax
- $2,016 · $168/mo
- Expected delta
- +$174/yr (+$15/mo · 9.5%)
ⓘ Screening estimate from a state-policy table — verify with the county assessor before closing.
Climate risk First Street
- Flood 1/10 Low FEMA zone X (unshaded) · 0% chance over 30 yrs
- Wildfire 2/10 Low
- Heat 2/10 Low 7 d/yr ≥100°F today · 16 d/yr by 30 yrs out
- Wind 2/10 Low
- Air quality 1/10 Low 0 unhealthy d/yr today · 0 by 30 yrs out
Nearby sold comps map
Loading sold comps map…
Walkable amenities ~0.75 mi
Loading nearby amenities…
Taxation est. · year 1
- Rental income
- $11,915
- − Mortgage interest
- −$7,814
- − Property taxes
- −$1,842
- − Insurance
- −$698
- − Repairs & maintenance
- −$953
- − Management
- −$953
- − Depreciation
- −$4,058
- Taxable loss
- −$4,404
- Est. tax savings @ 24.0%
- +$1,057
- After-tax cash flow
- $-849/yr
For passive investors: Depreciation is non-cash, so a rental often shows a tax loss while cash-flowing — sheltering income. Rental losses are passive: they offset passive income freely, and up to $25,000/yr can offset ordinary (W-2) income if you actively participate and your MAGI is under $100k (phasing out to $0 by $150k); unused losses carry forward. On sale, claimed depreciation is recaptured at up to 25%, and gains may owe capital-gains tax (a 1031 exchange can defer both). Figures are a year-1 estimate at your 24.0% rate — not tax advice; consult a CPA.
Schools (NCES district)
- District
- Forest City Community School District
- NCES district ID
- 1911790
- Math proficiency
- 67% ▼ -10.00%
- Reading proficiency
- 78% ▲ 1.00%
- Median HH income
- $46,674
- Composite
- 61.08/100
- National rank
- #789
- State rank
- #111 of 289 in IA
Livability — Forest City
- Score
- 77/100
- State rank
- #160
- US rank
- #2902
Category grades
Schools grade is shown separately in the Schools card above.
Census & demographics
- Census place
- Forest City, IA
- Population (ZIP)
- 5,760
Population outlook (Winnebago County) Hauer SSP2
- Today (2025)
- 10,099 people
- By 2030
- 9,831 · -2.7%
- By 2040
- 9,326 · -7.7%
- By 2050
- 9,073 · -10.2%
- By 2075
- 9,448 · -6.4%
- By 2100
- 10,279 · +1.8%
Race, ethnicity, and origin ACS 2023
- Neighborhood character
- Predominantly White (88%)
- Race & ethnicity
- White 88% Asian 6% Hispanic / Latino 4% Two or more races 2%
- Common ancestry
- Portuguese 21% Romanian 2% Iranian 1%
- Foreign-born
- 5% · China, Canada, Vietnam
- Languages at home
- 92% English-only · Tagalog/Filipino 2% Spanish 2% Other Indo-European 1%
Political lean MEDSL · Winnebago
- 2024 margin
- Solid R (+30.7) · D 33.9% · R 64.6% · Other 1.5%
- 2008→2024 swing
- -39.3pp toward R · 2008: 8.6pp · 2024: -30.7pp
- All cycles
- 2024: R+30.7 2020: R+26.3 2016: R+26.5 2012: R+0.0 2008: D+8.6
Not yet ingested
- Civics
- —
Market trends
- HPI YoY
- ▼ -63.62%
- Current HPI
- 187.8639
- Rent YoY
- —
- Metro
- —
- State GDP YoY
- ▲ 2.48%
- F500 in state
- 4
Industry mix (Fortune 500 HQ in IA)
| Industry | F500 HQs | Revenue |
|---|---|---|
| Financial Services | 1 | $16B |
|
||
| Retail / Convenience | 1 | $15B |
|
||
Price history
-10.0% since first listed3 events — show timeline
- 2026-06-16 Price Changed $139,500 IAR
- 2026-05-28 Price Changed $149,500 IAR
- 2026-05-11 Listed $155,000 IAR
Property tax history
+4.1%/yrLatest (2025): $1,842 · +5.0% YoY. Source: county tax records.
Cash-flow waterfall
monthlySold comps — $/sqft
last 12 mo · ≤1 miLoading sold comps…