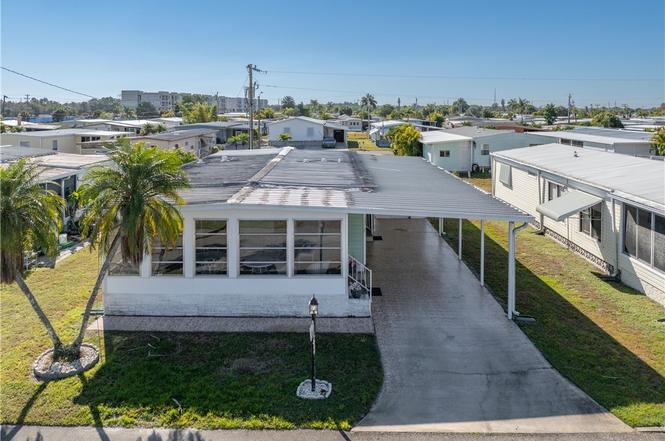
3310 Rainbow Ln · North Fort Myers, FL
Flood risk 1/10 · Minimal
- FEMA flood zone
- X (shaded)
- Chance of flooding over 30 yrs
- 0.0%
- Est. flood insurance / yr
- $507 – $1,088
Fire risk 4/10 · Minor
- Est. fire insurance / yr
- $947 – $1,759
Heat risk 10/10 · Severe
- Hot days now (above 107°F)
- 7 days/yr
- Hot days in 30 yrs
- 29 days/yr
Wind risk 10/10 · Severe
- Chance of severe wind over 30 yrs
- 99.0%
Air-quality risk 2/10 · Minimal
- Unhealthy air days now
- 1 days/yr
- Unhealthy air days in 30 yrs
- 1 days/yr
Risk factors via First Street. Map © Google.
Why this score? — see what drove the B+ grade
The composite is a weighted blend of 9 inputs, each scored 0–100. Each bar is that input's sub-score; the figure is the points it added to the 100-point composite (weight × sub-score).
- Cash flow +30.0/30.0
- ARV discount +15.0/15.0
- 1% rule +10.0/10.0
- DSCR +10.0/10.0
- Schools +4.1/10.0
- Livability +3.7/5.0
- Condition / age +2.5/5.0
- Rent growth +2.0/5.0
- Appreciation +0.0/10.0
$75,000
🖨 Deal sheet 📄 Offer letter ✓ Due diligence
Listing remarks
Welcome to 3310 Rainbow, a well-maintained home offering numerous updates and consistent care over the years. The primary bathroom features a new vanity and fixtures (2025), while new flooring in the kitchen, hallway, and bathrooms was installed in 2024, giving the home a refreshed and updated feel. Most of the interior has been repainted within the last few years, enhancing the bright and well-kept appearance. The home received a full reroof approximately 15 years ago, and the rear roof over the primary bedroom was replaced following the last hurricane for added peace of mind. Additional improvements include new varmint screening installed in 2023 and professional pest control with in-grou
Key facts
- New vanity
- Full reroof
- New flooring
Tags
Property features AI
Finance
- Other: Senior community; 701 units in the community; Pets allowed with conditions (up to 2 pets, max 25 lbs)
- Financial info: Land lease expires 2026-03-30
- HOA & community: Homeowners association (monthly fee); Monthly association fee of $294.39; Association covers management, legal/accounting, reserve fund, street lights, and trash; Community amenities: clubhouse, pool, spa/hot tub, sauna, fitness center, billiard room, library, shuffleboard court, dog park
Exterior
- Parking: Attached carport; 2 covered carport spaces
- Utilities: Public water; Public sewer; Cable not available
- Home design: Manufactured home; Single-story; Entry level: 1; Home faces north; Lot faces south
- Construction: Vinyl siding; Rolled/Hot Mop roof; On-site management; Resale condition
- Exterior features: Shutters (electric); Community pool; None (additional unspecified exterior features)
Interior
- Kitchen: Electric cooktop; Refrigerator; Freezer
- Bedrooms: Florida room (additional living/room type)
- Flooring: Tile
- Bathrooms: 2 full bathrooms
- Heating & cooling: Central heating (electric); Central air conditioning (electric)
- Interior features: Partially furnished; Single hung windows; Tile flooring; Separate shower (shower-only in at least one bath)
- Laundry & utility: Washer; Dryer
Neighborhood map
What this means for you Summary
Snapshot
- This is a 2-bed/2.0-bath manufactured listed at $75k.
Deal economics
- At list price, monthly cash flow is $464 ($6k/yr) — positive.
- The deal already cash-flows at list — no discount required.
- Meets the 1% rule at list price ($2k rent vs $75k).
- Recommended offer: $66k (12.0% below list) — sets the bar for market timing.
- Cap rate 13.7% vs local median 3.6% in North Fort Myers — top-decile yield for the area; either an underpriced asset or a hidden risk that comps aren't pricing in. Stress-test before assuming the spread holds.
Location & tenants
- Location reads 74/100 on livability (#269 in FL, #4,409 nationally) — a middle-class / working-renter tenant base. Strengths: cost of living A+, housing A+, health & safety A+; Watch: employment C-, amenities F, commute F.
- Lee (suburban): math 47% / reading 50% proficiency, ranked #42 of 73 in FL (top 58%) — families likely to look elsewhere, expect single-tenant / working-renter base with shorter leases.
- Market conditions: Rents soft (-1.9%/yr); 472 active listings in the ZIP; 18 comparable units currently listed for rent nearby; rentals at typical pace (median 24d on market — plan ~3-4 weeks tenant-placement turnaround); 15,411 units permitted in Lee County in 2024 (4,686 in 5+ unit buildings).
- This rent runs 34% of the median local income ($57k/yr) — at the standard rent-burdened threshold; future hikes will face affordability resistance.
Forward outlook
- Local home prices are declining (-3.0%/yr); year-one equity from $519 of loan paydown is wiped out by about $2k of value loss. Plan a longer hold.
- Lee County population projected at +44% by 2050 — long-run rental-demand tailwind backs the buy-and-hold thesis.
- At projected returns (-3.0% appreciation + 0.0% rent growth), your $21k cash investment doubles in ~6 years — after that, you're playing with house money.
Negotiation context
- It's been on market 134 days — a 12% lower offer ($66k) is reasonable based on typical stale-listing flexibility.
- Current owner paid $26k; list at $75k implies a 194% gain — meaningful room to come down on a strong offer.
Risks & watch-outs
- Climate carrying-cost: severe wind risk, 99% chance of damaging wind over 30y; extreme-heat days projected 7→29/yr by 2055 (HVAC capex compounding) — expect insurance premiums to compound above CPI over the hold.
Questions for the listing agent
- It's been on market 134 days. Have you received any prior offers? Is the seller open to a 12% concession, seller financing, or rate buy-down credit?
- Built in 1973 — when were the roof, HVAC, electrical panel, plumbing, and water heater last replaced?
- What does the HOA fee cover, when was the last increase, and are there any pending special assessments or reserve-fund shortfalls?
- Why hasn't it sold? Are there any deal-killer items the seller is aware of (foundation, flood, title, zoning, code violations)?
- Is there a deadline driving the sale (1031 exchange, divorce, estate, relocation)? That informs how much negotiation room exists.
- What's the average days-on-market for RENTAL listings here right now (not sales)? A rising rental-DOM trend means longer vacancies and softer asking-rent achievability than the comps imply.
- What's the recent tenant-quality profile in this submarket — average credit score on applications, eviction rate, late-payment / NSF rate, and stable-employment percentage? A property-management company in the area should have these aggregated.
- How much new for-sale + rental construction is in the pipeline within 1–3 miles? Heavy new supply typically softens prices + rents 12–24 months out; constrained supply supports both.
Investment metrics
- 1% rule
- 2.14% ✓
- Cap rate
- 13.71%
- Cash-on-cash
- 26.50%
- DSCR
- 2.18
- GRM
- 3.9
CMA / ARV
- ARV (on-the-fly)
- $96,000
- Comps found
- 6
Show comp detail 6 sales within ~0.75 mi
| Address | Dist | Beds/Ba | Sqft | Sold | Price | $/sf | Match |
|---|---|---|---|---|---|---|---|
| 16034 Citron Way | 0.32mi | 2/2.0 | 960 (0%) | 7mo | $125,000 | $130 | 79 |
| 16041 Citron Way | 0.34mi | 2/2.0 | 960 (0%) | 6mo | $92,000 | $96 | 78 |
| 3541 Celestial Way | 0.22mi | 2/2.0 | 864 (-10%) | 7mo | $50,000 | $58 | 67 |
| 974 Restful Rd | 0.71mi | 2/2.0 | 960 (0%) | 3mo | $109,575 | $114 | 64 |
| 3204 Pluto Cir | 0.38mi | 2/2.0 | 1,104 (+15%) | 7mo | $110,000 | $100 | 51 |
| 3500 Celestial Way | 0.13mi | 2/2.0 | 1,100 (+15%) | 24mo | $85,000 | $77 | 50 |
Match score weights: distance 35% · size 25% · config 20% · recency 20%. Top-matched comps best support the ARV.
Projected returns pro-forma
-3.0% appreciation · 0.0% rent growth · sell at horizon
- IRR
- 16.0%
- Equity multiple
- 1.61×
- Total profit
- $12,874
- Equity at exit
- $11,183
- IRR
- 21.6%
- Equity multiple
- 2.52×
- Total profit
- $31,850
- Equity at exit
- $6,485
Cash invested: $21,000 (down + closing). Projections, not guarantees.
Landlord ↔ Tenant lean methodology
- Overall (STATE)
- 87 Strongly Landlord-Friendly
- State Florida
- 87 Strongly Landlord-Friendly · R+3
- County
- — inherits STATE
- City
- — inherits STATE
ZIP-level market 33903
- Rents YoY
- -1.9%
- Active inventory
- 472
- Price-to-rent
- 3.9×
Monthly cashflow live
- Estimated rent
- $1,608 high interval (Pro) →
- Mortgage (P&I)
- −$393
- Tax from tax record
- −$88 /mo · $1,058/yr
- Insurance
- −$31
- HOA
- −$294
- Vacancy / Maint / Mgmt
- −$338
- Net cashflow
- $464
Break-even live
UW: 25.0% down · 7.5% · 30yr · 1.5% tax · 5.0% vac · 8.0% maint · 8.0% mgmt
Financing live
Cash to close
- Down payment
- $18,750
- Closing costs
- $2,250
- Reserves months
- —
- Total cash needed
- —
Loan-product check · same deal, 3 products live
Conventional
25% down · 7.5% · 30yr
- Down + closing
- —
- Monthly P&I
- —
- Monthly cashflow
- —
- DSCR
- —
- Eligible?
- —
Personal DTI + credit; lowest rate.
DSCR
20% down · 8.5% · 30yr
- Down + closing
- —
- Monthly P&I
- —
- Monthly cashflow
- —
- DSCR
- —
- Eligible?
- —
No personal income docs; deal must DSCR.
Hard money
10% down · 12.0% · 12mo
- Down + closing
- —
- Monthly P&I
- —
- Monthly cashflow
- —
- DSCR
- —
- Eligible?
- —
Short-term bridge; refi at stabilization.
Rent comps 18 comps
| Address | Beds | Baths | Sqft | Rent | $/sqft | DOM | Units | Dist |
|---|---|---|---|---|---|---|---|---|
| 3404 Rainbow Ln North Fort Myers, FL | 2.0 | 2.0 | 1056 | $1,800 | $1.70 | 3d | 1 | 0.24mi |
| 28 Nyborg Ave North Fort Myers, FL | 3.0 | 2.0 | 1042 | $1,299 | $1.25 | 14d | 1 | 0.38mi |
| 2774 Wedgewood Dr North Fort Myers, FL | 2.0 | 2.0 | 880 | $1,300 | $1.48 | 23d | 1 | 0.59mi |
| 8791 Littleton Rd North Fort Myers, FL | 2.0 | 2.0 | 1074 | $1,549 | $1.44 | 23d | 1 | 0.70mi |
| 4120 Pine Drop Ln North Fort Myers, FL | 3.0 | 2.0 | 957 | $1,895 | $1.98 | 23d | 1 | 0.81mi |
| 571 Sunrise Ln North Fort Myers, FL | 2.0 | 2.0 | 1004 | $1,400 | $1.39 | 23d | 1 | 0.92mi |
| 2095 Eloise Cir North Fort Myers, FL | 2.0 | 1.0 | 840 | $1,295 | $1.54 | 23d | 1 | 1.04mi |
| 2027 Eloise Cir North Fort Myers, FL | 2.0 | 1.0 | 822 | $1,300 | $1.58 | 3d | 1 | 1.07mi |
| 3260 Stockton St North Fort Myers, FL | 3.0 | 1.0–2.0 | 976 | $2,371 | $2.43 | 1d | 27 | 1.15mi |
| 16363 Teresa Ln North Fort Myers, FL | 2.0 | 1.0 | 1000 | $1,000 | $1.00 | 23d | 1 | 1.18mi |
| 3953 Pomodoro Cir Cape Coral, FL | 1.0–3.0 | 1.0–2.0 | 1044 | $1,462 | $1.40 | 14d | 9 | 1.24mi |
| 538 State St North Fort Myers, FL | 3.0 | 1.5 | 1000 | $1,199 | $1.20 | 23d | 1 | 1.27mi |
| 260 Stockton St North Fort Myers, FL | 2.0 | 2.0 | 924 | $1,200 | $1.30 | 3d | 1 | 1.29mi |
| 248 Stockton St North Fort Myers, FL | 3.0 | 2.0 | 924 | $1,300 | $1.41 | 23d | 1 | 1.30mi |
| 247 Stockton St North Fort Myers, FL | 3.0 | 2.0 | 924 | $1,325 | $1.43 | 23d | 1 | 1.32mi |
| 3940 Villa Del Mar CIR Cape Coral, FL | 1.0–3.0 | 1.0–2.0 | 1051 | $2,116 | $2.01 | 1d | 21 | 1.32mi |
| 2700 Diplomat Pkwy E Cape Coral, FL | 1.0–3.0 | 1.0–2.0 | 1116 | $2,382 | $2.13 | 3d | 41 | 1.36mi |
| 446 San Bernardino St North Fort Myers, FL | 2.0 | 1.0 | 1104 | $1,590 | $1.44 | 10d | 1 | 1.43mi |
HOA detail
- Monthly dues
- $294 · $3,528/yr
Listing history 4 events
-
2026-05-20status Pending
-
2026-04-15price $75,000
-
2026-01-01$85,000 Active
-
1974-04-01soldstatus $25,500
ⓘ Source: listings_history table (triggers on properties + properties_extension) + one-shot
backfill from property_details.listing_events for pre-trigger history.
Tax reassessment forecast FL · Resets to sale price
- Current annual tax
- $1,058 · $88/mo
- Projected year-2 tax
- $1,058 · $88/mo
- Expected delta
- $0/yr ($0/mo · 0.0%)
ⓘ Screening estimate from a state-policy table — verify with the county assessor before closing.
Climate risk First Street
- Flood 1/10 Low FEMA zone X (shaded) · 0% chance over 30 yrs
- Wildfire 4/10 Moderate
- Heat 10/10 Extreme 7 d/yr ≥107°F today · 29 d/yr by 30 yrs out
- Wind 10/10 Extreme 99% chance of damaging wind over 30 yrs
- Air quality 2/10 Low 1 unhealthy d/yr today · 1 by 30 yrs out
Nearby sold comps map
Loading sold comps map…
Walkable amenities ~0.75 mi
Loading nearby amenities…
Taxation est. · year 1
- Rental income
- $19,299
- − Mortgage interest
- −$4,201
- − Property taxes
- −$1,058
- − Insurance
- −$375
- − Repairs & maintenance
- −$1,544
- − Management
- −$1,544
- − HOA
- −$3,528
- − Depreciation
- −$2,182
- Taxable income
- $4,867
- Est. tax owed @ 24.0%
- −$1,168
- After-tax cash flow
- $4,397/yr
For passive investors: Depreciation is non-cash, so a rental often shows a tax loss while cash-flowing — sheltering income. Rental losses are passive: they offset passive income freely, and up to $25,000/yr can offset ordinary (W-2) income if you actively participate and your MAGI is under $100k (phasing out to $0 by $150k); unused losses carry forward. On sale, claimed depreciation is recaptured at up to 25%, and gains may owe capital-gains tax (a 1031 exchange can defer both). Figures are a year-1 estimate at your 24.0% rate — not tax advice; consult a CPA.
Schools (NCES district)
- District
- Lee
- NCES district ID
- 1201080
- Math proficiency
- 47% ▼ -11.00%
- Reading proficiency
- 50% ▼ -4.00%
- Median HH income
- $49,518
- Composite
- 41.49/100
- National rank
- #3458
- State rank
- #42 of 73 in FL
Livability — North Fort Myers
- Score
- 74/100
- State rank
- #269
- US rank
- #4409
Category grades
Schools grade is shown separately in the Schools card above.
Census & demographics
- Census place
- North Fort Myers, FL
- County
- Lee County · 788,662 people
- City population
- 57,035
- Metro
- Cape Coral-Fort Myers, FL
- Population (ZIP)
- 23,655
- Household income
- $56,993
- Rent vs Own
- Severe rent burden
- 468.0
Population outlook (Lee County) Hauer SSP2
- Today (2025)
- 871,946 people
- By 2030
- 955,468 · +9.6%
- By 2040
- 1,113,587 · +27.7%
- By 2050
- 1,256,891 · +44.1%
- By 2075
- 1,560,270 · +78.9%
- By 2100
- 1,726,848 · +98.0%
Race, ethnicity, and origin ACS 2023
- Neighborhood character
- Predominantly White (81%)
- Race & ethnicity
- White 81% Hispanic / Latino 14% Two or more races 8% Black 2%
- Hispanic origin (detail)
- Mexican 3% Puerto Rican 3% Cuban 3%
- Common ancestry
- Lithuanian 4% Romanian 4% Italian 3%
- Foreign-born
- 11% · Canada
- Languages at home
- 88% English-only · Spanish 9% Other Indo-European 1%
Political lean MEDSL · Lee
- 2024 margin
- Strong R (+28.4) · D 35.5% · R 63.9%
- 2008→2024 swing
- -18.0pp toward R · 2008: -10.4pp · 2024: -28.4pp
- All cycles
- 2024: R+28.4 2020: R+19.2 2016: R+20.4 2012: R+16.6 2008: R+10.4
Not yet ingested
- Civics
- —
Market trends
- HPI YoY
- ▼ -172.26%
- Current HPI
- 256.773
- Rent YoY
- ▼ -1.94%
- Metro
- Cape Coral-Fort Myers, FL
- State GDP YoY
- ▲ 3.28%
- F500 in state
- 36
Industry mix (Fortune 500 HQ in FL)
| Industry | F500 HQs | Revenue |
|---|---|---|
| Industrial Technology | 2 | $29B |
|
||
| Insurance | 2 | $17B |
|
||
| Retail | 1 | $60B |
|
||
| Technology Distribution | 1 | $58B |
|
||
| Homebuilding | 1 | $35B |
|
||
| Technology Manufacturing | 1 | $35B |
|
||
Price history
+194.1% since first listed4 events — show timeline
- 2026-05-20 Pending — FORTMLS
- 2026-04-15 Price Changed $75,000 FORTMLS
- 2026-01-01 Listed $85,000 FORTMLS
- 1974-04-01 Sold (Public Records) $25,500 Public Records
Property tax history
+3.9%/yrLatest (2025): $1,058 · -3.0% YoY. Source: county tax records.
Cash-flow waterfall
monthlySold comps — $/sqft
last 12 mo · ≤1 miLoading sold comps…