 🌊 Lakefront
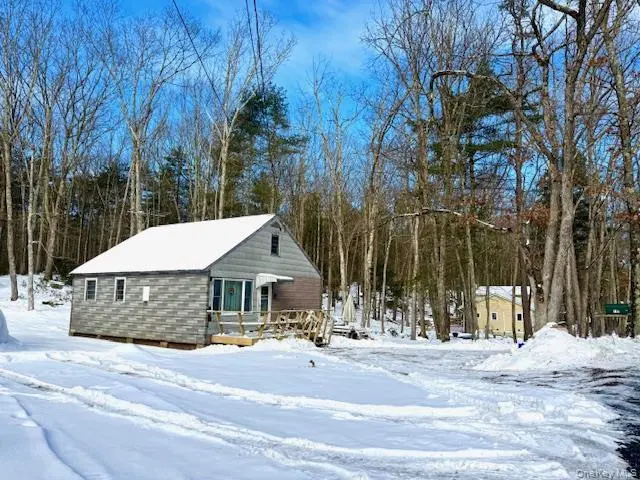
195 W Mohican Trl · Eldred, NY
Flood risk 1/10 · Minimal
- FEMA flood zone
- X (unshaded)
- Chance of flooding over 30 yrs
- 0.0%
- Est. flood insurance / yr
- $507 – $1,088
Fire risk 3/10 · Minor
- Est. fire insurance / yr
- $691 – $1,283
Heat risk 2/10 · Minimal
- Hot days now (above 92°F)
- 7 days/yr
- Hot days in 30 yrs
- 15 days/yr
Wind risk 3/10 · Minor
- Chance of severe wind over 30 yrs
- 6.0%
Air-quality risk 2/10 · Minimal
- Unhealthy air days now
- 1 days/yr
- Unhealthy air days in 30 yrs
- 1 days/yr
Risk factors via First Street. Map © Google.
Why this score? — see what drove the D grade
The composite is a weighted blend of 9 inputs, each scored 0–100. Each bar is that input's sub-score; the figure is the points it added to the 100-point composite (weight × sub-score).
- Appreciation +10.0/10.0
- Cash flow +9.2/30.0
- ARV discount +5.6/15.0
- Schools +3.6/10.0
- 1% rule +3.3/10.0
- DSCR +2.6/10.0
- Rent growth +2.5/5.0
- Livability +2.5/5.0
- Condition / age +2.5/5.0
$189,000
🖨 Deal sheet 📄 Offer letter ✓ Due diligence
Listing remarks MLS
Here's your chance to purchase a Country cottage with access to a beautiful 200+ acre natural lake for motor boating, fishing and swimming. Just imagine swimming to your hearts content and waterskiing in the summer, ice skating or ice fishing in the winter months! This charming cabin has an open floor plan perfect for a 3 season get-a-way. 100 amp electric, good septic and drilled well along with front and back decks. Full attic is easily accessible with pull down stairs could easily make additional living space. Attic has a gas furnace waiting be installed (you'll need to get the proper permits) to make this a year round, 4 season home. With some updates and renovations this cozy cabin can be your lakefront dream cottage! The bones are good, built in 1962 and built to last! Join the Mohican lake tax payers association to use the area boat launch and access Mohican Lake. Within 30 minutes to all area amenities including the Forestburgh playhouse, Bethel Woods for music venues, Resort World Catskills for gambling, the Delaware river, Port Jervis commuter trains, Barryville farmers market Mast Hope Mountain for snow skiing and so much more! Added bonus Within 2 hours to NYC. Lake Views and lake access close by makes this spot the perfect choice to enjoy lake living!
Key facts
- Open floor plan
- Natural lake access
- Updated electric
Tags
Neighborhood map
What this means for you Summary
Snapshot
- This is a 2-bed/1.0-bath single-family listed at $189k.
Deal economics
- At list price, monthly cash flow is $-141 ($-2k/yr) — negative.
- To cash-flow at today's rent, offer at most $164k (13.1% below list).
- To meet the 1% rule (rent ≥ 1% of price), the offer needs to be $157k (16.9% below list).
- Recommended offer: $157k (16.9% below list) — sets the bar for 1% rule.
- Cap rate 5.4% vs local median 2.2% in Eldred — top-decile yield for the area; either an underpriced asset or a hidden risk that comps aren't pricing in. Stress-test before assuming the spread holds.
Location & tenants
- Location reads: area grade D — affects rentability + tenant quality, not the cash-flow math above.
- Eldred Central School District (rural): math 33% / reading 50% proficiency, ranked #495 of 590 in NY (top 84%) — families likely to look elsewhere, expect single-tenant / working-renter base with shorter leases.
- Market conditions: 66 active listings in the ZIP; 739 units permitted in Sullivan County in 2024 (5 in 5+ unit buildings).
Forward outlook
- In year one you build about $20k of equity ($1k loan paydown + $19k appreciation (10.0% local appreciation)).
- Sullivan County population projected at -24% by 2050 — secular population decline; favor cash flow + early exit over multi-decade hold.
- By year 2, paydown + projected appreciation supports a ~$32k cash-out refi (75% LTV) — recoverable capital for the next deal without selling this one.
Negotiation context
- It's been on market 163 days — a 12% lower offer ($166k) is reasonable based on typical stale-listing flexibility.
- 3 sale attempts since 3y ago; this cycle's ask has dropped $10k (5%) from the opening price — seller is motivated, your offer sets the floor, not the list.
- Current owner paid $28k; list at $189k implies a 575% gain — meaningful room to come down on a strong offer.
Questions for the listing agent
- What do current leases actually rent for vs. the listed asking? Can we see a recent rent roll and the last 12 months of T-12 income?
- It's been on market 163 days. Have you received any prior offers? Is the seller open to a 17% concession, seller financing, or rate buy-down credit?
- Built in 1962 — when were the roof, HVAC, electrical panel, plumbing, and water heater last replaced?
- Why hasn't it sold? Are there any deal-killer items the seller is aware of (foundation, flood, title, zoning, code violations)?
- Is there a deadline driving the sale (1031 exchange, divorce, estate, relocation)? That informs how much negotiation room exists.
- The area grade is low — what's the realistic commute time and amenity access for the typical tenant pool here? Any planned neighborhood developments (good or bad) we should know about?
- This sits on a lake — are riparian / water-frontage rights deeded with the parcel? Any dock permits, shoreline easements, or HOA water-use restrictions?
- What's the documented flood / surge / shoreline-erosion history here (FEMA AND non-FEMA — e.g., storm surge, creek backup, septic-field saturation)?
- Any water-quality or seasonal algae-bloom issues that affect tenant satisfaction or short-term-rental demand?
- What's the average days-on-market for RENTAL listings here right now (not sales)? A rising rental-DOM trend means longer vacancies and softer asking-rent achievability than the comps imply.
- What's the recent tenant-quality profile in this submarket — average credit score on applications, eviction rate, late-payment / NSF rate, and stable-employment percentage? A property-management company in the area should have these aggregated.
- How much new for-sale + rental construction is in the pipeline within 1–3 miles? Heavy new supply typically softens prices + rents 12–24 months out; constrained supply supports both.
Investment metrics
- 1% rule
- 0.83% ✗
- Cap rate
- 5.40%
- Cash-on-cash
- -3.19%
- DSCR
- 0.86
- GRM
- 10.0
CMA / ARV
- ARV (median comp)
- $181,347
- List price
- $189,000
- Delta
- 4.22%
- Verdict
- FAIR
- Comps
- 17 within 1.0 mi
Show comp detail 4 sales within ~0.75 mi
| Address | Dist | Beds/Ba | Sqft | Sold | Price | $/sf | Match |
|---|---|---|---|---|---|---|---|
| 11 Reindeer Ter | 0.20mi | 2/1.0 | 624 (-2%) | 6mo | $70,000 | $112 | 83 |
| 53 Cahoonzie Trl | 0.41mi | 2/1.0 | 635 (-0%) | 24mo | $174,000 | $274 | 60 |
| 31 Minisink Trl | 0.69mi | 2/1.0 | 680 (+7%) | 8mo | $185,000 | $272 | 50 |
| 16 Beach Rd | 0.58mi | 1/1.0 (-1) | 700 (+10%) | 8mo | $241,000 | $344 | 44 |
Match score weights: distance 35% · size 25% · config 20% · recency 20%. Top-matched comps best support the ARV.
Projected returns pro-forma
10.0% appreciation · 3.0% rent growth · sell at horizon
- IRR
- 22.0%
- Equity multiple
- 2.78×
- Total profit
- $94,045
- Equity at exit
- $170,266
- IRR
- 19.8%
- Equity multiple
- 6.37×
- Total profit
- $284,131
- Equity at exit
- $367,185
Cash invested: $52,920 (down + closing). Projections, not guarantees.
Landlord ↔ Tenant lean methodology
- Overall (STATE)
- 15 Strongly Tenant-Friendly
- State New York
- 15 Strongly Tenant-Friendly · D+10
- County
- — inherits STATE
- City
- — inherits STATE
ZIP-level market 12737
- Active inventory
- 66
- Price-to-rent
- 10.0×
Monthly cashflow live
- Estimated rent
- $1,570 medium interval (Pro) →
- Mortgage (P&I)
- −$991
- Tax from tax record
- −$311 /mo · $3,730/yr
- Insurance
- −$79
- HOA
- −$0
- Vacancy / Maint / Mgmt
- −$330
- Net cashflow
- $-141
Break-even live
UW: 25.0% down · 7.5% · 30yr · 1.5% tax · 5.0% vac · 8.0% maint · 8.0% mgmt
Financing live
Cash to close
- Down payment
- $47,250
- Closing costs
- $5,670
- Reserves months
- —
- Total cash needed
- —
Loan-product check · same deal, 3 products live
Conventional
25% down · 7.5% · 30yr
- Down + closing
- —
- Monthly P&I
- —
- Monthly cashflow
- —
- DSCR
- —
- Eligible?
- —
Personal DTI + credit; lowest rate.
DSCR
20% down · 8.5% · 30yr
- Down + closing
- —
- Monthly P&I
- —
- Monthly cashflow
- —
- DSCR
- —
- Eligible?
- —
No personal income docs; deal must DSCR.
Hard money
10% down · 12.0% · 12mo
- Down + closing
- —
- Monthly P&I
- —
- Monthly cashflow
- —
- DSCR
- —
- Eligible?
- —
Short-term bridge; refi at stabilization.
Listing history 23 events
-
2026-06-18days on market $189,000 Active 163 DOM
-
2026-06-17days on market $189,000 Active 162 DOM
-
2026-06-16days on market $189,000 Active 161 DOM
-
2026-06-15days on market $189,000 Active 160 DOM
-
2026-06-13days on market $189,000 Active 158 DOM
-
2026-06-12days on market $189,000 Active 157 DOM
-
2026-06-09days on market $189,000 Active 154 DOM
-
2026-06-08days on market $189,000 Active 153 DOM
-
2026-06-07days on market $189,000 Active 152 DOM
-
2026-06-07days on market $189,000 Active 151 DOM
-
2026-06-04days on market $189,000 Active 148 DOM
-
2026-06-02days on market $189,000 Active 147 DOM
-
2026-06-01days on market $189,000 Active 146 DOM
-
2026-05-31days on market $189,000 Active 145 DOM
-
2026-01-06$199,000 Active 1289-char remark
Show marketing remark (1289 chars)
Here's your chance to purchase a Country cottage with access to a beautiful 200+ acre natural lake for motor boating, fishing and swimming. Just imagine swimming to your hearts content and waterskiing in the summer, ice skating or ice fishing in the winter months! This charming cabin has an open floor plan perfect for a 3 season get-a-way. 100 amp electric, good septic and drilled well along with front and back decks. Full attic is easily accessible with pull down stairs could easily make additional living space. Attic has a gas furnace waiting be installed (you'll need to get the proper permits) to make this a year round, 4 season home. With some updates and renovations this cozy cabin can be your lakefront dream cottage! The bones are good, built in 1962 and built to last! Join the Mohican lake tax payers association to use the area boat launch and access Mohican Lake. Within 30 minutes to all area amenities including the Forestburgh playhouse, Bethel Woods for music venues, Resort World Catskills for gambling, the Delaware river, Port Jervis commuter trains, Barryville farmers market Mast Hope Mountain for snow skiing and so much more! Added bonus Within 2 hours to NYC. Lake Views and lake access close by makes this spot the perfect choice to enjoy lake living!
-
2025-12-19historical
-
2024-12-16price $199,990
-
2024-07-28price $180,000
-
2024-06-18$195,000 Active
-
2024-02-16historical
-
2023-12-07price $174,900
-
2023-10-18$185,900 Active
-
1997-07-23soldstatus $28,000
ⓘ Source: listings_history table (triggers on properties + properties_extension) + one-shot
backfill from property_details.listing_events for pre-trigger history.
Tax reassessment forecast NY · Partial reset (capped growth)
- Current annual tax
- $3,730 · $311/mo
- Projected year-2 tax
- $3,730 · $311/mo
- Expected delta
- $0/yr ($0/mo · 0.0%)
ⓘ Screening estimate from a state-policy table — verify with the county assessor before closing.
Climate risk First Street
- Flood 1/10 Low FEMA zone X (unshaded) · 0% chance over 30 yrs
- Wildfire 3/10 Moderate
- Heat 2/10 Low 7 d/yr ≥92°F today · 15 d/yr by 30 yrs out
- Wind 3/10 Moderate 6% chance of damaging wind over 30 yrs
- Air quality 2/10 Low 1 unhealthy d/yr today · 1 by 30 yrs out
Nearby sold comps map
Loading sold comps map…
Walkable amenities ~0.75 mi
Loading nearby amenities…
Taxation est. · year 1
- Rental income
- $18,837
- − Mortgage interest
- −$10,587
- − Property taxes
- −$3,730
- − Insurance
- −$945
- − Repairs & maintenance
- −$1,507
- − Management
- −$1,507
- − Depreciation
- −$5,498
- Taxable loss
- −$4,938
- Est. tax savings @ 24.0%
- +$1,185
- After-tax cash flow
- $-503/yr
For passive investors: Depreciation is non-cash, so a rental often shows a tax loss while cash-flowing — sheltering income. Rental losses are passive: they offset passive income freely, and up to $25,000/yr can offset ordinary (W-2) income if you actively participate and your MAGI is under $100k (phasing out to $0 by $150k); unused losses carry forward. On sale, claimed depreciation is recaptured at up to 25%, and gains may owe capital-gains tax (a 1031 exchange can defer both). Figures are a year-1 estimate at your 24.0% rate — not tax advice; consult a CPA.
Schools (NCES district)
- District
- Eldred Central School District
- NCES district ID
- 3610410
- Math proficiency
- 33% ▼ -15.00%
- Reading proficiency
- 50% ▲ 11.00%
- Median HH income
- $52,775
- Composite
- 35.94/100
- National rank
- #4800
- State rank
- #495 of 590 in NY
Livability — Eldred
No livability data for this city. (Only ~50 U.S. cities are tracked.)
Census & demographics
- Population (ZIP)
- 1,817
Population outlook (Sullivan County) Hauer SSP2
- Today (2025)
- 68,974 people
- By 2030
- 65,609 · -4.9%
- By 2040
- 58,878 · -14.6%
- By 2050
- 52,500 · -23.9%
- By 2075
- 39,941 · -42.1%
- By 2100
- 28,880 · -58.1%
Race, ethnicity, and origin ACS 2023
- Neighborhood character
- Predominantly White (82%)
- Race & ethnicity
- White 82% Hispanic / Latino 13% Two or more races 12%
- Hispanic origin (detail)
- Puerto Rican 9% Cuban 1%
- Common ancestry
- Romanian 7% Slovak 5% Lithuanian 4%
- Foreign-born
- 5% · South Korea
- Languages at home
- 92% English-only · Russian/Polish/Slavic 3% Other Indo-European 3% Spanish 2%
Political lean MEDSL · Sullivan
- 2024 margin
- R (+16.7) · D 41.6% · R 58.4%
- 2008→2024 swing
- -26.2pp toward R · 2008: 9.5pp · 2024: -16.7pp
- All cycles
- 2024: R+16.7 2020: R+9.2 2016: R+13.7 2012: D+10.4 2008: D+9.5
Not yet ingested
- Civics
- —
Market trends
- HPI YoY
- ▲ 132.02%
- Current HPI
- 443.8248
- Rent YoY
- —
- Metro
- —
- State GDP YoY
- ▲ 2.60%
- F500 in state
- 92
Industry mix (Fortune 500 HQ in NY)
| Industry | F500 HQs | Revenue |
|---|---|---|
| Financial Services | 10 | $950B |
|
||
| Consumer Goods | 9 | $162B |
|
||
| Insurance | 4 | $225B |
|
||
| Telecommunications | 2 | $144B |
|
||
| Pharmaceuticals | 2 | $112B |
|
||
| Media / Entertainment | 2 | $69B |
|
||
Price history
+610.7% since first listed9 events — show timeline
- 2026-01-06 Listed $199,000 OneKey® MLS as Distributed by MLS Grid
- 2025-12-19 Listing Removed — OneKey® MLS as Distributed by MLS Grid
- 2024-12-16 Price Changed $199,990 OneKey® MLS as Distributed by MLS Grid
- 2024-07-28 Price Changed $180,000 OneKey® MLS as Distributed by MLS Grid
- 2024-06-18 Listed $195,000 OneKey® MLS as Distributed by MLS Grid
- 2024-02-16 Listing Removed — OneKey® MLS as Distributed by MLS Grid
- 2023-12-07 Price Changed $174,900 OneKey® MLS as Distributed by MLS Grid
- 2023-10-18 Listed $185,900 OneKey® MLS as Distributed by MLS Grid
- 1997-07-23 Sold (Public Records) $28,000 Public Records
Property tax history
+0.7%/yrLatest (2025): $3,730 · +1.6% YoY. Source: county tax records.
Cash-flow waterfall
monthlySold comps — $/sqft
last 12 mo · ≤1 miLoading sold comps…