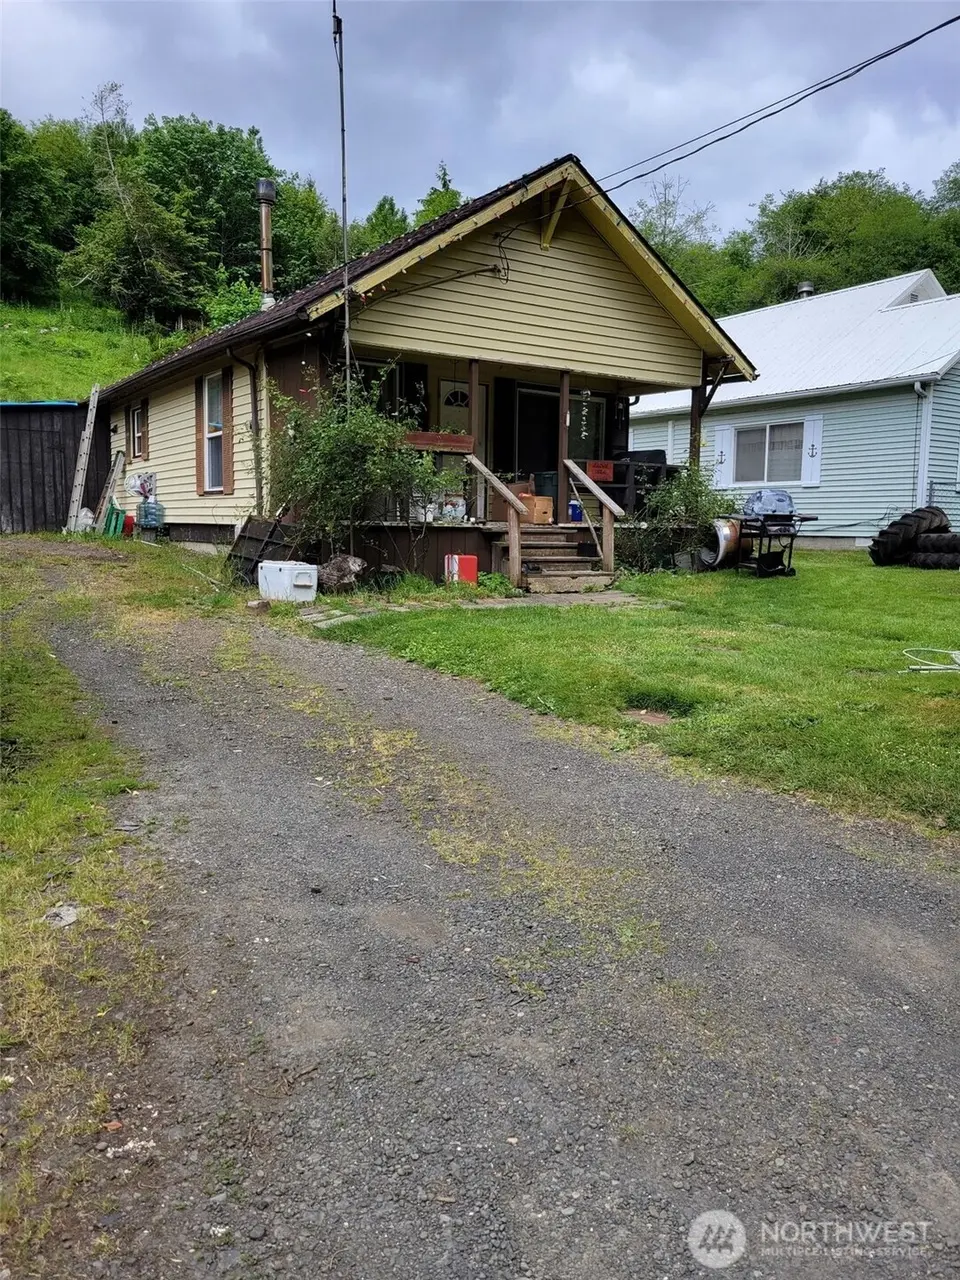
1534 Larch St · Raymond, WA
Flood risk 10/10 · Severe
- FEMA flood zone
- X (unshaded)
- Chance of flooding over 30 yrs
- 0.99%
- Est. flood insurance / yr
- $507 – $1,088
Fire risk 1/10 · Minimal
- Est. fire insurance / yr
- $604 – $1,122
Heat risk 1/10 · Minimal
- Hot days now (above 83°F)
- 7 days/yr
- Hot days in 30 yrs
- 14 days/yr
Wind risk 1/10 · Minimal
- Chance of severe wind over 30 yrs
- —
Air-quality risk 6/10 · Moderate
- Unhealthy air days now
- 6 days/yr
- Unhealthy air days in 30 yrs
- 7 days/yr
Risk factors via First Street. Map © Google.
Why this score? — see what drove the B+ grade
The composite is a weighted blend of 9 inputs, each scored 0–100. Each bar is that input's sub-score; the figure is the points it added to the 100-point composite (weight × sub-score).
- Cash flow +29.4/30.0
- ARV discount +15.0/15.0
- DSCR +10.0/10.0
- 1% rule +8.2/10.0
- Livability +3.6/5.0
- Schools +3.5/10.0
- Rent growth +2.5/5.0
- Condition / age +2.5/5.0
- Appreciation +1.1/10.0
$120,000
🖨 Deal sheet (PDF) 📄 Offer letter ✓ Due diligence
Listing remarks
Attention investors and contractors! Rare opportunity to acquire a high-potential 1930s fixer-upper in Raymond for just $120,000. 1-story home featuring 3 bedrooms, 1 full bathroom, utility room, and attached carport. Massive equity potential through full renovation. Large 0.25-acre lot provides plenty of space. City sewer, city water, and electric are connected. Property is occupied and sold strictly AS IS, CASH ONLY. No financing will be considered. Seller reviewing offers upon receipt—act fast!
Key facts
- Electric connected
- City water
- 1930s fixer-upper
Tags
Property features AI
Finance
- Other: Lot size approximately 0.25 acres
- Financial info: Listing terms: Cash
Exterior
- Parking: Attached carport (1 covered/carport space)
- Utilities: Electric energy source; Public water; City of Raymond water service; Sewer connected (City of Raymond); Power provided by PUD #2
- Home design: Single family residence; One-story; East-facing; Main level entry
- Construction: Wood construction; Composition roof; Pillar/post/pier foundation; Built on lot; Fixer condition; House structure
- Exterior features: Wood exterior; Wood products
Interior
- Kitchen: Dishwasher; Refrigerator; Stove/Range
- Bedrooms: 3 bedrooms (all on main level)
- Flooring: Ceramic tile; Vinyl; Carpet
- Bathrooms: 1 full bathroom; 2 bathtubs; 2 showers
- Heating & cooling: Stove/free-standing heating; Wall furnace; No cooling
- Interior features: Dishwasher; Refrigerator; Stove/Range; Washer
- Laundry & utility: Washer included
Neighborhood map
What this means for you Summary
Snapshot
- This is a 3-bed/1.0-bath single-family listed at $120k.
Deal economics
- At list price, monthly cash flow is $360 ($4k/yr) — positive.
- The deal already cash-flows at list — no discount required.
- Meets the 1% rule at list price ($2k rent vs $120k).
- Recommended offer: $118k (1.5% below list) — sets the bar for market timing.
- Cap rate 10.6% vs local median 4.0% in Raymond — top-decile yield for the area; either an underpriced asset or a hidden risk that comps aren't pricing in. Stress-test before assuming the spread holds.
Location & tenants
- Location reads 72/100 on livability (#212 in WA) — a middle-class / working-renter tenant base. Strengths: crime A+, cost of living A+, housing A+; Watch: commute F.
- Raymond School District (rural): math 30% / reading 48% proficiency, ranked #231 of 291 in WA (top 79%) — families likely to look elsewhere, expect single-tenant / working-renter base with shorter leases.
- Zoned schools: Raymond Elementary School (224 students, 75% FRL); Raymond Jr Sr High School (259 students, 72% FRL) — zoned schools average 74% FRL vs 52% district-wide (21 pts higher); higher-poverty schools than district average — tighter screening recommended.
- Market conditions: 92 active listings in the ZIP; 90 units permitted in Pacific County in 2024 (0 in 5+ unit buildings).
Forward outlook
- Local home prices are declining (-3.0%/yr); year-one equity from $830 of loan paydown is wiped out by about $4k of value loss. Plan a longer hold.
- Pacific County population projected at -10% by 2050 — secular population decline; favor cash flow + early exit over multi-decade hold.
- At projected returns (-3.0% appreciation + 3.0% rent growth), your $34k cash investment doubles in ~9 years — after that, you're playing with house money.
Negotiation context
- It's been on market 21 days — a 2% lower offer ($118k) is reasonable based on typical stale-listing flexibility.
Risks & watch-outs
- Watch-outs: flood insurance adds $66/mo; built in 1930 — expect roof / HVAC / electrical / plumbing capex.
- Climate carrying-cost: severe flood risk — expect insurance premiums to compound above CPI over the hold.
Questions for the listing agent
- Built in 1930 — when were the roof, HVAC, electrical panel, plumbing, and water heater last replaced?
- What's the actual annual flood-insurance premium (NFIP or private), and is the property in a SFHA with mandatory coverage?
- Is there a deadline driving the sale (1031 exchange, divorce, estate, relocation)? That informs how much negotiation room exists.
- Schools are D-rated, which usually means shorter tenancies and higher turnover. Who's the typical renter profile here, and what's been the actual vacancy rate?
- What's the average days-on-market for RENTAL listings here right now (not sales)? A rising rental-DOM trend means longer vacancies and softer asking-rent achievability than the comps imply.
- What's the recent tenant-quality profile in this submarket — average credit score on applications, eviction rate, late-payment / NSF rate, and stable-employment percentage? A property-management company in the area should have these aggregated.
- How much new for-sale + rental construction is in the pipeline within 1–3 miles? Heavy new supply typically softens prices + rents 12–24 months out; constrained supply supports both.
Investment metrics
- 1% rule
- 1.32% ✓
- Cap rate
- 10.56%
- Cash-on-cash
- 15.24%
- DSCR
- 1.68
- GRM
- 6.3
CMA / ARV
- ARV (on-the-fly)
- $157,696
- Comps found
- 1
Show comp detail 1 sale within ~0.75 mi
| Address | Dist | Beds/Ba | Sqft | Sold | Price | $/sf | Match |
|---|---|---|---|---|---|---|---|
| 1204 Howard St | 0.44mi | 2/1.0 (-1) | 1,092 (+7%) | 3mo | $168,000 | $154 | 60 |
Match score weights: distance 35% · size 25% · config 20% · recency 20%. Top-matched comps best support the ARV.
Projected returns pro-forma
-3.0% appreciation · 3.0% rent growth · sell at horizon
- IRR
- 2.8%
- Equity multiple
- 1.11×
- Total profit
- $3,561
- Equity at exit
- $17,892
- IRR
- 12.4%
- Equity multiple
- 1.98×
- Total profit
- $32,905
- Equity at exit
- $10,375
Cash invested: $33,600 (down + closing). Projections, not guarantees.
Landlord ↔ Tenant lean methodology
- Overall (STATE)
- 28 Tenant-Leaning
- State Washington
- 28 Tenant-Leaning · D+8
- County
- — inherits STATE
- City
- — inherits STATE
ZIP-level market 98577
- Home prices YoY
- -2.8%
- Active inventory
- 92
- Price-to-rent
- 6.3×
Monthly cashflow live
- Estimated rent
- $1,590 medium interval (Pro) →
- Mortgage (P&I)
- −$629
- Tax est. 1.5%
- −$150 /mo · $1,800/yr
- Insurance
- −$50
- Flood insurance flood zone
- −$66 /mo · $798/yr
- HOA
- −$0
- Vacancy / Maint / Mgmt
- −$334
- Net cashflow
- $360
Break-even live
Sensitivity live
| Price | -10% $443 | -5% $402 | +0% $360 | +5% $319 | +10% $277 |
|---|---|---|---|---|---|
| Rent | -10% $235 | -5% $297 | +0% $360 | +5% $423 | +10% $486 |
| Rate | -1.0pp $421 | -0.5pp $391 | base $360 | +0.5pp $329 | +1.0pp $297 |
UW: 25.0% down · 7.5% · 30yr · 1.5% tax · 5.0% vac · 8.0% maint · 8.0% mgmt
Financing live
Cash to close
- Down payment
- $30,000
- Closing costs
- $3,600
- Reserves months
- —
- Total cash needed
- —
Loan-product check · same deal, 3 products live
Conventional
25% down · 7.5% · 30yr
- Down + closing
- —
- Monthly P&I
- —
- Monthly cashflow
- —
- DSCR
- —
- Eligible?
- —
Personal DTI + credit; lowest rate.
DSCR
20% down · 8.5% · 30yr
- Down + closing
- —
- Monthly P&I
- —
- Monthly cashflow
- —
- DSCR
- —
- Eligible?
- —
No personal income docs; deal must DSCR.
Hard money
10% down · 12.0% · 12mo
- Down + closing
- —
- Monthly P&I
- —
- Monthly cashflow
- —
- DSCR
- —
- Eligible?
- —
Short-term bridge; refi at stabilization.
Listing history 17 events
-
2026-06-22days on market $120,000 Active 21 DOM
-
2026-06-21days on market $120,000 Active 20 DOM
-
2026-06-21days on market $120,000 Active 19 DOM
-
2026-06-18days on market $120,000 Active 17 DOM
-
2026-06-17days on market $120,000 Active 16 DOM
-
2026-06-16days on market $120,000 Active 15 DOM
-
2026-06-15days on market $120,000 Active 14 DOM
-
2026-06-15days on market $120,000 Active 13 DOM
-
2026-06-13days on market $120,000 Active 12 DOM
-
2026-06-12days on market $120,000 Active 11 DOM
-
2026-06-09days on market $120,000 Active 8 DOM
-
2026-06-08days on market $120,000 Active 7 DOM
-
2026-06-08days on market $120,000 Active 6 DOM
-
2026-06-05days on market $120,000 Active 4 DOM
-
2026-06-03days on market $120,000 Active 2 DOM
-
2026-06-02remarks 502-char remark
-
2026-06-02$120,000 Active 1 DOM
ⓘ Source: listings_history table (triggers on properties + properties_extension) + one-shot
backfill from property_details.listing_events for pre-trigger history.
Climate risk First Street
- Flood 10/10 Extreme FEMA zone X (unshaded) · 99% chance over 30 yrs
- Wildfire 1/10 Low
- Heat 1/10 Low 7 d/yr ≥83°F today · 14 d/yr by 30 yrs out
- Wind 1/10 Low
- Air quality 6/10 Major 6 unhealthy d/yr today · 7 by 30 yrs out
Nearby sold comps map
Loading sold comps map…
Walkable amenities ~0.75 mi
Loading nearby amenities…
Taxation est. · year 1
- Rental income
- $19,078
- − Mortgage interest
- −$6,722
- − Property taxes
- −$1,800
- − Insurance
- −$1,398
- − Repairs & maintenance
- −$1,526
- − Management
- −$1,526
- − Depreciation
- −$3,491
- Taxable income
- $2,615
- Est. tax owed @ 24.0%
- −$628
- After-tax cash flow
- $3,695/yr
For passive investors: Depreciation is non-cash, so a rental often shows a tax loss while cash-flowing — sheltering income. Rental losses are passive: they offset passive income freely, and up to $25,000/yr can offset ordinary (W-2) income if you actively participate and your MAGI is under $100k (phasing out to $0 by $150k); unused losses carry forward. On sale, claimed depreciation is recaptured at up to 25%, and gains may owe capital-gains tax (a 1031 exchange can defer both). Figures are a year-1 estimate at your 24.0% rate — not tax advice; consult a CPA.
Schools (NCES district)
- District
- Raymond School District
- NCES district ID
- 5307140
- Math proficiency
- 30% ▲ 5.00%
- Reading proficiency
- 48% ▲ 2.00%
- Median HH income
- $38,441
- Composite
- 34.99/100
- National rank
- #9951
- State rank
- #231 of 291 in WA
Livability — Raymond
- Score
- 72/100
- State rank
- #212
- US rank
- #6045
Category grades
Schools grade is shown separately in the Schools card above.
Census & demographics
- Census place
- Raymond, WA
- Population (ZIP)
- 7,458
Population outlook (Pacific County) Hauer SSP2
- Today (2025)
- 20,636 people
- By 2030
- 20,137 · -2.4%
- By 2040
- 19,041 · -7.7%
- By 2050
- 18,504 · -10.3%
- By 2075
- 17,403 · -15.7%
- By 2100
- 16,241 · -21.3%
Race, ethnicity, and origin ACS 2023
- Neighborhood character
- Predominantly White (78%)
- Race & ethnicity
- White 78% Hispanic / Latino 11% Two or more races 7% Native American 2% Asian 1%
- Hispanic origin (detail)
- Mexican 11%
- Common ancestry
- Portuguese 5% Scotch-Irish 3% Romanian 3%
- Foreign-born
- 7% · Canada, South Korea
- Languages at home
- 89% English-only · Spanish 8% German/W. Germanic 2%
Political lean MEDSL · Pacific
- 2024 margin
- Toss-up / Even · D 48.1% · R 49.4% · Other 2.4%
- 2008→2024 swing
- -15.4pp toward R · 2008: 14.1pp · 2024: -1.3pp
- All cycles
- 2024: R+1.3 2020: R+1.1 2016: R+6.9 2012: D+11.4 2008: D+14.1
Not yet ingested
- Civics
- —
Market trends
- HPI YoY
- ▼ -7.88%
- Current HPI
- 271.0583
- Rent YoY
- —
- Metro
- —
- State GDP YoY
- ▲ 4.65%
- F500 in state
- 22
Industry mix (Fortune 500 HQ in WA)
| Industry | F500 HQs | Revenue |
|---|---|---|
| Retail | 2 | $269B |
|
||
| Technology / Retail | 1 | $638B |
|
||
| Technology | 1 | $245B |
|
||
| Telecommunications | 1 | $38B |
|
||
| Food / Beverage | 1 | $36B |
|
||
| Automotive / Trucks | 1 | $34B |
|
||
Price history
1 event — show timeline
- 2026-06-01 Listed $120,000 NWMLS as Distributed by MLS Grid
Cash-flow waterfall
monthlySold comps — $/sqft
last 12 mo · ≤1 miLoading sold comps…