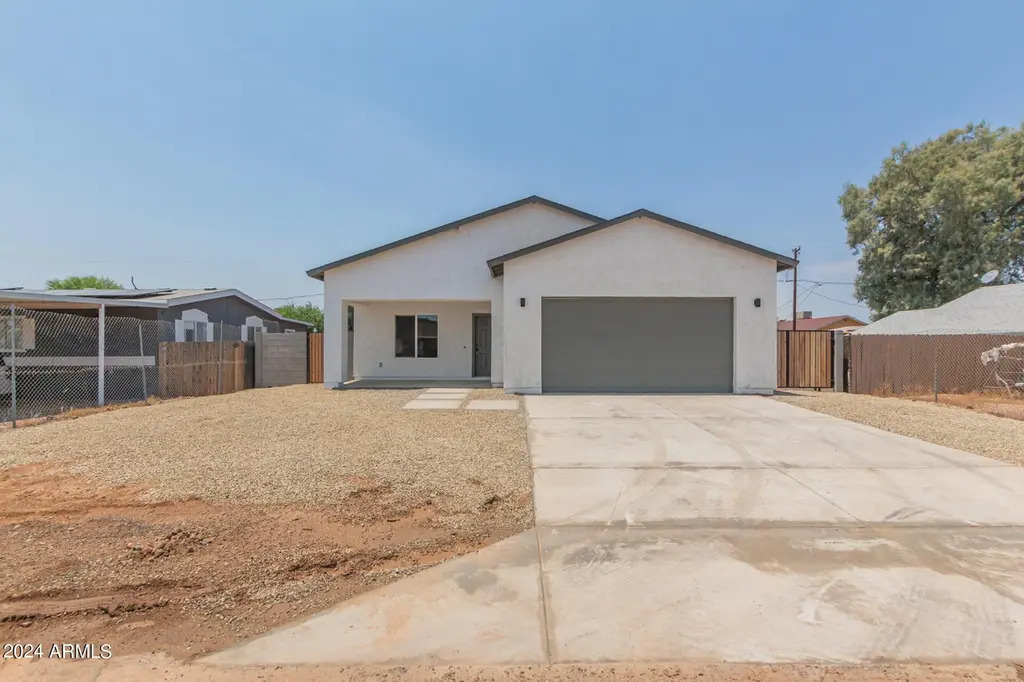
31824 N Poplar St · Wittmann, AZ
Flood risk 1/10 · Minimal
- FEMA flood zone
- X (shaded)
- Chance of flooding over 30 yrs
- 0.0%
- Est. flood insurance / yr
- $507 – $1,088
Fire risk 7/10 · Major
- Est. fire insurance / yr
- $610 – $1,132
Heat risk 8/10 · Major
- Hot days now (above 112°F)
- 6 days/yr
- Hot days in 30 yrs
- 15 days/yr
Wind risk 1/10 · Minimal
- Chance of severe wind over 30 yrs
- —
Air-quality risk 2/10 · Minimal
- Unhealthy air days now
- 0 days/yr
- Unhealthy air days in 30 yrs
- 1 days/yr
Risk factors via First Street. Map © Google.
Why this score? — see what drove the D- grade
The composite is a weighted blend of 9 inputs, each scored 0–100. Each bar is that input's sub-score; the figure is the points it added to the 100-point composite (weight × sub-score).
- Appreciation +10.0/10.0
- ARV discount +7.9/15.0
- Cash flow +6.5/30.0
- Schools +3.0/10.0
- Rent growth +2.5/5.0
- Livability +2.5/5.0
- Condition / age +2.5/5.0
- 1% rule +1.6/10.0
- DSCR +0.8/10.0
$340,000
🖨 Deal sheet (PDF) 📄 Offer letter ✓ Due diligence
Listing remarks MLS
Listing agent and member of LLC are related.
Key facts
- 6,448 sq ft lot
- 2 garage spots
- Built 2024
Neighborhood map
What this means for you Summary
Snapshot
- This is a 3-bed/2.0-bath single-family listed at $340k.
Deal economics
- At list price, monthly cash flow is $-572 ($-7k/yr) — negative.
- To cash-flow at today's rent, offer at most $257k (24.4% below list).
- To meet the 1% rule (rent ≥ 1% of price), the offer needs to be $225k (33.8% below list).
- Recommended offer: $225k (33.8% below list) — sets the bar for 1% rule.
- Cap rate 4.3% vs local median 3.5% in Wittmann — meaningfully above typical; check what's discounted (condition, days-on-market, listing class) to confirm the premium yield is real.
Location & tenants
- Location reads 50/100 on livability (#326 in AZ) — a working-class tenant base; expect higher turnover. Strengths: health & safety A+; Watch: employment C-, housing C-, amenities F.
- Nadaburg Unified School District (4252) (rural): math 30% / reading 37% proficiency, ranked #90 of 249 in AZ (top 36%) — families likely to look elsewhere, expect single-tenant / working-renter base with shorter leases.
- Zoned schools: Nadaburg Elementary School (math 24% / reading 32%, grade F, #586 of 1,109 statewide, top 53%, 414 students, 57% FRL).
- Market conditions: 372 active listings in the ZIP; 1 comparable units currently listed for rent nearby; 36,011 units permitted in Maricopa County in 2024 (12,801 in 5+ unit buildings).
Forward outlook
- In year one you build about $36k of equity ($2k loan paydown + $34k appreciation (10.0% local appreciation)).
- Maricopa County population projected at +38% by 2050 — long-run rental-demand tailwind backs the buy-and-hold thesis.
- By year 2, paydown + projected appreciation supports a ~$58k cash-out refi (75% LTV) — recoverable capital for the next deal without selling this one.
Negotiation context
- It's been on market 77 days — a 6% lower offer ($320k) is reasonable based on typical stale-listing flexibility.
- 3 sale attempts since 2y ago with the ask held roughly flat each time — persistent listings suggest the price (not the market) is what's stuck; bring a comps-based counter.
- Current owner paid $10k; list at $340k implies a 3300% gain — meaningful room to come down on a strong offer.
Risks & watch-outs
- Climate carrying-cost: major wildfire risk; extreme-heat days projected 6→15/yr by 2055 (HVAC capex compounding) — expect insurance premiums to compound above CPI over the hold.
Questions for the listing agent
- What do current leases actually rent for vs. the listed asking? Can we see a recent rent roll and the last 12 months of T-12 income?
- It's been on market 77 days. Have you received any prior offers? Is the seller open to a 34% concession, seller financing, or rate buy-down credit?
- Why hasn't it sold? Are there any deal-killer items the seller is aware of (foundation, flood, title, zoning, code violations)?
- Is there a deadline driving the sale (1031 exchange, divorce, estate, relocation)? That informs how much negotiation room exists.
- The area grade is low — what's the realistic commute time and amenity access for the typical tenant pool here? Any planned neighborhood developments (good or bad) we should know about?
- What's the average days-on-market for RENTAL listings here right now (not sales)? A rising rental-DOM trend means longer vacancies and softer asking-rent achievability than the comps imply.
- What's the recent tenant-quality profile in this submarket — average credit score on applications, eviction rate, late-payment / NSF rate, and stable-employment percentage? A property-management company in the area should have these aggregated.
- How much new for-sale + rental construction is in the pipeline within 1–3 miles? Heavy new supply typically softens prices + rents 12–24 months out; constrained supply supports both.
Investment metrics
- 1% rule
- 0.66% ✗
- Cap rate
- 4.27%
- Cash-on-cash
- -7.21%
- DSCR
- 0.68
- GRM
- 12.6
CMA / ARV
- ARV (median comp)
- $343,282
- List price
- $340,000
- Delta
- -0.96%
- Verdict
- FAIR
- Comps
- 20 within 1.0 mi
Show comp detail 12 sales within ~0.75 mi
| Address | Dist | Beds/Ba | Sqft | Sold | Price | $/sf | Match |
|---|---|---|---|---|---|---|---|
| 31824 N Poplar St | 0.00mi | 3/2.0 | 1,498 (0%) | 1mo | $340,000 | $227 | 99 |
| 32018 N Ash St | 0.15mi | 3/2.0 | 1,469 (-2%) | 2mo | $360,000 | $245 | 88 |
| 32007 N Bush St | 0.15mi | 3/2.0 | 1,434 (-4%) | 4mo | $340,000 | $237 | 82 |
| 21721 W Laura St | 0.10mi | 3/2.0 | 1,404 (-6%) | 3mo | $355,000 | $253 | 82 |
| 32210 S Center St | 0.35mi | 3/2.0 | 1,496 (-0%) | 6mo | $360,000 | $241 | 79 |
| 32102 N Walnut St | 0.17mi | 3/2.0 | 1,348 (-10%) | 3mo | $340,000 | $252 | 73 |
| 21333 W Sleepy Ranch Rd | 0.45mi | 3/2.0 | 1,436 (-4%) | 1mo | $399,000 | $278 | 72 |
| 22125 W Laura St | 0.58mi | 3/2.0 | 1,512 (+1%) | 6mo | $390,000 | $258 | 66 |
| 21309 W Sleepy Ranch Rd | 0.49mi | 3/2.0 | 1,436 (-4%) | 5mo | $399,900 | $278 | 66 |
| 21605 W Laura St | 0.08mi | 4/2.0 (+1) | 1,700 (+14%) | 5mo | $360,000 | $212 | 65 |
| 32230 N Center St | 0.35mi | 3/2.0 | 1,358 (-9%) | 4mo | $357,900 | $264 | 65 |
| 21770 W Harding Ave | 0.50mi | 3/2.0 | 1,348 (-10%) | 4mo | $252,001 | $187 | 57 |
Match score weights: distance 35% · size 25% · config 20% · recency 20%. Top-matched comps best support the ARV.
Projected returns pro-forma
10.0% appreciation · 3.0% rent growth · sell at horizon
- IRR
- 19.2%
- Equity multiple
- 2.56×
- Total profit
- $148,766
- Equity at exit
- $306,299
- IRR
- 17.7%
- Equity multiple
- 5.90×
- Total profit
- $466,815
- Equity at exit
- $660,545
Cash invested: $95,200 (down + closing). Projections, not guarantees.
Landlord ↔ Tenant lean methodology
- Overall (STATE)
- 87 Strongly Landlord-Friendly
- State Arizona
- 87 Strongly Landlord-Friendly · R+3
- County
- — inherits STATE
- City
- — inherits STATE
ZIP-level market 85361
- Home prices YoY
- 19.4%
- Active inventory
- 372
- Price-to-rent
- 12.6×
Monthly cashflow live
- Estimated rent
- $2,250 medium interval (Pro) →
- Mortgage (P&I)
- −$1,783
- Tax est. 1.5%
- −$425 /mo · $5,100/yr
- Insurance
- −$142
- HOA
- −$0
- Vacancy / Maint / Mgmt
- −$472
- Net cashflow
- $-572
Break-even live
Sensitivity live
| Price | -10% $-337 | -5% $-455 | +0% $-572 | +5% $-690 | +10% $-807 |
|---|---|---|---|---|---|
| Rent | -10% $-750 | -5% $-661 | +0% $-572 | +5% $-483 | +10% $-394 |
| Rate | -1.0pp $-401 | -0.5pp $-486 | base $-572 | +0.5pp $-660 | +1.0pp $-750 |
UW: 25.0% down · 7.5% · 30yr · 1.5% tax · 5.0% vac · 8.0% maint · 8.0% mgmt
Financing live
Cash to close
- Down payment
- $85,000
- Closing costs
- $10,200
- Reserves months
- —
- Total cash needed
- —
Loan-product check · same deal, 3 products live
Conventional
25% down · 7.5% · 30yr
- Down + closing
- —
- Monthly P&I
- —
- Monthly cashflow
- —
- DSCR
- —
- Eligible?
- —
Personal DTI + credit; lowest rate.
DSCR
20% down · 8.5% · 30yr
- Down + closing
- —
- Monthly P&I
- —
- Monthly cashflow
- —
- DSCR
- —
- Eligible?
- —
No personal income docs; deal must DSCR.
Hard money
10% down · 12.0% · 12mo
- Down + closing
- —
- Monthly P&I
- —
- Monthly cashflow
- —
- DSCR
- —
- Eligible?
- —
Short-term bridge; refi at stabilization.
Rent comps 1 comps
| Address | Beds | Baths | Sqft | Rent | $/sqft | DOM | Units | Dist |
|---|---|---|---|---|---|---|---|---|
| 21533 W Laura St Wittmann, AZ | 3.0 | 2.0 | 1568 | $2,250 | $1.43 | 0d | 1 | 0.10mi |
Listing history 10 events
-
2026-05-04status Pending 44-char remark
Show marketing remark (44 chars)
Listing agent and member of LLC are related.
-
2026-04-07price $340,000 44-char remark
Show marketing remark (44 chars)
Listing agent and member of LLC are related.
-
2026-03-27price $344,000 44-char remark
Show marketing remark (44 chars)
Listing agent and member of LLC are related.
-
2026-02-16$345,000 Active 44-char remark
Show marketing remark (44 chars)
Listing agent and member of LLC are related.
-
2024-08-06status Active
-
2024-07-31status Pending
-
2024-07-31historical
-
2024-07-12$355,000 Active
-
2005-02-22soldstatus $10,000
-
2003-05-09soldstatus $6,500
ⓘ Source: listings_history table (triggers on properties + properties_extension) + one-shot
backfill from property_details.listing_events for pre-trigger history.
Climate risk First Street
- Flood 1/10 Low FEMA zone X (shaded) · 0% chance over 30 yrs
- Wildfire 7/10 Severe
- Heat 8/10 Severe 6 d/yr ≥112°F today · 15 d/yr by 30 yrs out
- Wind 1/10 Low
- Air quality 2/10 Low 0 unhealthy d/yr today · 1 by 30 yrs out
Nearby sold comps map
Loading sold comps map…
Walkable amenities ~0.75 mi
Loading nearby amenities…
Taxation est. · year 1
- Rental income
- $27,000
- − Mortgage interest
- −$19,045
- − Property taxes
- −$5,100
- − Insurance
- −$1,700
- − Repairs & maintenance
- −$2,160
- − Management
- −$2,160
- − Depreciation
- −$9,891
- Taxable loss
- −$13,056
- Est. tax savings @ 24.0%
- +$3,133
- After-tax cash flow
- $-3,732/yr
For passive investors: Depreciation is non-cash, so a rental often shows a tax loss while cash-flowing — sheltering income. Rental losses are passive: they offset passive income freely, and up to $25,000/yr can offset ordinary (W-2) income if you actively participate and your MAGI is under $100k (phasing out to $0 by $150k); unused losses carry forward. On sale, claimed depreciation is recaptured at up to 25%, and gains may owe capital-gains tax (a 1031 exchange can defer both). Figures are a year-1 estimate at your 24.0% rate — not tax advice; consult a CPA.
Schools (NCES district)
- District
- Nadaburg Unified School District (4252)
- NCES district ID
- 0405460
- Math proficiency
- 30% ▼ -4.00%
- Reading proficiency
- 37% ▼ -1.00%
- Median HH income
- $56,864
- Composite
- 29.74/100
- National rank
- #6443
- State rank
- #90 of 249 in AZ
Livability — Wittmann
- Score
- 50/100
- State rank
- #326
- US rank
- #25597
Category grades
Schools grade is shown separately in the Schools card above.
Census & demographics
- Census place
- Wittmann, AZ
- Population (ZIP)
- 8,107
Population outlook (Maricopa County) Hauer SSP2
- Today (2025)
- 4,979,203 people
- By 2030
- 5,378,229 · +8.0%
- By 2040
- 6,156,598 · +23.6%
- By 2050
- 6,872,376 · +38.0%
- By 2075
- 8,401,270 · +68.7%
- By 2100
- 9,247,439 · +85.7%
Race, ethnicity, and origin ACS 2023
- Neighborhood character
- Majority White (59%)
- Race & ethnicity
- White 59% Hispanic / Latino 33% Two or more races 17% Native American 2% Black 1%
- Hispanic origin (detail)
- Mexican 25%
- Common ancestry
- Romanian 3% Iranian 1% Italian 1%
- Foreign-born
- 12% · Canada
- Languages at home
- 70% English-only · Spanish 27% German/W. Germanic 1% Other Asian/Pacific 1%
Political lean MEDSL · Maricopa
- 2024 margin
- Toss-up / Even · D 47.7% · R 51.2% · Other 1.1%
- 2008→2024 swing
- +7.1pp toward D · 2008: -10.6pp · 2024: -3.5pp
- All cycles
- 2024: R+3.5 2020: D+2.2 2016: R+3.5 2012: R+12.0 2008: R+10.6
Not yet ingested
- Civics
- —
Market trends
- HPI YoY
- ▲ 77.69%
- Current HPI
- 479.0154
- Rent YoY
- —
- Metro
- —
- State GDP YoY
- ▲ 4.54%
- F500 in state
- 20
Industry mix (Fortune 500 HQ in AZ)
| Industry | F500 HQs | Revenue |
|---|---|---|
| Technology | 2 | $13B |
|
||
| Mining / Metals | 1 | $23B |
|
||
| Environmental Services | 1 | $16B |
|
||
| Metals / Steel | 1 | $14B |
|
||
| Technology Distribution | 1 | $9B |
|
||
| Homebuilding | 1 | $8B |
|
||
Price history
+5130.8% since first listed10 events — show timeline
- 2026-05-04 Pending — ARMLS
- 2026-04-07 Price Changed $340,000 ARMLS
- 2026-03-27 Price Changed $344,000 ARMLS
- 2026-02-16 Listed $345,000 ARMLS
- 2024-08-06 Relisted — ARMLS
- 2024-07-31 Pending — ARMLS
- 2024-07-31 Listing Removed — ARMLS
- 2024-07-12 Listed $355,000 ARMLS
- 2005-02-22 Sold (Public Records) $10,000 Public Records
- 2003-05-09 Sold (Public Records) $6,500 Public Records
Property tax history
-3.7%/yrLatest (2025): $91 · -9.3% YoY. Source: county tax records.
Cash-flow waterfall
monthlySold comps — $/sqft
last 12 mo · ≤1 miLoading sold comps…