3577 Shipwatch Rd Unit Share B · Kiawah Island, SC
Flood risk 9/10 · Severe
- FEMA flood zone
- AE
- Chance of flooding over 30 yrs
- 0.99%
- Est. flood insurance / yr
- $1,737 – $8,500
Fire risk 1/10 · Minimal
- Est. fire insurance / yr
- $783 – $1,453
Heat risk 10/10 · Severe
- Hot days now (above 105°F)
- 8 days/yr
- Hot days in 30 yrs
- 23 days/yr
Wind risk 9/10 · Severe
- Chance of severe wind over 30 yrs
- 99.0%
Air-quality risk 2/10 · Minimal
- Unhealthy air days now
- 1 days/yr
- Unhealthy air days in 30 yrs
- 1 days/yr
Risk factors via First Street. Map © Google.
Why this score? — see what drove the B grade
The composite is a weighted blend of 9 inputs, each scored 0–100. Each bar is that input's sub-score; the figure is the points it added to the 100-point composite (weight × sub-score).
- Cash flow +30.0/30.0
- 1% rule +10.0/10.0
- DSCR +10.0/10.0
- ARV discount +7.5/15.0
- Schools +4.3/10.0
- Condition / age +4.0/5.0
- Rent growth +3.2/5.0
- Livability +3.2/5.0
- Appreciation +0.0/10.0
$109,000
🖨 Deal sheet 📄 Offer letter ✓ Due diligence
Listing remarks
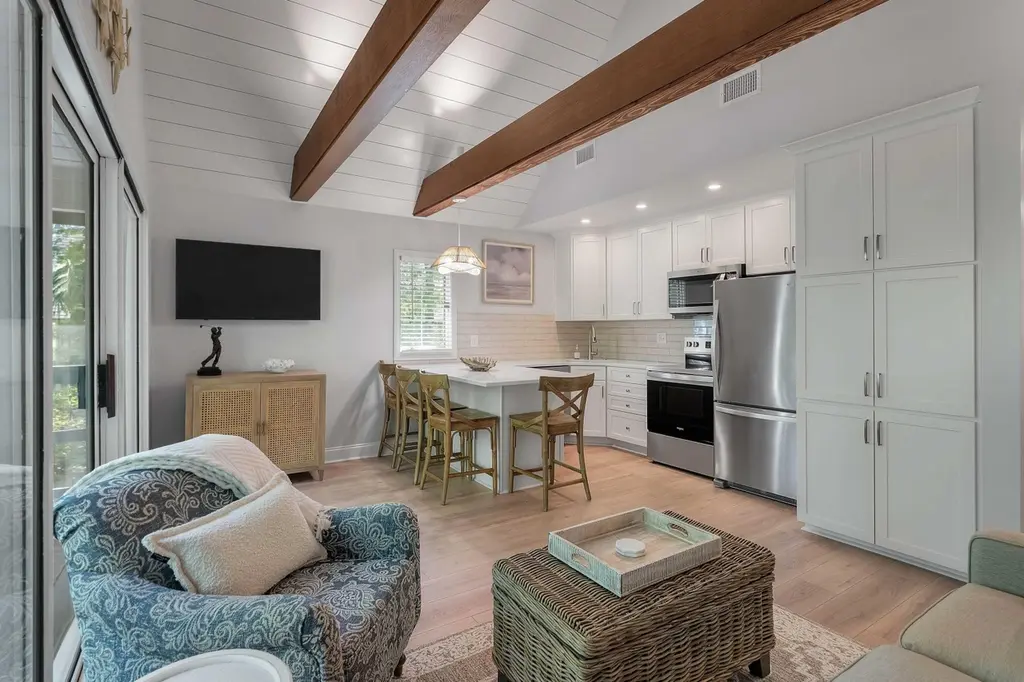
Exceptional opportunity to purchase a share in a 6-week-per-year, fractional ownership on the world-famous Kiawah Island! This tastefully renovated one-bedroom, one-bath villa is just steps from the world famous Kiawah beach and the Sandcastle Beach Club. The bright, open interior features vaulted ceilings, modern finishes throughout and a comfortable screened-in porch perfect for morning coffee or evening relaxation. This turnkey, move-in-ready vacation residence is ideal for owners seeking a low-maintenance beach getaway with resort-style amenities. Owners enjoy access to the Kiawah Island amenities including championship golf, pools, tennis, fitness center, nature/bike/walking trails, di
Key facts
- Community pool
- Built 1979
- Listed 62 days
Property features AI
Finance
- Other: Fractional ownership (villa in Seascape Villas)
- HOA & community: Club membership available; Golf course; Golf membership available; Marina; Pool; Tennis courts; Walk/jog trails
Exterior
- Security: Gated community; Security
- Utilities: Public sewer
- Home design: Residential fractional ownership; One story
- Construction: Wood roof
- Exterior features: Beach access; Wooded lot
Interior
- Kitchen: Built-in electric oven; Dishwasher; Disposal; Microwave; Refrigerator
- Bedrooms: 1 bedroom with ceiling fan
- Bathrooms: 1 bathroom
- Heating & cooling: Central heating; Central air conditioning
- Interior features: Cathedral/vaulted ceilings; High ceilings; Kitchen island; Walk-in closet(s)
- Laundry & utility: Washer; Dryer
Neighborhood map
What this means for you Summary
Snapshot
- This is a 1-bed/1.0-bath single-family listed at $109k. Condition is rated good.
Deal economics
- At list price, monthly cash flow is $152 ($2k/yr) — positive.
- The deal already cash-flows at list — no discount required.
- Meets the 1% rule at list price ($2k rent vs $109k).
- Recommended offer: $102k (6.0% below list) — sets the bar for market timing.
- Cap rate 12.7% vs local median 0.0% in Kiawah Island — top-decile yield for the area; either an underpriced asset or a hidden risk that comps aren't pricing in. Stress-test before assuming the spread holds.
Location & tenants
- Location reads 64/100 on livability (#154 in SC) — a middle-class / working-renter tenant base. Strengths: crime A+, employment A+; Watch: housing C-, amenities F, commute F.
- Charleston 01 (urban): math 48% / reading 53% proficiency, ranked #7 of 80 in SC (top 9%) — acceptable for families but not a draw, mixed tenant base, ~2y average lease.
- Zoned schools: Haut Gap Middle (math 39% / reading 44%, grade F, #68 of 229 statewide, top 31%, 444 students, 100% FRL); St. Johns High (math 42% / reading 72%, grade C, #120 of 196 statewide, top 64%, 387 students, 100% FRL) — zoned schools average 100% FRL vs 44% district-wide (56 pts higher); higher-poverty schools than district average — tighter screening recommended.
- Market conditions: Rents rising (+3.0%/yr); 568 active listings in the ZIP; 1 comparable units currently listed for rent nearby; high-income renter base; 4,156 units permitted in Charleston County in 2024 (857 in 5+ unit buildings).
- This rent is only 17% of the median local income ($121k/yr) — well below the 30% rent-burden line; pricing power to push rent on renewal without tenant pushback.
Forward outlook
- Local home prices are declining (-3.0%/yr); year-one equity from $754 of loan paydown is wiped out by about $3k of value loss. Plan a longer hold.
- Charleston County population projected at +44% by 2050 — long-run rental-demand tailwind backs the buy-and-hold thesis.
Negotiation context
- It's been on market 62 days — a 6% lower offer ($102k) is reasonable based on typical stale-listing flexibility.
Risks & watch-outs
- Watch-outs: flood insurance adds $427/mo.
- Climate carrying-cost: in FEMA flood zone AE (mandatory federal flood insurance); severe wind risk, 99% chance of damaging wind over 30y; extreme-heat days projected 8→23/yr by 2055 (HVAC capex compounding) — expect insurance premiums to compound above CPI over the hold.
Questions for the listing agent
- It's been on market 62 days. Have you received any prior offers? Is the seller open to a 6% concession, seller financing, or rate buy-down credit?
- Built in 1979 — when were the roof, HVAC, electrical panel, plumbing, and water heater last replaced?
- What's the actual annual flood-insurance premium (NFIP or private), and is the property in a SFHA with mandatory coverage?
- Why hasn't it sold? Are there any deal-killer items the seller is aware of (foundation, flood, title, zoning, code violations)?
- Is there a deadline driving the sale (1031 exchange, divorce, estate, relocation)? That informs how much negotiation room exists.
- What's the average days-on-market for RENTAL listings here right now (not sales)? A rising rental-DOM trend means longer vacancies and softer asking-rent achievability than the comps imply.
- What's the recent tenant-quality profile in this submarket — average credit score on applications, eviction rate, late-payment / NSF rate, and stable-employment percentage? A property-management company in the area should have these aggregated.
- How much new for-sale + rental construction is in the pipeline within 1–3 miles? Heavy new supply typically softens prices + rents 12–24 months out; constrained supply supports both.
Investment metrics
- 1% rule
- 1.55% ✓
- Cap rate
- 12.67%
- Cash-on-cash
- 22.76%
- DSCR
- 2.01
- GRM
- 5.4
CMA / ARV
No comps found within radius.
Projected returns pro-forma
-3.0% appreciation · 2.95% rent growth · sell at horizon
- IRR
- -6.8%
- Equity multiple
- 0.75×
- Total profit
- $-7,751
- Equity at exit
- $16,252
- IRR
- 3.0%
- Equity multiple
- 1.22×
- Total profit
- $6,573
- Equity at exit
- $9,424
Cash invested: $30,520 (down + closing). Projections, not guarantees.
Landlord ↔ Tenant lean methodology
- Overall (STATE)
- 90 Strongly Landlord-Friendly
- State South Carolina
- 90 Strongly Landlord-Friendly · R+6
- County
- — inherits STATE
- City
- — inherits STATE
ZIP-level market 29455
- Rents YoY
- 3.0%
- Active inventory
- 568
- Price-to-rent
- 5.4×
Monthly cashflow live
- Estimated rent
- $1,686 medium interval (Pro) →
- Mortgage (P&I)
- −$572
- Tax est. 1.5%
- −$136 /mo · $1,635/yr
- Insurance
- −$45
- Flood insurance flood zone
- −$427 /mo · $5,118/yr
- HOA
- −$0
- Vacancy / Maint / Mgmt
- −$354
- Net cashflow
- $152
Break-even live
UW: 25.0% down · 7.5% · 30yr · 1.5% tax · 5.0% vac · 8.0% maint · 8.0% mgmt
Financing live
Cash to close
- Down payment
- $27,250
- Closing costs
- $3,270
- Reserves months
- —
- Total cash needed
- —
Loan-product check · same deal, 3 products live
Conventional
25% down · 7.5% · 30yr
- Down + closing
- —
- Monthly P&I
- —
- Monthly cashflow
- —
- DSCR
- —
- Eligible?
- —
Personal DTI + credit; lowest rate.
DSCR
20% down · 8.5% · 30yr
- Down + closing
- —
- Monthly P&I
- —
- Monthly cashflow
- —
- DSCR
- —
- Eligible?
- —
No personal income docs; deal must DSCR.
Hard money
10% down · 12.0% · 12mo
- Down + closing
- —
- Monthly P&I
- —
- Monthly cashflow
- —
- DSCR
- —
- Eligible?
- —
Short-term bridge; refi at stabilization.
Rent comps 1 comps
| Address | Beds | Baths | Sqft | Rent | $/sqft | DOM | Units | Dist |
|---|---|---|---|---|---|---|---|---|
| 3522 Shipwatch Rd Johns Island, SC | 1.0 | 1.0 | 687 | $1,550 | $2.26 | 19d | 1 | 0.08mi |
Listing history 13 events
-
2026-06-18days on market $109,000 Active 62 DOM
-
2026-06-17days on market $109,000 Active 61 DOM
-
2026-06-16days on market $109,000 Active 60 DOM
-
2026-06-15days on market $109,000 Active 59 DOM
-
2026-06-10days on market $109,000 Active 54 DOM
-
2026-06-09days on market $109,000 Active 53 DOM
-
2026-06-08days on market $109,000 Active 52 DOM
-
2026-06-07days on market $109,000 Active 51 DOM
-
2026-06-05days on market $109,000 Active 48 DOM
-
2026-06-03days on market $109,000 Active 47 DOM
-
2026-06-01days on market $109,000 Active 45 DOM
-
2026-05-31days on market $109,000 Active 44 DOM
-
2026-04-17$109,000 Active
ⓘ Source: listings_history table (triggers on properties + properties_extension) + one-shot
backfill from property_details.listing_events for pre-trigger history.
Climate risk First Street
- Flood 9/10 Extreme FEMA zone AE · 99% chance over 30 yrs
- Wildfire 1/10 Low
- Heat 10/10 Extreme 8 d/yr ≥105°F today · 23 d/yr by 30 yrs out
- Wind 9/10 Extreme 99% chance of damaging wind over 30 yrs
- Air quality 2/10 Low 1 unhealthy d/yr today · 1 by 30 yrs out
Nearby sold comps map
Loading sold comps map…
Walkable amenities ~0.75 mi
Loading nearby amenities…
Taxation est. · year 1
- Rental income
- $20,237
- − Mortgage interest
- −$6,106
- − Property taxes
- −$1,635
- − Insurance
- −$5,664
- − Repairs & maintenance
- −$1,619
- − Management
- −$1,619
- − Depreciation
- −$3,171
- Taxable income
- $424
- Est. tax owed @ 24.0%
- −$102
- After-tax cash flow
- $1,728/yr
For passive investors: Depreciation is non-cash, so a rental often shows a tax loss while cash-flowing — sheltering income. Rental losses are passive: they offset passive income freely, and up to $25,000/yr can offset ordinary (W-2) income if you actively participate and your MAGI is under $100k (phasing out to $0 by $150k); unused losses carry forward. On sale, claimed depreciation is recaptured at up to 25%, and gains may owe capital-gains tax (a 1031 exchange can defer both). Figures are a year-1 estimate at your 24.0% rate — not tax advice; consult a CPA.
Condition & rehab AI · 12 photos
This move-in-ready, tastefully renovated one-bedroom villa is ideally located just steps from the world-famous Kiawah beach and the Sandcastle Beach Club, making it a prime vacation residence with high resale and rental potential.
Value-add opportunities
- Both Beachfront location — High demand and premium location
- Both Modern finishes — Attracts buyers and renters alike
- Both Enhance outdoor space — Improves curb appeal and leisure space
Renovation cost estimate screening
Value-add ROI direction
- Both Beachfront location — High demand and premium location ↑
- Both Modern finishes — Attracts buyers and renters alike ↑
- Both Enhance outdoor space — Improves curb appeal and leisure space ↑
ⓘ Cost ranges are severity-bucket heuristics (US national rule-of-thumb). Get contractor quotes + a written scope before underwriting a rehab budget.
Schools (NCES district)
- District
- Charleston 01
- NCES district ID
- 4501440
- Math proficiency
- 48% ▼ -2.00%
- Reading proficiency
- 53% ▬ 0.00%
- Median HH income
- $52,376
- Composite
- 43.41/100
- National rank
- #3018
- State rank
- #7 of 80 in SC
Livability — Kiawah Island
- Score
- 64/100
- State rank
- #154
- US rank
- #14517
Category grades
Schools grade is shown separately in the Schools card above.
Census & demographics
- Census place
- Kiawah Island, SC
- County
- Charleston County · 366,793 people
- Metro
- Charleston-North Charleston, SC
- Population (ZIP)
- 27,576
- Household income
- $121,372
- Rent vs Own
- Severe rent burden
- 304.0
Population outlook (Charleston County) Hauer SSP2
- Today (2025)
- 480,562 people
- By 2030
- 525,921 · +9.4%
- By 2040
- 612,189 · +27.4%
- By 2050
- 691,627 · +43.9%
- By 2075
- 847,979 · +76.5%
- By 2100
- 926,482 · +92.8%
Race, ethnicity, and origin ACS 2023
- Neighborhood character
- Predominantly White (75%)
- Race & ethnicity
- White 75% Black 11% Hispanic / Latino 8% Two or more races 6% Native American 3%
- Hispanic origin (detail)
- Mexican 4%
- Common ancestry
- Lithuanian 5% Romanian 4% Slovak 3%
- Foreign-born
- 5% · Canada, Dominican Republic
- Languages at home
- 92% English-only · Spanish 6%
Political lean MEDSL · Charleston
- 2024 margin
- Lean D (+5.7) · D 51.9% · R 46.3% · Other 1.8%
- 2008→2024 swing
- -2.7pp toward R · 2008: 8.3pp · 2024: 5.7pp
- All cycles
- 2024: D+5.7 2020: D+12.9 2016: D+7.9 2012: D+2.4 2008: D+8.3
Not yet ingested
- Civics
- —
Market trends
- HPI YoY
- ▼ -223.02%
- Current HPI
- 297.7408
- Rent YoY
- ▲ 2.95%
- Metro
- Charleston-North Charleston, SC
- State GDP YoY
- ▲ 4.51%
- F500 in state
- 2
Industry mix (Fortune 500 HQ in SC)
| Industry | F500 HQs | Revenue |
|---|---|---|
| Packaging | 1 | $7B |
|
||
Price history
1 event — show timeline
- 2026-04-17 Listed $109,000 Charleston Trident MLS
Cash-flow waterfall
monthlySold comps — $/sqft
last 12 mo · ≤1 miLoading sold comps…