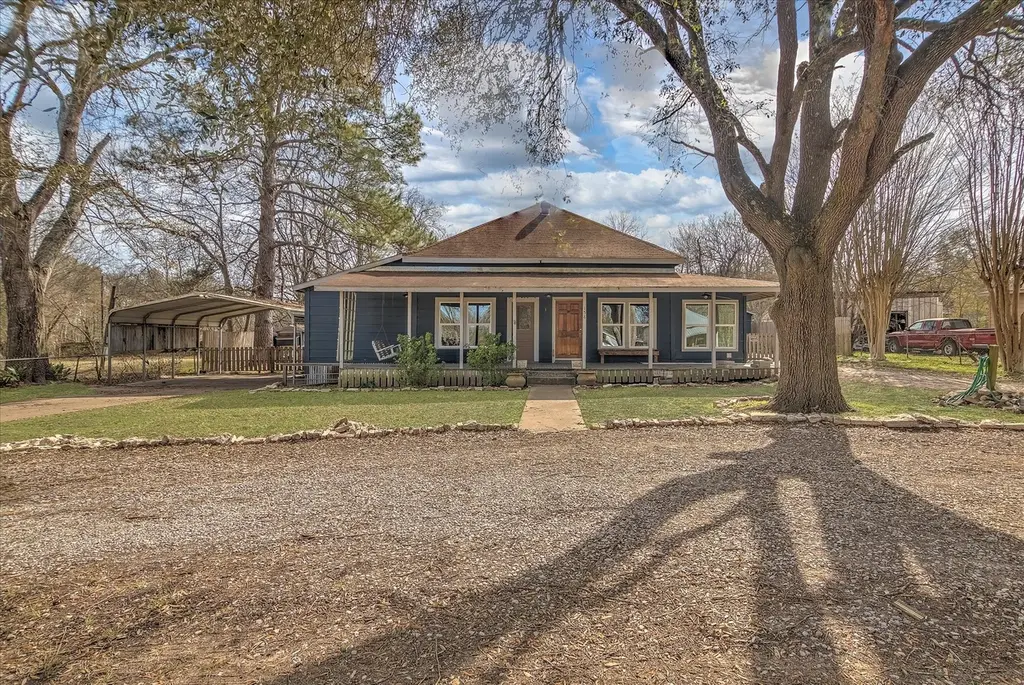
158 E 7th St · Trinity, TX
Flood risk 1/10 · Minimal
- FEMA flood zone
- —
- Chance of flooding over 30 yrs
- 0.0%
- Est. flood insurance / yr
- —
Fire risk 4/10 · Minor
- Est. fire insurance / yr
- $1,222 – $2,270
Heat risk 8/10 · Major
- Hot days now (above 110°F)
- 7 days/yr
- Hot days in 30 yrs
- 24 days/yr
Wind risk 8/10 · Major
- Chance of severe wind over 30 yrs
- 92.0%
Air-quality risk 2/10 · Minimal
- Unhealthy air days now
- 0 days/yr
- Unhealthy air days in 30 yrs
- 1 days/yr
Risk factors via First Street. Map © Google.
Why this score? — see what drove the D grade
The composite is a weighted blend of 9 inputs, each scored 0–100. Each bar is that input's sub-score; the figure is the points it added to the 100-point composite (weight × sub-score).
- Cash flow +10.7/30.0
- ARV discount +8.6/15.0
- Appreciation +4.7/10.0
- 1% rule +3.9/10.0
- DSCR +3.1/10.0
- Livability +2.7/5.0
- Rent growth +2.5/5.0
- Condition / age +2.5/5.0
- Schools +2.3/10.0
$149,900
🖨 Deal sheet 📄 Offer letter ✓ Due diligence
Listing remarks MLS
Nestled in the heart of Trinity, this charming farmhouse offers the perfect blend of character and contemporary living. Inside, spacious rooms are highlighted by rustic accents and bathed in natural light, thanks to brand-new energy-efficient windows. The updated kitchen features new stainless steel appliances, providing a modern touch to the home’s timeless appeal. The floor plan is designed for flexibility. The primary suite includes a private bonus room—ideal for a nursery or quiet study—while a second bonus room at the front of the house serves perfectly as a home office or a fourth bedroom. Outdoor living is where this property truly shines. The expansive fenced yard is a gardener’s dream, complete with a chicken coop, a large shed, and a dedicated workshop for your hobbies and tools. For your vehicles, a generous carport provides covered protection for cars, trucks, or even an RV. Enjoy the peace of serene surroundings while staying just moments away from the town center.
Key facts
- Fenced yard
- Private bonus room
- Dedicated workshop
Tags
Neighborhood map
What this means for you Summary
Snapshot
- This is a 3-bed/2.0-bath single-family listed at $150k.
Deal economics
- At list price, monthly cash flow is $-70 ($-840/yr) — negative.
- To cash-flow at today's rent, offer at most $138k (8.2% below list).
- To meet the 1% rule (rent ≥ 1% of price), the offer needs to be $133k (11.0% below list).
- Recommended offer: $132k (12.0% below list) — sets the bar for market timing.
Location & tenants
- Location reads 54/100 on livability (#1,405 in TX) — a working-class tenant base; expect higher turnover. Strengths: cost of living A+, housing B+, crime B; Watch: schools F, amenities F, commute F.
- Trinity ISD (rural): math 27% / reading 29% proficiency, ranked #682 of 826 in TX (top 83%) — low school quality limits family demand, transient renter base, plan for 1-2y turnover.
- Market conditions: 468 active listings in the ZIP; 1 units permitted in Trinity County in 2024 (0 in 5+ unit buildings).
Forward outlook
- In year one you build about $261 of equity ($1k loan paydown + $-775 appreciation (-0.5% local appreciation)).
- Trinity County population projected at -13% by 2050 — secular population decline; favor cash flow + early exit over multi-decade hold.
Negotiation context
- It's been on market 127 days — a 12% lower offer ($132k) is reasonable based on typical stale-listing flexibility.
Risks & watch-outs
- Watch-outs: built in 1936 — expect roof / HVAC / electrical / plumbing capex.
- Climate carrying-cost: severe wind risk, 92% chance of damaging wind over 30y; extreme-heat days projected 7→24/yr by 2055 (HVAC capex compounding) — expect insurance premiums to compound above CPI over the hold.
Questions for the listing agent
- What do current leases actually rent for vs. the listed asking? Can we see a recent rent roll and the last 12 months of T-12 income?
- It's been on market 127 days. Have you received any prior offers? Is the seller open to a 12% concession, seller financing, or rate buy-down credit?
- Built in 1936 — when were the roof, HVAC, electrical panel, plumbing, and water heater last replaced?
- Why hasn't it sold? Are there any deal-killer items the seller is aware of (foundation, flood, title, zoning, code violations)?
- Is there a deadline driving the sale (1031 exchange, divorce, estate, relocation)? That informs how much negotiation room exists.
- Schools are F-rated, which usually means shorter tenancies and higher turnover. Who's the typical renter profile here, and what's been the actual vacancy rate?
- The area grade is low — what's the realistic commute time and amenity access for the typical tenant pool here? Any planned neighborhood developments (good or bad) we should know about?
- What's the average days-on-market for RENTAL listings here right now (not sales)? A rising rental-DOM trend means longer vacancies and softer asking-rent achievability than the comps imply.
- What's the recent tenant-quality profile in this submarket — average credit score on applications, eviction rate, late-payment / NSF rate, and stable-employment percentage? A property-management company in the area should have these aggregated.
- How much new for-sale + rental construction is in the pipeline within 1–3 miles? Heavy new supply typically softens prices + rents 12–24 months out; constrained supply supports both.
Investment metrics
- 1% rule
- 0.89% ✗
- Cap rate
- 5.73%
- Cash-on-cash
- -2.00%
- DSCR
- 0.91
- GRM
- 9.4
CMA / ARV
- ARV (median comp)
- $153,686
- List price
- $149,900
- Delta
- -2.46%
- Verdict
- FAIR
- Comps
- 20 within 1.0 mi
Show comp detail 4 sales within ~0.75 mi
| Address | Dist | Beds/Ba | Sqft | Sold | Price | $/sf | Match |
|---|---|---|---|---|---|---|---|
| 190 Charles St | 0.51mi | 3/2.0 | 1,468 (-3%) | 13mo | $175,000 | $119 | 61 |
| 110 Redbud St | 0.35mi | 3/2.0 | 1,408 (-7%) | 15mo | $190,000 | $135 | 60 |
| 193 Charles St | 0.54mi | 3/1.5 | 1,306 (-14%) | 0mo | $49,500 | $38 | 50 |
| 410 N Elm St | 0.67mi | 3/2.0 | 1,288 (-15%) | 2mo | $140,000 | $109 | 42 |
Match score weights: distance 35% · size 25% · config 20% · recency 20%. Top-matched comps best support the ARV.
Projected returns pro-forma
-0.52% appreciation · 3.0% rent growth · sell at horizon
- IRR
- -6.5%
- Equity multiple
- 0.71×
- Total profit
- $-12,373
- Equity at exit
- $39,692
- IRR
- -0.1%
- Equity multiple
- 0.99×
- Total profit
- $-525
- Equity at exit
- $44,750
Cash invested: $41,972 (down + closing). Projections, not guarantees.
Landlord ↔ Tenant lean methodology
- Overall (STATE)
- 87 Strongly Landlord-Friendly
- State Texas
- 87 Strongly Landlord-Friendly · R+5
- County
- — inherits STATE
- City
- — inherits STATE
ZIP-level market 75862
- Home prices YoY
- -0.3%
- Active inventory
- 468
- Price-to-rent
- 9.4×
Monthly cashflow live
- Estimated rent
- $1,334 medium interval (Pro) →
- Mortgage (P&I)
- −$786
- Tax from tax record
- −$275 /mo · $3,305/yr
- Insurance
- −$62
- HOA
- −$0
- Vacancy / Maint / Mgmt
- −$280
- Net cashflow
- $-70
Break-even live
UW: 25.0% down · 7.5% · 30yr · 1.5% tax · 5.0% vac · 8.0% maint · 8.0% mgmt
Financing live
Cash to close
- Down payment
- $37,475
- Closing costs
- $4,497
- Reserves months
- —
- Total cash needed
- —
Loan-product check · same deal, 3 products live
Conventional
25% down · 7.5% · 30yr
- Down + closing
- —
- Monthly P&I
- —
- Monthly cashflow
- —
- DSCR
- —
- Eligible?
- —
Personal DTI + credit; lowest rate.
DSCR
20% down · 8.5% · 30yr
- Down + closing
- —
- Monthly P&I
- —
- Monthly cashflow
- —
- DSCR
- —
- Eligible?
- —
No personal income docs; deal must DSCR.
Hard money
10% down · 12.0% · 12mo
- Down + closing
- —
- Monthly P&I
- —
- Monthly cashflow
- —
- DSCR
- —
- Eligible?
- —
Short-term bridge; refi at stabilization.
Listing history 19 events
-
2026-06-19days on market $149,900 Active 127 DOM
-
2026-06-18days on market $149,900 Active 126 DOM
-
2026-06-17days on market $149,900 Active 125 DOM
-
2026-06-16days on market $149,900 Active 124 DOM
-
2026-06-15days on market $149,900 Active 123 DOM
-
2026-06-14days on market $149,900 Active 121 DOM
-
2026-06-13days on market $149,900 Active 120 DOM
-
2026-06-10days on market $149,900 Active 118 DOM
-
2026-06-09days on market $149,900 Active 117 DOM
-
2026-06-08days on market $149,900 Active 116 DOM
-
2026-06-07days on market $149,900 Active 115 DOM
-
2026-06-05days on market $149,900 Active 112 DOM
-
2026-06-02days on market $149,900 Active 110 DOM
-
2026-06-01days on market $149,900 Active 109 DOM
-
2026-05-31days on market $149,900 Active 108 DOM
-
2026-05-30days on market $149,900 Active 107 DOM
-
2026-03-30price $155,000 1022-char remark
Show marketing remark (1022 chars)
Nestled in the heart of Trinity, this charming farmhouse offers the perfect blend of character and contemporary living. Inside, spacious rooms are highlighted by rustic accents and bathed in natural light, thanks to brand-new energy-efficient windows. The updated kitchen features new stainless steel appliances, providing a modern touch to the home’s timeless appeal. The floor plan is designed for flexibility. The primary suite includes a private bonus room—ideal for a nursery or quiet study—while a second bonus room at the front of the house serves perfectly as a home office or a fourth bedroom. Outdoor living is where this property truly shines. The expansive fenced yard is a gardener’s dream, complete with a chicken coop, a large shed, and a dedicated workshop for your hobbies and tools. For your vehicles, a generous carport provides covered protection for cars, trucks, or even an RV. Enjoy the peace of serene surroundings while staying just moments away from the town center.
-
2026-02-12$159,900 Active 1022-char remark
Show marketing remark (1022 chars)
Nestled in the heart of Trinity, this charming farmhouse offers the perfect blend of character and contemporary living. Inside, spacious rooms are highlighted by rustic accents and bathed in natural light, thanks to brand-new energy-efficient windows. The updated kitchen features new stainless steel appliances, providing a modern touch to the home’s timeless appeal. The floor plan is designed for flexibility. The primary suite includes a private bonus room—ideal for a nursery or quiet study—while a second bonus room at the front of the house serves perfectly as a home office or a fourth bedroom. Outdoor living is where this property truly shines. The expansive fenced yard is a gardener’s dream, complete with a chicken coop, a large shed, and a dedicated workshop for your hobbies and tools. For your vehicles, a generous carport provides covered protection for cars, trucks, or even an RV. Enjoy the peace of serene surroundings while staying just moments away from the town center.
-
2011-06-02soldstatus
ⓘ Source: listings_history table (triggers on properties + properties_extension) + one-shot
backfill from property_details.listing_events for pre-trigger history.
Tax reassessment forecast TX · Resets to sale price
- Current annual tax
- $3,305 · $275/mo
- Projected year-2 tax
- $3,305 · $275/mo
- Expected delta
- $0/yr ($0/mo · 0.0%)
ⓘ Screening estimate from a state-policy table — verify with the county assessor before closing.
Climate risk First Street
- Flood 1/10 Low 0% chance over 30 yrs
- Wildfire 4/10 Moderate
- Heat 8/10 Severe 7 d/yr ≥110°F today · 24 d/yr by 30 yrs out
- Wind 8/10 Severe 92% chance of damaging wind over 30 yrs
- Air quality 2/10 Low 0 unhealthy d/yr today · 1 by 30 yrs out
Nearby sold comps map
Loading sold comps map…
Walkable amenities ~0.75 mi
Loading nearby amenities…
Taxation est. · year 1
- Rental income
- $16,010
- − Mortgage interest
- −$8,397
- − Property taxes
- −$3,305
- − Insurance
- −$750
- − Repairs & maintenance
- −$1,281
- − Management
- −$1,281
- − Depreciation
- −$4,361
- Taxable loss
- −$3,364
- Est. tax savings @ 24.0%
- +$807
- After-tax cash flow
- $-33/yr
For passive investors: Depreciation is non-cash, so a rental often shows a tax loss while cash-flowing — sheltering income. Rental losses are passive: they offset passive income freely, and up to $25,000/yr can offset ordinary (W-2) income if you actively participate and your MAGI is under $100k (phasing out to $0 by $150k); unused losses carry forward. On sale, claimed depreciation is recaptured at up to 25%, and gains may owe capital-gains tax (a 1031 exchange can defer both). Figures are a year-1 estimate at your 24.0% rate — not tax advice; consult a CPA.
Schools (NCES district)
- District
- Trinity ISD
- NCES district ID
- 4843200
- Math proficiency
- 27% ▼ -2.00%
- Reading proficiency
- 29% ▲ 1.00%
- Median HH income
- $37,104
- Composite
- 23.31/100
- National rank
- #7919
- State rank
- #682 of 826 in TX
Livability — Trinity
- Score
- 54/100
- State rank
- #1405
- US rank
- #24056
Category grades
Schools grade is shown separately in the Schools card above.
Census & demographics
- Census place
- Trinity, TX
- Population (ZIP)
- 10,030
Population outlook (Trinity County) Hauer SSP2
- Today (2025)
- 13,746 people
- By 2030
- 13,333 · -3.0%
- By 2040
- 12,542 · -8.8%
- By 2050
- 11,942 · -13.1%
- By 2075
- 10,871 · -20.9%
- By 2100
- 9,784 · -28.8%
Race, ethnicity, and origin ACS 2023
- Neighborhood character
- Predominantly White (74%)
- Race & ethnicity
- White 74% Hispanic / Latino 12% Black 10% Two or more races 7%
- Hispanic origin (detail)
- Mexican 11%
- Common ancestry
- Lithuanian 3% Serbian 2% Slovak 2%
- Foreign-born
- 4% · Canada
- Languages at home
- 89% English-only · Spanish 9% French/Haitian/Cajun 2%
Political lean MEDSL · Trinity
- 2024 margin
- Solid R (+67.0) · D 16.2% · R 83.2%
- 2008→2024 swing
- -31.3pp toward R · 2008: -35.7pp · 2024: -67.0pp
- All cycles
- 2024: R+67.0 2020: R+61.3 2016: R+59.9 2012: R+46.9 2008: R+35.7
Not yet ingested
- Civics
- —
Market trends
- HPI YoY
- ▼ -0.52%
- Current HPI
- 174.6638
- Rent YoY
- —
- Metro
- —
- State GDP YoY
- ▲ 3.95%
- F500 in state
- 110
Industry mix (Fortune 500 HQ in TX)
| Industry | F500 HQs | Revenue |
|---|---|---|
| Energy | 16 | $1,198B |
|
||
| Technology | 5 | $198B |
|
||
| Engineering / Construction | 4 | $72B |
|
||
| Energy Services | 3 | $60B |
|
||
| Utilities | 3 | $41B |
|
||
| Healthcare | 2 | $330B |
|
||
Price history
-3.1% since first listed3 events — show timeline
- 2026-03-30 Price Changed $155,000 HARMLS
- 2026-02-12 Listed $159,900 HARMLS
- 2011-06-02 Sold (Public Records) — Public Records
Property tax history
+7.5%/yrLatest (2025): $3,305 · +139.3% YoY. Source: county tax records.
Cash-flow waterfall
monthlySold comps — $/sqft
last 12 mo · ≤1 miLoading sold comps…