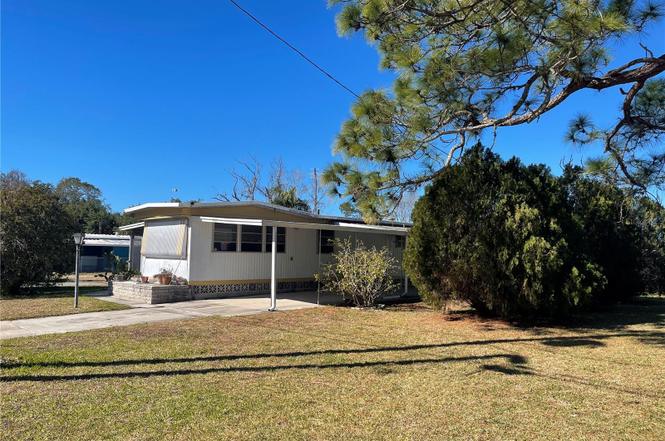
6523 Sandra Dr · Bayonet Point, FL
Flood risk 10/10 · Severe
- FEMA flood zone
- AE
- Chance of flooding over 30 yrs
- 0.99%
- Est. flood insurance / yr
- $1,737 – $8,500
Fire risk 4/10 · Minor
- Est. fire insurance / yr
- $947 – $1,759
Heat risk 10/10 · Severe
- Hot days now (above 114°F)
- 7 days/yr
- Hot days in 30 yrs
- 21 days/yr
Wind risk 10/10 · Severe
- Chance of severe wind over 30 yrs
- 99.0%
Air-quality risk 2/10 · Minimal
- Unhealthy air days now
- 1 days/yr
- Unhealthy air days in 30 yrs
- 3 days/yr
Risk factors via First Street. Map © Google.
Why this score? — see what drove the C+ grade
The composite is a weighted blend of 9 inputs, each scored 0–100. Each bar is that input's sub-score; the figure is the points it added to the 100-point composite (weight × sub-score).
- Cash flow +30.0/30.0
- 1% rule +10.0/10.0
- DSCR +10.0/10.0
- Schools +4.3/10.0
- Livability +3.5/5.0
- Rent growth +2.8/5.0
- Condition / age +2.5/5.0
- ARV discount +0.0/15.0
- Appreciation +0.0/10.0
$65,000
🖨 Deal sheet 📄 Offer letter ✓ Due diligence
Listing remarks
Best deal in Port Richey. No HOA or park fees. The owner owns the land. This home sits on a tranquil double lot with beautiful trees between it and the neighbor for privacy and which help make for a nice and peaceful setting. The double lot includes lots 6523 and 6527 Sandra Dr. New insulation was installed beneath the floors and inside the lower part of the side walls all the way around the house. It has a huge storage room behind the house a second storage/laundry room as well. The lot sits at the end of the street, so barely any traffic passes by the house. It's just a few blocks from US hwy 19, so it's very convenient to shopping, great restaurants, theaters and to some of the best beac
Key facts
- Second storage room
- Double lot
- Tranquil setting
Tags
Property features AI
Finance
- Other: Lot approximately 0.26 acre (0.25–0.49 acre range); Asphalt road access
- HOA & community: No association
Exterior
- Parking: Carport (2 spaces)
- Utilities: Public water; Septic tank; Public utilities
- Home design: Residential mobile home; Single wide; One story; Faces south; Entry level: One
- Construction: Metal siding; Metal roof; Other foundation
- Exterior features: Hurricane shutters; Private mailbox
Interior
- Kitchen: Range
- Bedrooms: 2 bedrooms
- Flooring: Laminate
- Bathrooms: 1 full bath; 1 half bath
- Heating & cooling: No central heat; Wall/window unit(s) for cooling
- Interior features: Window treatments; Storage
- Laundry & utility: Laundry room; Washer
Neighborhood map
What this means for you Summary
Snapshot
- This is a 2-bed/2.0-bath manufactured listed at $65k.
Deal economics
- At list price, monthly cash flow is $190 ($2k/yr) — positive.
- The deal already cash-flows at list — no discount required.
- Meets the 1% rule at list price ($1k rent vs $65k).
- Recommended offer: $59k (9.0% below list) — sets the bar for market timing.
- Cap rate 17.7% vs local median 5.3% in Bayonet Point — top-decile yield for the area; either an underpriced asset or a hidden risk that comps aren't pricing in. Stress-test before assuming the spread holds.
Location & tenants
- Location reads 69/100 on livability (#485 in FL) — a middle-class / working-renter tenant base. Strengths: cost of living A+, housing A+, health & safety A+; Watch: crime D+, amenities D+, commute F.
- Pasco (suburban): math 50% / reading 52% proficiency, ranked #32 of 73 in FL (top 44%) — acceptable for families but not a draw, mixed tenant base, ~2y average lease.
- Zoned schools: Gulf Highlands Elementary School (math 29% / reading 32%, grade F, #1,862 of 2,144 statewide, top 88%, 714 students, 89% FRL); Fivay High School (math 20% / reading 28%, grade F, #529 of 667 statewide, top 80%, 1,610 students, 78% FRL) — zoned schools average 84% FRL vs 48% district-wide (35 pts higher); higher-poverty schools than district average — tighter screening recommended.
- Zoned-school proficiency averages 27% at this address vs 51% district-wide (-24 pts) — the specific schools serving this property underperform the Pasco average; the district grade overstates school quality for this exact location.
- Market conditions: Rents rising (+1.3%/yr); 577 active listings in the ZIP; 4 comparable units currently listed for rent nearby; rentals at typical pace (median 24d on market — plan ~3-4 weeks tenant-placement turnaround); 6,765 units permitted in Pasco County in 2024 (1,250 in 5+ unit buildings).
Forward outlook
- Local home prices are declining (-3.0%/yr); year-one equity from $449 of loan paydown is wiped out by about $2k of value loss. Plan a longer hold.
- Pasco County population projected at +29% by 2050 — long-run rental-demand tailwind backs the buy-and-hold thesis.
Negotiation context
- It's been on market 114 days — a 9% lower offer ($59k) is reasonable based on typical stale-listing flexibility.
- 2 sale attempts; this cycle's ask has dropped $5k (7%) from the opening price — seller is motivated, your offer sets the floor, not the list.
- Current owner paid $42k; list at $65k implies a 55% gain — meaningful room to come down on a strong offer.
Risks & watch-outs
- Watch-outs: flood insurance adds $427/mo.
- Climate carrying-cost: in FEMA flood zone AE (mandatory federal flood insurance); severe wind risk, 99% chance of damaging wind over 30y; extreme-heat days projected 7→21/yr by 2055 (HVAC capex compounding) — expect insurance premiums to compound above CPI over the hold.
Questions for the listing agent
- It's been on market 114 days. Have you received any prior offers? Is the seller open to a 9% concession, seller financing, or rate buy-down credit?
- Built in 1970 — when were the roof, HVAC, electrical panel, plumbing, and water heater last replaced?
- What's the actual annual flood-insurance premium (NFIP or private), and is the property in a SFHA with mandatory coverage?
- Why hasn't it sold? Are there any deal-killer items the seller is aware of (foundation, flood, title, zoning, code violations)?
- Is there a deadline driving the sale (1031 exchange, divorce, estate, relocation)? That informs how much negotiation room exists.
- Schools are F-rated, which usually means shorter tenancies and higher turnover. Who's the typical renter profile here, and what's been the actual vacancy rate?
- Crime grade is D in this area — have there been break-ins, vandalism, or insurance claims at this property in the last 3 years? What carrier currently insures it and at what premium?
- What's the average days-on-market for RENTAL listings here right now (not sales)? A rising rental-DOM trend means longer vacancies and softer asking-rent achievability than the comps imply.
- What's the recent tenant-quality profile in this submarket — average credit score on applications, eviction rate, late-payment / NSF rate, and stable-employment percentage? A property-management company in the area should have these aggregated.
- How much new for-sale + rental construction is in the pipeline within 1–3 miles? Heavy new supply typically softens prices + rents 12–24 months out; constrained supply supports both.
Investment metrics
- 1% rule
- 2.07% ✓
- Cap rate
- 17.67%
- Cash-on-cash
- 40.62%
- DSCR
- 2.81
- GRM
- 4.0
CMA / ARV
- ARV (on-the-fly)
- $53,760
- Comps found
- 5
Show comp detail 5 sales within ~0.75 mi
| Address | Dist | Beds/Ba | Sqft | Sold | Price | $/sf | Match |
|---|---|---|---|---|---|---|---|
| 6515 Margaret Dr | 0.13mi | 2/1.0 | 672 (0%) | 8mo | $50,000 | $74 | 83 |
| 6506 Cathy Dr | 0.05mi | 2/1.0 | 689 (+2%) | 14mo | $55,000 | $80 | 78 |
| 7215 Lofty Dr | 0.67mi | 2/1.5 | 672 (0%) | 7mo | $94,900 | $141 | 61 |
| 11329 Leisure Ln | 0.73mi | 2/2.0 | 744 (+11%) | 8mo | $63,000 | $85 | 41 |
| 6612 Roosevelt Dr | 0.54mi | 1/1.0 (-1) | 576 (-14%) | 11mo | $17,000 | $30 | 32 |
Match score weights: distance 35% · size 25% · config 20% · recency 20%. Top-matched comps best support the ARV.
Projected returns pro-forma
-3.0% appreciation · 1.28% rent growth · sell at horizon
- IRR
- -0.7%
- Equity multiple
- 0.97×
- Total profit
- $-470
- Equity at exit
- $9,692
- IRR
- 6.0%
- Equity multiple
- 1.40×
- Total profit
- $7,200
- Equity at exit
- $5,620
Cash invested: $18,200 (down + closing). Projections, not guarantees.
Landlord ↔ Tenant lean methodology
- Overall (STATE)
- 87 Strongly Landlord-Friendly
- State Florida
- 87 Strongly Landlord-Friendly · R+3
- County
- — inherits STATE
- City
- — inherits STATE
ZIP-level market 34668
- Home prices YoY
- -17.4%
- Rents YoY
- 1.3%
- Active inventory
- 577
- Price-to-rent
- 4.0×
Monthly cashflow live
- Estimated rent
- $1,346 medium interval (Pro) →
- Mortgage (P&I)
- −$341
- Tax from tax record
- −$79 /mo · $950/yr
- Insurance
- −$27
- Flood insurance flood zone
- −$427 /mo · $5,118/yr
- HOA
- −$0
- Vacancy / Maint / Mgmt
- −$283
- Net cashflow
- $190
Break-even live
UW: 25.0% down · 7.5% · 30yr · 1.5% tax · 5.0% vac · 8.0% maint · 8.0% mgmt
Financing live
Cash to close
- Down payment
- $16,250
- Closing costs
- $1,950
- Reserves months
- —
- Total cash needed
- —
Loan-product check · same deal, 3 products live
Conventional
25% down · 7.5% · 30yr
- Down + closing
- —
- Monthly P&I
- —
- Monthly cashflow
- —
- DSCR
- —
- Eligible?
- —
Personal DTI + credit; lowest rate.
DSCR
20% down · 8.5% · 30yr
- Down + closing
- —
- Monthly P&I
- —
- Monthly cashflow
- —
- DSCR
- —
- Eligible?
- —
No personal income docs; deal must DSCR.
Hard money
10% down · 12.0% · 12mo
- Down + closing
- —
- Monthly P&I
- —
- Monthly cashflow
- —
- DSCR
- —
- Eligible?
- —
Short-term bridge; refi at stabilization.
Rent comps 4 comps
| Address | Beds | Baths | Sqft | Rent | $/sqft | DOM | Units | Dist |
|---|---|---|---|---|---|---|---|---|
| 11430 Rohrman Rd Port Richey, FL | 1.0 | 1.0 | 700 | $1,000 | $1.43 | 4d | 1 | 0.20mi |
| 7213 Seward Dr Port Richey, FL | 2.0 | 1.0 | 700 | $1,500 | $2.14 | 24d | 1 | 0.65mi |
| 7110 Tudor Ln Port Richey, FL | 1.0 | 1.0 | 676 | $1,310 | $1.94 | 2d | 1 | 0.79mi |
| 7110 Tudor Ln Port Richey, FL | 1.0 | 1.0 | 676 | $1,310 | $1.94 | 24d | 1 | 0.79mi |
Listing history 14 events
-
2026-06-18days on market $65,000 Active 114 DOM
-
2026-06-17days on market $65,000 Active 113 DOM
-
2026-06-16days on market $65,000 Active 112 DOM
-
2026-06-15days on market $65,000 Active 111 DOM
-
2026-06-13days on market $65,000 Active 109 DOM
-
2026-06-09days on market $65,000 Active 105 DOM
-
2026-06-08days on market $65,000 Active 104 DOM
-
2026-06-08status $65,000 Active 103 DOM
-
2026-05-01price $65,000
-
2026-02-28status Active
-
2026-02-25status Pending
-
2026-02-13$70,000 Active
-
2006-01-18soldstatus $42,000
-
2001-03-01soldstatus $27,000
ⓘ Source: listings_history table (triggers on properties + properties_extension) + one-shot
backfill from property_details.listing_events for pre-trigger history.
Tax reassessment forecast FL · Resets to sale price
- Current annual tax
- $950 · $79/mo
- Projected year-2 tax
- $950 · $79/mo
- Expected delta
- $0/yr ($0/mo · 0.0%)
ⓘ Screening estimate from a state-policy table — verify with the county assessor before closing.
Climate risk First Street
- Flood 10/10 Extreme FEMA zone AE · 99% chance over 30 yrs
- Wildfire 4/10 Moderate
- Heat 10/10 Extreme 7 d/yr ≥114°F today · 21 d/yr by 30 yrs out
- Wind 10/10 Extreme 99% chance of damaging wind over 30 yrs
- Air quality 2/10 Low 1 unhealthy d/yr today · 3 by 30 yrs out
Nearby sold comps map
Loading sold comps map…
Walkable amenities ~0.75 mi
Loading nearby amenities…
Taxation est. · year 1
- Rental income
- $16,150
- − Mortgage interest
- −$3,641
- − Property taxes
- −$950
- − Insurance
- −$5,444
- − Repairs & maintenance
- −$1,292
- − Management
- −$1,292
- − Depreciation
- −$1,891
- Taxable income
- $1,640
- Est. tax owed @ 24.0%
- −$394
- After-tax cash flow
- $1,881/yr
For passive investors: Depreciation is non-cash, so a rental often shows a tax loss while cash-flowing — sheltering income. Rental losses are passive: they offset passive income freely, and up to $25,000/yr can offset ordinary (W-2) income if you actively participate and your MAGI is under $100k (phasing out to $0 by $150k); unused losses carry forward. On sale, claimed depreciation is recaptured at up to 25%, and gains may owe capital-gains tax (a 1031 exchange can defer both). Figures are a year-1 estimate at your 24.0% rate — not tax advice; consult a CPA.
Schools (NCES district)
- District
- Pasco
- NCES district ID
- 1201530
- Math proficiency
- 50% ▼ -10.00%
- Reading proficiency
- 52% ▼ -5.00%
- Median HH income
- $45,039
- Composite
- 43.14/100
- National rank
- #3074
- State rank
- #32 of 73 in FL
Livability — Bayonet Point
- Score
- 69/100
- State rank
- #485
- US rank
- #8934
Category grades
Schools grade is shown separately in the Schools card above.
Census & demographics
- County
- Pasco County · 524,098 people
- Metro
- Tampa-St. Petersburg-Clearwater, FL
- Population (ZIP)
- 49,442
- Household income
- $47,401
- Rent vs Own
- Severe rent burden
- 2699.0
Population outlook (Pasco County) Hauer SSP2
- Today (2025)
- 570,045 people
- By 2030
- 605,844 · +6.3%
- By 2040
- 674,806 · +18.4%
- By 2050
- 736,022 · +29.1%
- By 2075
- 862,900 · +51.4%
- By 2100
- 906,364 · +59.0%
Race, ethnicity, and origin ACS 2023
- Neighborhood character
- Predominantly White (70%)
- Race & ethnicity
- White 70% Hispanic / Latino 23% Two or more races 14% Black 4%
- Hispanic origin (detail)
- Mexican 3% Puerto Rican 10% Cuban 5% Dominican 1%
- Common ancestry
- Romanian 3% Lithuanian 3% Slovak 2%
- Foreign-born
- 11% · Canada, Jamaica
- Languages at home
- 82% English-only · Spanish 14% Other Indo-European 1% French/Haitian/Cajun 1%
Political lean MEDSL · Pasco
- 2024 margin
- Strong R (+25.2) · D 36.9% · R 62.1% · Other 1.0%
- 2008→2024 swing
- -21.6pp toward R · 2008: -3.6pp · 2024: -25.2pp
- All cycles
- 2024: R+25.2 2020: R+20.1 2016: R+21.6 2012: R+6.7 2008: R+3.6
Not yet ingested
- Civics
- —
Market trends
- HPI YoY
- ▼ -75.64%
- Current HPI
- 359.7163
- Rent YoY
- ▲ 1.28%
- Metro
- Tampa-St. Petersburg-Clearwater, FL
- State GDP YoY
- ▲ 3.28%
- F500 in state
- 36
Industry mix (Fortune 500 HQ in FL)
| Industry | F500 HQs | Revenue |
|---|---|---|
| Industrial Technology | 2 | $29B |
|
||
| Insurance | 2 | $17B |
|
||
| Retail | 1 | $60B |
|
||
| Technology Distribution | 1 | $58B |
|
||
| Homebuilding | 1 | $35B |
|
||
| Technology Manufacturing | 1 | $35B |
|
||
Price history
+140.7% since first listed6 events — show timeline
- 2026-05-01 Price Changed $65,000 Stellar MLS as Distributed by MLS Grid
- 2026-02-28 Relisted — Stellar MLS as Distributed by MLS Grid
- 2026-02-25 Pending — Stellar MLS as Distributed by MLS Grid
- 2026-02-13 Listed $70,000 Stellar MLS as Distributed by MLS Grid
- 2006-01-18 Sold (Public Records) $42,000 Public Records
- 2001-03-01 Sold (Public Records) $27,000 Public Records
Property tax history
+5.7%/yrLatest (2025): $950 · +169.8% YoY. Source: county tax records.
Cash-flow waterfall
monthlySold comps — $/sqft
last 12 mo · ≤1 miLoading sold comps…