 Multi-family
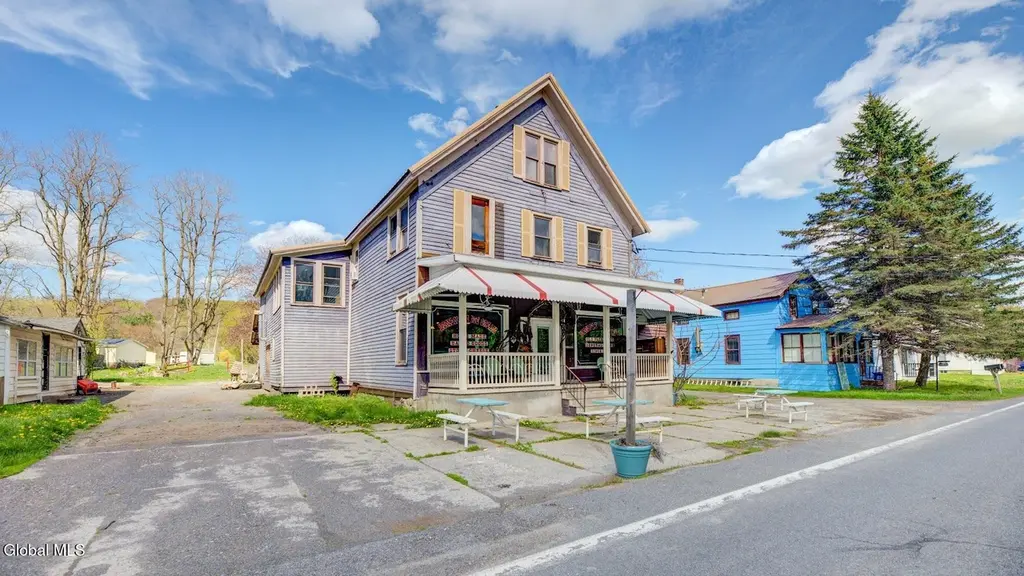
453 State Highway 334 · Johnstown, NY
Flood risk No data
- FEMA flood zone
- —
- Chance of flooding over 30 yrs
- —
- Est. flood insurance / yr
- —
Fire risk No data
- Est. fire insurance / yr
- —
Heat risk No data
- Hot days now (above threshold)
- —
- Hot days in 30 yrs
- —
Wind risk No data
- Chance of severe wind over 30 yrs
- —
Air-quality risk No data
- Unhealthy air days now
- —
- Unhealthy air days in 30 yrs
- —
Risk factors via First Street. Map © Google.
Why this score? — see what drove the C grade
The composite is a weighted blend of 9 inputs, each scored 0–100. Each bar is that input's sub-score; the figure is the points it added to the 100-point composite (weight × sub-score).
- Cash flow +17.5/30.0
- Appreciation +10.0/10.0
- ARV discount +7.5/15.0
- DSCR +5.5/10.0
- 1% rule +4.7/10.0
- Livability +3.9/5.0
- Condition / age +3.8/5.0
- Schools +3.5/10.0
- Rent growth +2.5/5.0
$290,000
🖨 Deal sheet (PDF) 📄 Offer letter ✓ Due diligence
Multi-family units
County records classify this as Multi-Family (2-4 Unit). Listing-text estimate: 1 unit. estimate disagrees with records
Listing remarks
This unique and well-known property, historically recognized as Wemple & Edick's, has long been cherished for its exceptional homemade ice cream, baked goods, and seasonal craft fairs featuring live music and local vendors. Ideally located just minutes from the Historic, city of Johnstown, NY and the NYS Thruway, this offering presents a rare opportunity to carry on a beloved, nostalgic business with an established reputation and loyal following. The property is being offered as a multi-parcel investment, inclusive of four parcels in total. The main building features the retail space along with a second-floor two-bedroom apartment, providing the option to live onsite, generate renta
Key facts
- Historic barn
- 1.35 acre lot
- 2 garage spots
Tags
Property features AI
Exterior
- Parking: Attached garage (2 spaces); Detached parking; Additional off-street parking (total 12 parking spaces)
- Utilities: Septic tank
- Home design: Triplex; Wood siding exterior; Metal roof
- Construction: Wood siding construction
- Exterior features: Porch; Creek on the property; Other exterior features; Second residence and barn(s) on site; Cleared areas and road frontage
Interior
- Bedrooms: Unit 1: 2 bedrooms; Unit 2: 3 bedrooms; Unit 3: 3 bedrooms
- Flooring: Wood flooring
- Bathrooms: Three full bathrooms and one half bathroom (total 4)
- Heating & cooling: Heating present (other type); Wall unit cooling
- Interior features: Built-in features; Full unfinished basement with interior entry and walk-out access
Neighborhood map
What this means for you Summary
Snapshot
- This is a 8-bed/3.5-bath multifamily listed at $290k. Condition is rated good.
Deal economics
- At list price, monthly cash flow is $225 ($3k/yr) — positive.
- The deal already cash-flows at list — no discount required.
- To meet the 1% rule (rent ≥ 1% of price), the offer needs to be $282k (2.7% below list).
- Recommended offer: $281k (3.0% below list) — sets the bar for market timing.
- Cap rate 7.2% vs local median 4.0% in Johnstown — top-decile yield for the area; either an underpriced asset or a hidden risk that comps aren't pricing in. Stress-test before assuming the spread holds.
Location & tenants
- Location reads 78/100 on livability (#168 in NY, #2,603 nationally) — a middle-class / working-renter tenant base. Strengths: housing A+, health & safety A+, cost of living A; Watch: crime D-, amenities D-.
- Johnstown City School District (town): math 35% / reading 47% proficiency, ranked #509 of 590 in NY (top 86%) — families likely to look elsewhere, expect single-tenant / working-renter base with shorter leases.
- Market conditions: 82 active listings in the ZIP; 112 units permitted in Fulton County in 2024 (50 in 5+ unit buildings).
Forward outlook
- In year one you build about $31k of equity ($2k loan paydown + $29k appreciation (10.0% local appreciation)).
- Fulton County population projected at -23% by 2050 — secular population decline; favor cash flow + early exit over multi-decade hold.
- At projected returns (10.0% appreciation + 3.0% rent growth), your $81k cash investment doubles in ~3 years — after that, you're playing with house money.
- By year 2, paydown + projected appreciation supports a ~$50k cash-out refi (75% LTV) — recoverable capital for the next deal without selling this one.
Negotiation context
- It's been on market 44 days — a 3% lower offer ($281k) is reasonable based on typical stale-listing flexibility.
Risks & watch-outs
- Watch-outs: built in 1897 — expect roof / HVAC / electrical / plumbing capex.
Questions for the listing agent
- It's been on market 44 days. Have you received any prior offers? Is the seller open to a 3% concession, seller financing, or rate buy-down credit?
- Built in 1897 — when were the roof, HVAC, electrical panel, plumbing, and water heater last replaced?
- Is there a deadline driving the sale (1031 exchange, divorce, estate, relocation)? That informs how much negotiation room exists.
- Crime grade is D in this area — have there been break-ins, vandalism, or insurance claims at this property in the last 3 years? What carrier currently insures it and at what premium?
- What's the average days-on-market for RENTAL listings here right now (not sales)? A rising rental-DOM trend means longer vacancies and softer asking-rent achievability than the comps imply.
- What's the recent tenant-quality profile in this submarket — average credit score on applications, eviction rate, late-payment / NSF rate, and stable-employment percentage? A property-management company in the area should have these aggregated.
- How much new apartment / multifamily construction is in the pipeline within 1–3 miles? Heavy new supply (>2% of stock underway) typically softens rents 12–24 months out; light construction supports rent growth.
Investment metrics
- 1% rule
- 0.97% ✗
- Cap rate
- 7.23%
- Cash-on-cash
- 3.33%
- DSCR
- 1.15
- GRM
- 8.6
CMA / ARV
No comps found within radius.
Projected returns pro-forma
10.0% appreciation · 3.0% rent growth · sell at horizon
- IRR
- 26.7%
- Equity multiple
- 3.12×
- Total profit
- $172,331
- Equity at exit
- $261,255
- IRR
- 23.4%
- Equity multiple
- 7.11×
- Total profit
- $496,289
- Equity at exit
- $563,406
Cash invested: $81,200 (down + closing). Projections, not guarantees.
Landlord ↔ Tenant lean methodology
- Overall (STATE)
- 15 Strongly Tenant-Friendly
- State New York
- 15 Strongly Tenant-Friendly · D+10
- County
- — inherits STATE
- City
- — inherits STATE
ZIP-level market 12095
- Home prices YoY
- 3.8%
- Active inventory
- 82
- Price-to-rent
- 18.1×
Monthly cashflow live
- Estimated rent
- $2,822 medium interval (Pro) →
- Mortgage (P&I)
- −$1,521
- Tax est. 1.5%
- −$362 /mo · $4,350/yr
- Insurance
- −$121
- HOA
- −$0
- Vacancy / Maint / Mgmt
- −$593
- Net cashflow
- $225
Break-even live
Sensitivity live
| Price | -10% $426 | -5% $325 | +0% $225 | +5% $125 | +10% $25 |
|---|---|---|---|---|---|
| Rent | -10% $2 | -5% $114 | +0% $225 | +5% $337 | +10% $448 |
| Rate | -1.0pp $371 | -0.5pp $299 | base $225 | +0.5pp $150 | +1.0pp $74 |
2-unit breakdown (identical units grouped — click to expand)
| Units | Beds | Baths | Est. rent |
|---|---|---|---|
| 1× unit | 2 | 1 | $1,333 |
| 1× unit | 0 | 0 | $1,489 |
| Total (2 units) | $2,822 | ||
UW: 25.0% down · 7.5% · 30yr · 1.5% tax · 5.0% vac · 8.0% maint · 8.0% mgmt
Financing live
Cash to close
- Down payment
- $72,500
- Closing costs
- $8,700
- Reserves months
- —
- Total cash needed
- —
Loan-product check · same deal, 3 products live
Conventional
25% down · 7.5% · 30yr
- Down + closing
- —
- Monthly P&I
- —
- Monthly cashflow
- —
- DSCR
- —
- Eligible?
- —
Personal DTI + credit; lowest rate.
DSCR
20% down · 8.5% · 30yr
- Down + closing
- —
- Monthly P&I
- —
- Monthly cashflow
- —
- DSCR
- —
- Eligible?
- —
No personal income docs; deal must DSCR.
Hard money
10% down · 12.0% · 12mo
- Down + closing
- —
- Monthly P&I
- —
- Monthly cashflow
- —
- DSCR
- —
- Eligible?
- —
Short-term bridge; refi at stabilization.
Listing history 16 events
-
2026-06-21days on market $290,000 Active 44 DOM
-
2026-06-18days on market $290,000 Active 42 DOM
-
2026-06-17days on market $290,000 Active 41 DOM
-
2026-06-16days on market $290,000 Active 40 DOM
-
2026-06-15days on market $290,000 Active 39 DOM
-
2026-06-13days on market $290,000 Active 37 DOM
-
2026-06-12pricedays on market $290,000 Active 36 DOM
-
2026-06-09days on market $310,000 Active 33 DOM
-
2026-06-08days on market $310,000 Active 32 DOM
-
2026-06-07days on market $310,000 Active 31 DOM
-
2026-06-07days on market $310,000 Active 30 DOM
-
2026-06-04days on market $310,000 Active 27 DOM
-
2026-06-02days on market $310,000 Active 26 DOM
-
2026-06-01days on market $310,000 Active 25 DOM
-
2026-05-31days on market $310,000 Active 24 DOM
-
2026-05-05$310,000 Active
ⓘ Source: listings_history table (triggers on properties + properties_extension) + one-shot
backfill from property_details.listing_events for pre-trigger history.
Nearby sold comps map
Loading sold comps map…
Walkable amenities ~0.75 mi
Loading nearby amenities…
Taxation est. · year 1
- Rental income
- $33,864
- − Mortgage interest
- −$16,245
- − Property taxes
- −$4,350
- − Insurance
- −$1,450
- − Repairs & maintenance
- −$2,709
- − Management
- −$2,709
- − Depreciation
- −$8,436
- Taxable loss
- −$2,035
- Est. tax savings @ 24.0%
- +$488
- After-tax cash flow
- $3,191/yr
For passive investors: Depreciation is non-cash, so a rental often shows a tax loss while cash-flowing — sheltering income. Rental losses are passive: they offset passive income freely, and up to $25,000/yr can offset ordinary (W-2) income if you actively participate and your MAGI is under $100k (phasing out to $0 by $150k); unused losses carry forward. On sale, claimed depreciation is recaptured at up to 25%, and gains may owe capital-gains tax (a 1031 exchange can defer both). Figures are a year-1 estimate at your 24.0% rate — not tax advice; consult a CPA.
Condition & rehab AI · 13 photos
This multi-family property is in good condition with a good investment opportunity. It offers a well-maintained interior and exterior, with potential for minor updates to enhance its curb appeal and value.
Value-add opportunities
- Both Update exterior siding and paint — Enhances curb appeal and property value
- Resale Modernize kitchen appliances — Improves functionality and appeal
- Both Install energy-efficient windows — Reduces energy costs and enhances property value
Renovation cost estimate screening
Value-add ROI direction
- Both Update exterior siding and paint — Enhances curb appeal and property value ↑
- Resale Modernize kitchen appliances — Improves functionality and appeal ↑
- Both Install energy-efficient windows — Reduces energy costs and enhances property value ↑
ⓘ Cost ranges are severity-bucket heuristics (US national rule-of-thumb). Get contractor quotes + a written scope before underwriting a rehab budget.
Schools (NCES district)
- District
- Johnstown City School District
- NCES district ID
- 3615980
- Math proficiency
- 35% ▼ -8.00%
- Reading proficiency
- 47% ▲ 4.00%
- Median HH income
- $45,999
- Composite
- 34.89/100
- National rank
- #5082
- State rank
- #509 of 590 in NY
Livability — Johnstown
- Score
- 78/100
- State rank
- #168
- US rank
- #2603
Category grades
Schools grade is shown separately in the Schools card above.
Census & demographics
- Population (ZIP)
- 12,013
Population outlook (Fulton County) Hauer SSP2
- Today (2025)
- 51,132 people
- By 2030
- 49,114 · -3.9%
- By 2040
- 44,373 · -13.2%
- By 2050
- 39,321 · -23.1%
- By 2075
- 28,503 · -44.3%
- By 2100
- 19,268 · -62.3%
Race, ethnicity, and origin ACS 2023
- Neighborhood character
- Predominantly White (90%)
- Race & ethnicity
- White 90% Hispanic / Latino 4% Two or more races 4% Black 2%
- Common ancestry
- Iranian 6% Romanian 5% Lithuanian 4%
- Foreign-born
- 2% · Canada
- Languages at home
- 97% English-only · Spanish 2%
Political lean MEDSL · Fulton
- 2024 margin
- Solid R (+35.9) · D 32.1% · R 67.9%
- 2008→2024 swing
- -26.6pp toward R · 2008: -9.2pp · 2024: -35.9pp
- All cycles
- 2024: R+35.9 2020: R+31.4 2016: R+35.5 2012: R+10.5 2008: R+9.2
Not yet ingested
- Civics
- —
Market trends
- HPI YoY
- ▲ 10.82%
- Current HPI
- 297.365
- Rent YoY
- —
- Metro
- —
- State GDP YoY
- ▲ 2.60%
- F500 in state
- 92
Industry mix (Fortune 500 HQ in NY)
| Industry | F500 HQs | Revenue |
|---|---|---|
| Financial Services | 10 | $950B |
|
||
| Consumer Goods | 9 | $162B |
|
||
| Insurance | 4 | $225B |
|
||
| Telecommunications | 2 | $144B |
|
||
| Pharmaceuticals | 2 | $112B |
|
||
| Media / Entertainment | 2 | $69B |
|
||
Price history
1 event — show timeline
- 2026-05-05 Listed $310,000 Global MLS
Cash-flow waterfall
monthlySold comps — $/sqft
last 12 mo · ≤1 miLoading sold comps…