 🏷️ Likely Rental
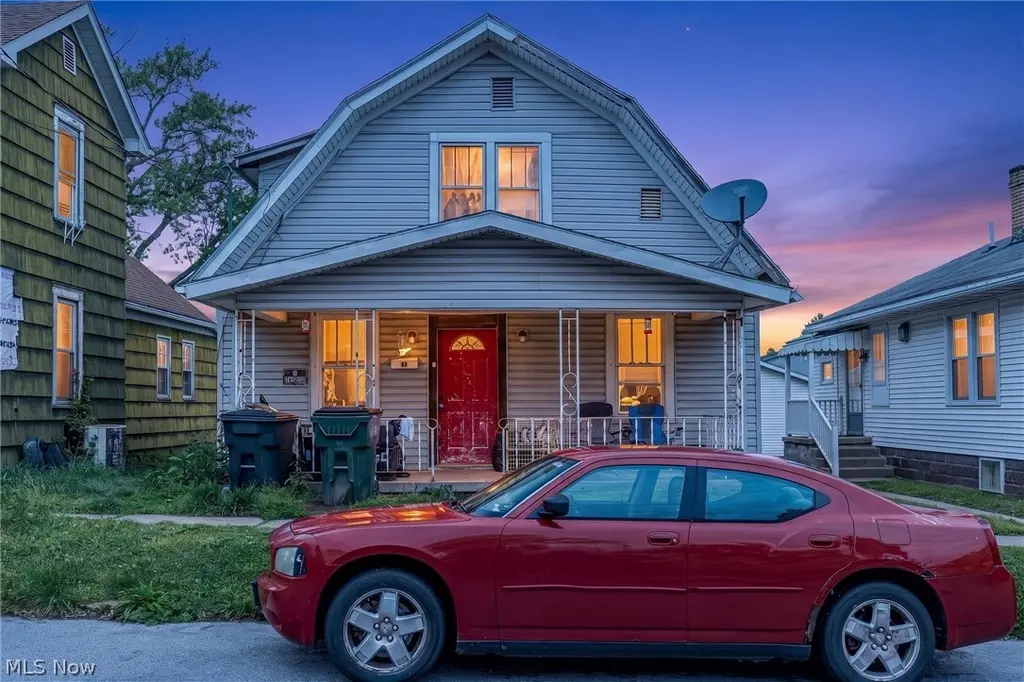
217 Hunts Ave · Barnesville, OH
Flood risk 1/10 · Minimal
- FEMA flood zone
- X (unshaded)
- Chance of flooding over 30 yrs
- 0.0%
- Est. flood insurance / yr
- $473 – $860
Fire risk 3/10 · Minor
- Est. fire insurance / yr
- $713 – $1,323
Heat risk 3/10 · Minor
- Hot days now (above 95°F)
- 7 days/yr
- Hot days in 30 yrs
- 18 days/yr
Wind risk 1/10 · Minimal
- Chance of severe wind over 30 yrs
- 1.0%
Air-quality risk 2/10 · Minimal
- Unhealthy air days now
- 0 days/yr
- Unhealthy air days in 30 yrs
- 1 days/yr
Risk factors via First Street. Map © Google.
Why this score? — see what drove the B+ grade
The composite is a weighted blend of 9 inputs, each scored 0–100. Each bar is that input's sub-score; the figure is the points it added to the 100-point composite (weight × sub-score).
- Cash flow +30.0/30.0
- ARV discount +15.0/15.0
- DSCR +10.0/10.0
- 1% rule +9.3/10.0
- Schools +4.5/10.0
- Livability +3.4/5.0
- Rent growth +2.5/5.0
- Condition / age +2.5/5.0
- Appreciation +0.0/10.0
$66,000
🖨 Deal sheet (PDF) 📄 Offer letter ✓ Due diligence
Listing remarks
Opportunity awaits with this affordable 2-story home in Barnesville featuring classic character, spacious living areas, and low property taxes. Currently tenant-occupied at $600/month, this property offers immediate income potential for investors or landlords looking to expand their portfolio. The home features generous room sizes, original woodwork accents, a covered front porch, and a functional layout with multiple living spaces. Some renovation and cleanout will be needed, but the property offers a solid starting point for the right buyer to add value over time. Conveniently located near local schools, shops, and downtown amenities. Property is being sold as-is. Great opportunity for an
Key facts
- Covered front porch
- 2 story home
- 4,486 sq ft lot
Tags
Property features AI
Finance
- Financial info: Annual taxes listed (detail excluded per instructions)
Exterior
- Parking: 2 garage spaces listed; Also listed as 'No Garage' under parking features (discrepancy noted)
- Utilities: Public and private water sources listed; Public sewer, private sewer, or septic tank listed; Utilities and water/sewer availability may vary (entries include 'Sewer Not Available' and 'Water Not Available')
- Home design: Two-story property; Year built per public records
- Exterior features: Lot approximately 0.103 acres; Below-grade finished area of about 378 (finished basement area); Above-grade finished area of about 1,287
Interior
- Bathrooms: One full bathroom (main level)
- Heating & cooling: Forced air heating
- Interior features: Basement present and unfinished; Total of 5 rooms
Neighborhood map
What this means for you Summary
Snapshot
- This is a 2-bed/1.0-bath single-family listed at $66k.
Deal economics
- At list price, monthly cash flow is $331 ($4k/yr) — positive.
- The deal already cash-flows at list — no discount required.
- Meets the 1% rule at list price ($947 rent vs $66k).
- Recommended offer: $64k (3.0% below list) — sets the bar for market timing.
Location & tenants
- Location reads 68/100 on livability (#568 in OH) — a middle-class / working-renter tenant base. Strengths: crime A+, cost of living A+, housing A+; Watch: employment D, amenities F, commute F.
- Barnesville Exempted Village (town): math 48% / reading 59% proficiency, ranked #403 of 656 in OH (top 61%) — acceptable for families but not a draw, mixed tenant base, ~2y average lease.
- Zoned schools: Barnesville Elementary School (math 60% / reading 61%, grade B-, #657 of 1,584 statewide, top 42%, 544 students, 40% FRL); Barnesville Middle School (math 45% / reading 57%, grade C, #405 of 654 statewide, top 63%, 436 students, 38% FRL); Barnesville High School (math 32% / reading 62%, grade D-, #435 of 781 statewide, top 59%, 400 students, 31% FRL) — zoned schools at 36% FRL track the district average.
- Market conditions: 19 active listings in the ZIP; 4 units permitted in Belmont County in 2024 (0 in 5+ unit buildings).
Forward outlook
- Local home prices are declining (-3.0%/yr); year-one equity from $456 of loan paydown is wiped out by about $2k of value loss. Plan a longer hold.
- Belmont County population projected at -15% by 2050 — secular population decline; favor cash flow + early exit over multi-decade hold.
- At projected returns (-3.0% appreciation + 3.0% rent growth), your $18k cash investment doubles in ~6 years — after that, you're playing with house money.
Negotiation context
- It's been on market 33 days — a 3% lower offer ($64k) is reasonable based on typical stale-listing flexibility.
- 2 sale attempts since 6y ago with the ask held roughly flat each time — persistent listings suggest the price (not the market) is what's stuck; bring a comps-based counter.
Risks & watch-outs
- Watch-outs: built in 1900 — expect roof / HVAC / electrical / plumbing capex.
Questions for the listing agent
- It's been on market 33 days. Have you received any prior offers? Is the seller open to a 3% concession, seller financing, or rate buy-down credit?
- Built in 1900 — when were the roof, HVAC, electrical panel, plumbing, and water heater last replaced?
- Is there a deadline driving the sale (1031 exchange, divorce, estate, relocation)? That informs how much negotiation room exists.
- Schools are B-rated — typically a magnet for longer-tenancy family renters. What's the average tenant stay here, and is there a school-zone premium baked into asking?
- What's the average days-on-market for RENTAL listings here right now (not sales)? A rising rental-DOM trend means longer vacancies and softer asking-rent achievability than the comps imply.
- What's the recent tenant-quality profile in this submarket — average credit score on applications, eviction rate, late-payment / NSF rate, and stable-employment percentage? A property-management company in the area should have these aggregated.
- How much new for-sale + rental construction is in the pipeline within 1–3 miles? Heavy new supply typically softens prices + rents 12–24 months out; constrained supply supports both.
Investment metrics
- 1% rule
- 1.43% ✓
- Cap rate
- 12.31%
- Cash-on-cash
- 21.49%
- DSCR
- 1.96
- GRM
- 5.8
CMA / ARV
- ARV (median comp)
- $125,411
- List price
- $66,000
- Delta
- -47.37%
- Verdict
- UNDERPRICED
- Comps
- 20 within 1.0 mi
Show comp detail 7 sales within ~0.75 mi
| Address | Dist | Beds/Ba | Sqft | Sold | Price | $/sf | Match |
|---|---|---|---|---|---|---|---|
| 331 W Leatherwood Rd | 0.29mi | 3/1.5 (+1) | 1,202 (-7%) | 12mo | $150,000 | $125 | 58 |
| 517 N Broadway St | 0.54mi | 2/1.0 | 1,208 (-6%) | 16mo | $101,000 | $84 | 52 |
| 158 Warren Ave | 0.64mi | 2/1.0 | 1,288 (+0%) | 23mo | $28,000 | $22 | 51 |
| 126 Westview Dr | 0.57mi | 3/1.5 (+1) | 1,344 (+4%) | 13mo | $175,000 | $130 | 48 |
| 139 E Walnut St | 0.47mi | 2/3.0 | 1,161 (-10%) | 10mo | $255,000 | $220 | 46 |
| 208 Walton Ave | 0.57mi | 3/2.0 (+1) | 1,440 (+12%) | 12mo | $143,000 | $99 | 35 |
| 130 Ohio St | 0.60mi | 3/2.0 (+1) | 1,454 (+13%) | 17mo | $142,000 | $98 | 27 |
Match score weights: distance 35% · size 25% · config 20% · recency 20%. Top-matched comps best support the ARV.
Projected returns pro-forma
-3.0% appreciation · 3.0% rent growth · sell at horizon
- IRR
- 14.0%
- Equity multiple
- 1.56×
- Total profit
- $10,376
- Equity at exit
- $9,841
- IRR
- 22.8%
- Equity multiple
- 2.96×
- Total profit
- $36,141
- Equity at exit
- $5,706
Cash invested: $18,480 (down + closing). Projections, not guarantees.
Landlord ↔ Tenant lean methodology
- Overall (STATE)
- 73 Landlord-Friendly
- State Ohio
- 73 Landlord-Friendly · R+6
- County
- — inherits STATE
- City
- — inherits STATE
ZIP-level market 43713
- Home prices YoY
- -12.6%
- Active inventory
- 19
- Price-to-rent
- 5.8×
Monthly cashflow live
- Estimated rent
- $947 medium interval (Pro) →
- Mortgage (P&I)
- −$346
- Tax from tax record
- −$44 /mo · $523/yr
- Insurance
- −$28
- HOA
- −$0
- Vacancy / Maint / Mgmt
- −$199
- Net cashflow
- $331
Break-even live
Sensitivity live
| Price | -10% $368 | -5% $350 | +0% $331 | +5% $312 | +10% $294 |
|---|---|---|---|---|---|
| Rent | -10% $256 | -5% $294 | +0% $331 | +5% $368 | +10% $406 |
| Rate | -1.0pp $364 | -0.5pp $348 | base $331 | +0.5pp $314 | +1.0pp $296 |
UW: 25.0% down · 7.5% · 30yr · 1.5% tax · 5.0% vac · 8.0% maint · 8.0% mgmt
Financing live
Cash to close
- Down payment
- $16,500
- Closing costs
- $1,980
- Reserves months
- —
- Total cash needed
- —
Loan-product check · same deal, 3 products live
Conventional
25% down · 7.5% · 30yr
- Down + closing
- —
- Monthly P&I
- —
- Monthly cashflow
- —
- DSCR
- —
- Eligible?
- —
Personal DTI + credit; lowest rate.
DSCR
20% down · 8.5% · 30yr
- Down + closing
- —
- Monthly P&I
- —
- Monthly cashflow
- —
- DSCR
- —
- Eligible?
- —
No personal income docs; deal must DSCR.
Hard money
10% down · 12.0% · 12mo
- Down + closing
- —
- Monthly P&I
- —
- Monthly cashflow
- —
- DSCR
- —
- Eligible?
- —
Short-term bridge; refi at stabilization.
Listing history 13 events
-
2026-06-12status $66,000 Pending 33 DOM
-
2026-06-09days on market $66,000 Contingent 33 DOM
-
2026-06-08days on market $66,000 Contingent 32 DOM
-
2026-06-07days on market $66,000 Contingent 31 DOM
-
2026-06-07days on market $66,000 Contingent 30 DOM
-
2026-06-04statusdays on market $66,000 Contingent 27 DOM
-
2026-06-02days on market $66,000 Active 26 DOM
-
2026-06-01days on market $66,000 Active 25 DOM
-
2026-05-31days on market $66,000 Active 24 DOM
-
2026-05-15price $66,000 762-char remark
-
2026-05-07$67,000 Active 762-char remark
-
2020-07-02historical
-
2020-06-18$14,781
ⓘ Source: listings_history table (triggers on properties + properties_extension) + one-shot
backfill from property_details.listing_events for pre-trigger history.
Tax reassessment forecast OH · Partial reset (capped growth)
- Current annual tax
- $523 · $44/mo
- Projected year-2 tax
- $776 · $65/mo
- Expected delta
- +$253/yr (+$21/mo · 48.4%)
ⓘ Screening estimate from a state-policy table — verify with the county assessor before closing.
Climate risk First Street
- Flood 1/10 Low FEMA zone X (unshaded) · 0% chance over 30 yrs
- Wildfire 3/10 Moderate
- Heat 3/10 Moderate 7 d/yr ≥95°F today · 18 d/yr by 30 yrs out
- Wind 1/10 Low 100% chance of damaging wind over 30 yrs
- Air quality 2/10 Low 0 unhealthy d/yr today · 1 by 30 yrs out
Nearby sold comps map
Loading sold comps map…
Walkable amenities ~0.75 mi
Loading nearby amenities…
Taxation est. · year 1
- Rental income
- $11,365
- − Mortgage interest
- −$3,697
- − Property taxes
- −$523
- − Insurance
- −$330
- − Repairs & maintenance
- −$909
- − Management
- −$909
- − Depreciation
- −$1,920
- Taxable income
- $3,076
- Est. tax owed @ 24.0%
- −$738
- After-tax cash flow
- $3,233/yr
For passive investors: Depreciation is non-cash, so a rental often shows a tax loss while cash-flowing — sheltering income. Rental losses are passive: they offset passive income freely, and up to $25,000/yr can offset ordinary (W-2) income if you actively participate and your MAGI is under $100k (phasing out to $0 by $150k); unused losses carry forward. On sale, claimed depreciation is recaptured at up to 25%, and gains may owe capital-gains tax (a 1031 exchange can defer both). Figures are a year-1 estimate at your 24.0% rate — not tax advice; consult a CPA.
Schools (NCES district)
- District
- Barnesville Exempted Village
- NCES district ID
- 3904520
- Math proficiency
- 48% ▼ -14.00%
- Reading proficiency
- 59% ▼ -6.00%
- Median HH income
- $41,952
- Composite
- 44.88/100
- National rank
- #2718
- State rank
- #403 of 656 in OH
Livability — Barnesville
- Score
- 68/100
- State rank
- #568
- US rank
- #9729
Category grades
Schools grade is shown separately in the Schools card above.
Census & demographics
- Census place
- Barnesville, OH
- County
- Belmont · 63,139 people
- City population
- 6,511
- Metro
- Wheeling, WV-OH
- Population (ZIP)
- 6,511
- Household income
- $61,206
- Rent vs Own
- Severe rent burden
- 15.0
Population outlook (Belmont County) Hauer SSP2
- Today (2025)
- 66,568 people
- By 2030
- 64,818 · -2.6%
- By 2040
- 60,702 · -8.8%
- By 2050
- 56,427 · -15.2%
- By 2075
- 46,222 · -30.6%
- By 2100
- 34,611 · -48.0%
Race, ethnicity, and origin ACS 2023
- Neighborhood character
- Predominantly White (92%)
- Race & ethnicity
- White 92% Two or more races 5% Hispanic / Latino 2%
- Common ancestry
- Serbian 2% Slovak 2% Iranian 1%
- Foreign-born
- 2% · Canada, Jamaica, Vietnam
- Languages at home
- 99% English-only · Spanish 1% Vietnamese 1%
Political lean MEDSL · Belmont
- 2024 margin
- Solid R (+47.3) · D 26.0% · R 73.3%
- 2008→2024 swing
- -50.0pp toward R · 2008: 2.7pp · 2024: -47.3pp
- All cycles
- 2024: R+47.3 2020: R+43.6 2016: R+39.5 2012: R+8.4 2008: D+2.7
Not yet ingested
- Civics
- —
Market trends
- HPI YoY
- ▼ -26.20%
- Current HPI
- 181.4654
- Rent YoY
- —
- Metro
- —
- State GDP YoY
- ▲ 1.98%
- F500 in state
- 48
Industry mix (Fortune 500 HQ in OH)
| Industry | F500 HQs | Revenue |
|---|---|---|
| Insurance | 3 | $145B |
|
||
| Industrial Machinery | 3 | $49B |
|
||
| Financial Services | 3 | $24B |
|
||
| Consumer Goods | 2 | $93B |
|
||
| Aerospace / Defense | 2 | $47B |
|
||
| Utilities | 2 | $33B |
|
||
Price history
+346.5% since first listed6 events — show timeline
- 2026-06-09 Pending — MLSNOW
- 2026-06-03 Contingent — MLSNOW
- 2026-05-15 Price Changed $66,000 MLSNOW
- 2026-05-07 Listed $67,000 MLSNOW
- 2020-07-02 Listing Removed — MLSNOW
- 2020-06-18 Listed $14,781 MLSNOW
Property tax history
+0.8%/yrLatest (2025): $523 · +1.5% YoY. Source: county tax records.
Cash-flow waterfall
monthlySold comps — $/sqft
last 12 mo · ≤1 miLoading sold comps…