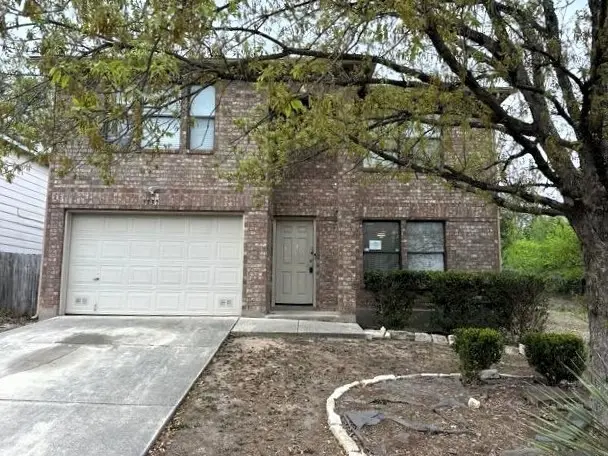
3731 Wetmore Rdg · San Antonio, TX
Flood risk 1/10 · Minimal
- FEMA flood zone
- X (unshaded)
- Chance of flooding over 30 yrs
- 0.0%
- Est. flood insurance / yr
- $507 – $1,088
Fire risk 3/10 · Minor
- Est. fire insurance / yr
- $1,222 – $2,270
Heat risk 8/10 · Major
- Hot days now (above 107°F)
- 7 days/yr
- Hot days in 30 yrs
- 23 days/yr
Wind risk 8/10 · Major
- Chance of severe wind over 30 yrs
- 80.0%
Air-quality risk 2/10 · Minimal
- Unhealthy air days now
- 1 days/yr
- Unhealthy air days in 30 yrs
- 1 days/yr
Risk factors via First Street. Map © Google.
Why this score? — see what drove the D grade
The composite is a weighted blend of 9 inputs, each scored 0–100. Each bar is that input's sub-score; the figure is the points it added to the 100-point composite (weight × sub-score).
- ARV discount +15.0/15.0
- Cash flow +8.0/30.0
- 1% rule +4.2/10.0
- Livability +4.0/5.0
- Schools +3.8/10.0
- Condition / age +2.5/5.0
- DSCR +2.0/10.0
- Rent growth +1.8/5.0
- Appreciation +0.0/10.0
$202,000
🖨 Deal sheet (PDF) 📄 Offer letter ✓ Due diligence
Listing remarks MLS
Opportunity meets lifestyle in this 3-bedroom, 2-bath home with a 2-car attached garage in established Wetmore Heights. Inside offers a functional layout ready for your personal touch, while outside is where it shines—featuring a private pool and a covered patio with a built-in outdoor kitchen setup, perfect for weekend hangouts or entertaining. Some repairs and updates are needed, giving buyers a chance to add value and make it their own. Conveniently located near H-E-B, Target, The Forum at Olympia Parkway, McAllister Park, and easy access to major roads for a smooth commute.
Key facts
- Private pool
- Covered patio
- Conveniently located
Tags
Neighborhood map
What this means for you Summary
Snapshot
- This is a 3-bed/2.0-bath single-family listed at $202k.
Deal economics
- At list price, monthly cash flow is $-210 ($-3k/yr) — negative.
- To cash-flow at today's rent, offer at most $165k (18.3% below list).
- To meet the 1% rule (rent ≥ 1% of price), the offer needs to be $186k (7.7% below list).
- Recommended offer: $165k (18.3% below list) — sets the bar for cash-flow.
- Cap rate 5.0% vs local median 3.8% in San Antonio — top-decile yield for the area; either an underpriced asset or a hidden risk that comps aren't pricing in. Stress-test before assuming the spread holds.
Location & tenants
- Location reads 80/100 on livability (#31 in TX, #1,616 nationally) — a professional / high-income tenant draw. Strengths: amenities A+, commute A+, cost of living A+; Watch: crime F.
- North East ISD (urban): math 38% / reading 49% proficiency, ranked #276 of 826 in TX (top 33%) — families likely to look elsewhere, expect single-tenant / working-renter base with shorter leases.
- Zoned schools: Stahl El (math 23% / reading 33%, grade F, #2,740 of 4,322 statewide, top 64%, 586 students, 73% FRL); Driscoll Middle (math 19% / reading 38%, grade F, #1,122 of 1,662 statewide, top 69%, 603 students, 58% FRL); Madison H S (math 26% / reading 49%, grade F, #888 of 1,632 statewide, top 55%, 2,850 students, 53% FRL) — zoned schools average 61% FRL vs 41% district-wide (20 pts higher); higher-poverty schools than district average — tighter screening recommended.
- Zoned-school proficiency averages 31% at this address vs 44% district-wide (-12 pts) — the specific schools serving this property underperform the North East ISD average; the district grade overstates school quality for this exact location.
- Market conditions: Rents soft (-2.7%/yr); 269 active listings in the ZIP; 40 comparable units currently listed for rent nearby; rentals at typical pace (median 20d on market — plan ~3-4 weeks tenant-placement turnaround); solid renter incomes; 8,308 units permitted in Bexar County in 2024 (2,506 in 5+ unit buildings).
Forward outlook
- Local home prices are declining (-3.0%/yr); year-one equity from $1k of loan paydown is wiped out by about $6k of value loss. Plan a longer hold.
- Bexar County population projected at +50% by 2050 — long-run rental-demand tailwind backs the buy-and-hold thesis.
Negotiation context
- It's been on market 69 days — a 6% lower offer ($190k) is reasonable based on typical stale-listing flexibility.
- 5 sale attempts since 21y ago with the ask held roughly flat each time — persistent listings suggest the price (not the market) is what's stuck; bring a comps-based counter.
Risks & watch-outs
- Watch-outs: property tax is 3.0% of price.
- Climate carrying-cost: severe wind risk, 80% chance of damaging wind over 30y; extreme-heat days projected 7→23/yr by 2055 (HVAC capex compounding) — expect insurance premiums to compound above CPI over the hold.
Questions for the listing agent
- What do current leases actually rent for vs. the listed asking? Can we see a recent rent roll and the last 12 months of T-12 income?
- It's been on market 69 days. Have you received any prior offers? Is the seller open to a 18% concession, seller financing, or rate buy-down credit?
- Property tax is high relative to price — has the assessment been appealed recently, and will the sale trigger a re-assessment?
- What does the HOA fee cover, when was the last increase, and are there any pending special assessments or reserve-fund shortfalls?
- Why hasn't it sold? Are there any deal-killer items the seller is aware of (foundation, flood, title, zoning, code violations)?
- Is there a deadline driving the sale (1031 exchange, divorce, estate, relocation)? That informs how much negotiation room exists.
- Crime grade is F in this area — have there been break-ins, vandalism, or insurance claims at this property in the last 3 years? What carrier currently insures it and at what premium?
- The area grade is low — what's the realistic commute time and amenity access for the typical tenant pool here? Any planned neighborhood developments (good or bad) we should know about?
- What's the average days-on-market for RENTAL listings here right now (not sales)? A rising rental-DOM trend means longer vacancies and softer asking-rent achievability than the comps imply.
- What's the recent tenant-quality profile in this submarket — average credit score on applications, eviction rate, late-payment / NSF rate, and stable-employment percentage? A property-management company in the area should have these aggregated.
- How much new for-sale + rental construction is in the pipeline within 1–3 miles? Heavy new supply typically softens prices + rents 12–24 months out; constrained supply supports both.
Investment metrics
- 1% rule
- 0.92% ✗
- Cap rate
- 5.05%
- Cash-on-cash
- -4.45%
- DSCR
- 0.80
- GRM
- 9.0
CMA / ARV
- ARV (median comp)
- $257,688
- List price
- $202,000
- Delta
- -21.61%
- Verdict
- UNDERPRICED
- Comps
- 20 within 1.0 mi
Show comp detail 12 sales within ~0.75 mi
| Address | Dist | Beds/Ba | Sqft | Sold | Price | $/sf | Match |
|---|---|---|---|---|---|---|---|
| 13806 Fairway Crst | 0.49mi | 3/2.0 | 1,617 (+2%) | 6mo | $275,000 | $170 | 68 |
| 14422 Briarbranch | 0.28mi | 3/2.0 | 1,401 (-11%) | 1mo | $240,000 | $171 | 67 |
| 15007 Miss Ellie Dr | 0.65mi | 3/2.0 | 1,576 (-0%) | 10mo | $269,900 | $171 | 60 |
| 4006 Stahl Rd | 0.40mi | 3/2.0 | 1,752 (+11%) | 5mo | $339,000 | $193 | 60 |
| 14403 Briarmist St | 0.73mi | 3/2.0 | 1,558 (-2%) | 6mo | $229,500 | $147 | 58 |
| 14423 Briarlake | 0.28mi | 4/2.5 (+1) | 1,377 (-13%) | 2mo | $220,000 | $160 | 56 |
| 14201 Mesquite Smoke St | 0.56mi | 3/2.0 | 1,412 (-11%) | 5mo | $115,000 | $81 | 52 |
| 3318 Rosetti | 0.70mi | 4/2.0 (+1) | 1,686 (+7%) | 1mo | $239,900 | $142 | 50 |
| 4023 Briar Holw | 0.51mi | 3/2.0 | 1,398 (-12%) | 9mo | $229,900 | $164 | 49 |
| 13424 Bristow Dawn | 0.46mi | 2/2.5 (-1) | 1,349 (-15%) | 4mo | $180,000 | $133 | 44 |
| 13711 Auburn Oaks | 0.74mi | 3/2.0 | 1,743 (+10%) | 9mo | $299,500 | $172 | 41 |
| 15015 Digger | 0.67mi | 2/2.0 (-1) | 1,369 (-14%) | 9mo | $298,000 | $218 | 33 |
Match score weights: distance 35% · size 25% · config 20% · recency 20%. Top-matched comps best support the ARV.
Projected returns pro-forma
-3.0% appreciation · 0.0% rent growth · sell at horizon
- IRR
- -27.9%
- Equity multiple
- 0.09×
- Total profit
- $-51,350
- Equity at exit
- $30,119
- IRR
- -49.0%
- Equity multiple
- -0.45×
- Total profit
- $-82,198
- Equity at exit
- $17,465
Cash invested: $56,560 (down + closing). Projections, not guarantees.
Landlord ↔ Tenant lean methodology
- Overall (STATE)
- 87 Strongly Landlord-Friendly
- State Texas
- 87 Strongly Landlord-Friendly · R+5
- County
- — inherits STATE
- City
- — inherits STATE
ZIP-level market 78247
- Home prices YoY
- -25.8%
- Rents YoY
- -2.7%
- Active inventory
- 269
- Price-to-rent
- 9.0×
Monthly cashflow live
- Estimated rent
- $1,864 high interval (Pro) →
- Mortgage (P&I)
- −$1,059
- Tax from tax record
- −$500 /mo · $5,999/yr
- Insurance
- −$84
- HOA
- −$39
- Vacancy / Maint / Mgmt
- −$391
- Net cashflow
- $-210
Break-even live
Sensitivity live
| Price | -10% $-95 | -5% $-153 | +0% $-210 | +5% $-267 | +10% $-324 |
|---|---|---|---|---|---|
| Rent | -10% $-357 | -5% $-283 | +0% $-210 | +5% $-136 | +10% $-62 |
| Rate | -1.0pp $-108 | -0.5pp $-158 | base $-210 | +0.5pp $-262 | +1.0pp $-315 |
UW: 25.0% down · 7.5% · 30yr · 1.5% tax · 5.0% vac · 8.0% maint · 8.0% mgmt
Financing live
Cash to close
- Down payment
- $50,500
- Closing costs
- $6,060
- Reserves months
- —
- Total cash needed
- —
Loan-product check · same deal, 3 products live
Conventional
25% down · 7.5% · 30yr
- Down + closing
- —
- Monthly P&I
- —
- Monthly cashflow
- —
- DSCR
- —
- Eligible?
- —
Personal DTI + credit; lowest rate.
DSCR
20% down · 8.5% · 30yr
- Down + closing
- —
- Monthly P&I
- —
- Monthly cashflow
- —
- DSCR
- —
- Eligible?
- —
No personal income docs; deal must DSCR.
Hard money
10% down · 12.0% · 12mo
- Down + closing
- —
- Monthly P&I
- —
- Monthly cashflow
- —
- DSCR
- —
- Eligible?
- —
Short-term bridge; refi at stabilization.
Rent comps 40 comps
| Address | Beds | Baths | Sqft | Rent | $/sqft | DOM | Units | Dist |
|---|---|---|---|---|---|---|---|---|
| 14127 Wetmore Bnd San Antonio, TX | 3.0 | 2.0 | 1505 | $1,950 | $1.30 | 45d | 1 | 0.09mi |
| 13530 Bristow Dawn San Antonio, TX | 3.0 | 2.5 | 1614 | $1,550 | $0.96 | 45d | 1 | 0.42mi |
| 3502 McCormick St San Antonio, TX | 4.0 | 2.5 | 2178 | $2,200 | $1.01 | 18d | 1 | 0.42mi |
| 13516 Bristow Dawn San Antonio, TX | 2.0 | 2.5 | 1281 | $1,425 | $1.11 | 15d | 1 | 0.43mi |
| 13416 Bristow Dawn San Antonio, TX | 2.0 | 2.5 | 1281 | $1,450 | $1.13 | 16d | 1 | 0.48mi |
| 13408 Bristow Dawn San Antonio, TX | 3.0 | 2.5 | 1497 | $1,450 | $0.97 | 25d | 1 | 0.50mi |
| 3342 Coral Grove Dr San Antonio, TX | 4.0 | 2.0 | 2062 | $2,050 | $0.99 | 16d | 1 | 0.50mi |
| 3932 Heritage Hill Dr San Antonio, TX | 3.0 | 2.0 | 1395 | $1,495 | $1.07 | 25d | 1 | 0.50mi |
| 3406 Bunyan St San Antonio, TX | 3.0 | 2.0 | 2183 | $1,895 | $0.87 | 18d | 1 | 0.51mi |
| 13313 Bristow Dawn San Antonio, TX | 3.0 | 2.5 | 1615 | $2,200 | $1.36 | 45d | 1 | 0.53mi |
| 13309 Bristow Dawn San Antonio, TX | 3.0 | 2.5 | 1454 | $1,475 | $1.01 | 25d | 1 | 0.53mi |
| 3932 Chimney Springs Dr San Antonio, TX | 3.0 | 2.0 | 1344 | $1,850 | $1.38 | 45d | 1 | 0.55mi |
| 3319 Tree Grove Dr San Antonio, TX | 3.0 | 2.0 | 1807 | $1,800 | $1.00 | 6d | 1 | 0.62mi |
| 13031 Park Xing San Antonio, TX | 1.0–3.0 | 1.0–2.5 | 1070 | $2,051 | $1.92 | 0d | 22 | 0.68mi |
| 3224 Coral Grove Dr San Antonio, TX | 3.0 | 2.0 | 2079 | $1,945 | $0.94 | 6d | 1 | 0.68mi |
| 3618 Sage Ridge Dr San Antonio, TX | 3.0 | 2.0 | 1849 | $1,900 | $1.03 | 14d | 1 | 0.69mi |
| 3210 Coral Grove Dr San Antonio, TX | 4.0 | 2.0 | 2015 | $2,100 | $1.04 | 6d | 1 | 0.73mi |
| 4318 Windswept San Antonio, TX | 3.0 | 2.0 | 1958 | $1,995 | $1.02 | 4d | 1 | 0.77mi |
| 3207 Sackville Dr San Antonio, TX | 3.0 | 2.0 | 2183 | $1,915 | $0.88 | 25d | 1 | 0.79mi |
| 15114 Mineral Springs St San Antonio, TX | 3.0 | 2.0 | 1787 | $1,950 | $1.09 | 18d | 1 | 0.82mi |
| 15114 Mineral Springs St San Antonio, TX | 3.0 | 2.0 | 1787 | $1,950 | $1.09 | 23d | 1 | 0.82mi |
| 13619 Summer Glen Dr San Antonio, TX | 4.0 | 2.5 | 1990 | $2,000 | $1.01 | 25d | 1 | 0.83mi |
| 4278 Putting Grn San Antonio, TX | 2.0 | 2.0 | 1974 | $2,995 | $1.52 | 45d | 1 | 0.87mi |
| 4410 Putting Grn San Antonio, TX | 3.0 | 2.0 | 1324 | $1,770 | $1.34 | 45d | 1 | 0.94mi |
| 14414 Briarledge St San Antonio, TX | 4.0 | 2.0 | 1936 | $1,995 | $1.03 | 25d | 1 | 0.95mi |
| 12635 Scarsdale St San Antonio, TX | 1.0–2.0 | 1.0–2.0 | 900 | $1,540 | $1.71 | 0d | 19 | 0.96mi |
| 11002 Moonlit Grv San Antonio, TX | 3.0 | 3.0 | 1437 | $1,575 | $1.10 | 45d | 1 | 0.97mi |
| 12619 Woodbrace St San Antonio, TX | 2.0 | 2.5 | 1843 | $2,100 | $1.14 | 19d | 1 | 1.02mi |
| 4522 Sherwood Way San Antonio, TX | 3.0 | 2.0 | 1702 | $1,925 | $1.13 | 25d | 1 | 1.05mi |
| 14907 Palmer Crk San Antonio, TX | 3.0 | 2.0 | 1903 | $2,500 | $1.31 | 9d | 1 | 1.10mi |
| 4606 Crested Land San Antonio, TX | 3.0 | 2.0 | 1663 | $1,700 | $1.02 | 9d | 1 | 1.11mi |
| 9 Sulfur Cyn San Antonio, TX | 3.0 | 2.5 | 2177 | $1,795 | $0.82 | 5d | 1 | 1.13mi |
| 79 Viking Oak San Antonio, TX | 3.0 | 3.0 | 1753 | $2,300 | $1.31 | 25d | 1 | 1.14mi |
| 3170 Morning Crk San Antonio, TX | 3.0 | 2.0 | 1827 | $2,000 | $1.09 | 9d | 1 | 1.18mi |
| 12160 Stoney Brg San Antonio, TX | 3.0 | 2.0 | 1345 | $1,895 | $1.41 | 9d | 1 | 1.20mi |
| 12617 Thistle Down San Antonio, TX | 3.0 | 2.0 | 1621 | $1,875 | $1.16 | 16d | 1 | 1.21mi |
| 14346 Markham Ln San Antonio, TX | 3.0 | 2.0 | 1623 | $1,795 | $1.11 | 25d | 1 | 1.25mi |
| 12219 Ridge Cave St San Antonio, TX | 3.0 | 2.0 | 1177 | $2,200 | $1.87 | 45d | 1 | 1.26mi |
| 335 Harmony Ct San Antonio, TX | 2.0 | 1.5 | 1220 | $1,195 | $0.98 | 45d | 1 | 1.26mi |
| 3614 Ridge Dawn St San Antonio, TX | 3.0 | 3.0 | 1207 | $1,749 | $1.45 | 16d | 1 | 1.26mi |
HOA detail
- Monthly dues
- $39 · $468/yr
- Likely covers
- pool
Listing history 29 events
-
2026-06-21days on market $202,000 Active 69 DOM
-
2026-06-18days on market $202,000 Active 66 DOM
-
2026-06-17days on market $202,000 Active 65 DOM
-
2026-06-16days on market $202,000 Active 64 DOM
-
2026-06-13days on market $202,000 Active 61 DOM
-
2026-06-13days on market $202,000 Active 60 DOM
-
2026-06-09days on market $202,000 Active 57 DOM
-
2026-06-08days on market $202,000 Active 56 DOM
-
2026-06-07days on market $202,000 Active 55 DOM
-
2026-06-04days on market $202,000 Active 52 DOM
-
2026-06-03days on market $202,000 Active 51 DOM
-
2026-06-02days on market $202,000 Active 50 DOM
-
2026-06-01days on market $202,000 Active 49 DOM
-
2026-05-31days on market $202,000 Active 48 DOM
-
2026-04-13$202,000 Active 590-char remark
Show marketing remark (590 chars)
Opportunity meets lifestyle in this 3-bedroom, 2-bath home with a 2-car attached garage in established Wetmore Heights. Inside offers a functional layout ready for your personal touch, while outside is where it shines—featuring a private pool and a covered patio with a built-in outdoor kitchen setup, perfect for weekend hangouts or entertaining. Some repairs and updates are needed, giving buyers a chance to add value and make it their own. Conveniently located near H-E-B, Target, The Forum at Olympia Parkway, McAllister Park, and easy access to major roads for a smooth commute.
-
2021-06-10soldstatus
-
2021-06-09soldstatus Sold 757-char remark
Show marketing remark (757 chars)
This homes boasts outdoor entertainment, imagine days filled with fun by the pool, enjoying the covered patio area including a full outdoor kitchen, and newly built deck. Consider privacy with no near neighbors to the right of the home and beautiful mature trees in front and back yard. This 3 bedroom 2.5 bath floor plan includes an oversized Master bedroom. Conveniently, all three bedrooms upstairs. A Huge pantry offering plenty of storage space. Sleek granite countertops in the kitchen. Tile throughout the entire main floor of the home. Sitting in the gated community of St. James place- and within minutes from McAllister Park. This home is conveniently located in San Antonio and an easy commute to the most popular destinations in the city.
-
2021-05-10status Pending 757-char remark
Show marketing remark (757 chars)
This homes boasts outdoor entertainment, imagine days filled with fun by the pool, enjoying the covered patio area including a full outdoor kitchen, and newly built deck. Consider privacy with no near neighbors to the right of the home and beautiful mature trees in front and back yard. This 3 bedroom 2.5 bath floor plan includes an oversized Master bedroom. Conveniently, all three bedrooms upstairs. A Huge pantry offering plenty of storage space. Sleek granite countertops in the kitchen. Tile throughout the entire main floor of the home. Sitting in the gated community of St. James place- and within minutes from McAllister Park. This home is conveniently located in San Antonio and an easy commute to the most popular destinations in the city.
-
2021-05-05historical Active Option 757-char remark
Show marketing remark (757 chars)
This homes boasts outdoor entertainment, imagine days filled with fun by the pool, enjoying the covered patio area including a full outdoor kitchen, and newly built deck. Consider privacy with no near neighbors to the right of the home and beautiful mature trees in front and back yard. This 3 bedroom 2.5 bath floor plan includes an oversized Master bedroom. Conveniently, all three bedrooms upstairs. A Huge pantry offering plenty of storage space. Sleek granite countertops in the kitchen. Tile throughout the entire main floor of the home. Sitting in the gated community of St. James place- and within minutes from McAllister Park. This home is conveniently located in San Antonio and an easy commute to the most popular destinations in the city.
-
2021-05-03$229,900 New 757-char remark
Show marketing remark (757 chars)
This homes boasts outdoor entertainment, imagine days filled with fun by the pool, enjoying the covered patio area including a full outdoor kitchen, and newly built deck. Consider privacy with no near neighbors to the right of the home and beautiful mature trees in front and back yard. This 3 bedroom 2.5 bath floor plan includes an oversized Master bedroom. Conveniently, all three bedrooms upstairs. A Huge pantry offering plenty of storage space. Sleek granite countertops in the kitchen. Tile throughout the entire main floor of the home. Sitting in the gated community of St. James place- and within minutes from McAllister Park. This home is conveniently located in San Antonio and an easy commute to the most popular destinations in the city.
-
2011-09-20soldstatus
-
2010-08-06historical
-
2010-06-25$144,900
-
2007-11-28soldstatus
-
2007-11-26soldstatus
-
2007-09-25$152,500
-
2005-09-22soldstatus
-
2005-09-16soldstatus
-
2005-08-25$98,900
ⓘ Source: listings_history table (triggers on properties + properties_extension) + one-shot
backfill from property_details.listing_events for pre-trigger history.
Tax reassessment forecast TX · Resets to sale price
- Current annual tax
- $5,999 · $500/mo
- Projected year-2 tax
- $5,999 · $500/mo
- Expected delta
- $0/yr ($0/mo · 0.0%)
ⓘ Screening estimate from a state-policy table — verify with the county assessor before closing.
Climate risk First Street
- Flood 1/10 Low FEMA zone X (unshaded) · 0% chance over 30 yrs
- Wildfire 3/10 Moderate
- Heat 8/10 Severe 7 d/yr ≥107°F today · 23 d/yr by 30 yrs out
- Wind 8/10 Severe 80% chance of damaging wind over 30 yrs
- Air quality 2/10 Low 1 unhealthy d/yr today · 1 by 30 yrs out
Nearby sold comps map
Loading sold comps map…
Walkable amenities ~0.75 mi
Loading nearby amenities…
Taxation est. · year 1
- Rental income
- $22,370
- − Mortgage interest
- −$11,315
- − Property taxes
- −$5,999
- − Insurance
- −$1,010
- − Repairs & maintenance
- −$1,790
- − Management
- −$1,790
- − HOA
- −$468
- − Depreciation
- −$5,876
- Taxable loss
- −$5,878
- Est. tax savings @ 24.0%
- +$1,411
- After-tax cash flow
- $-1,106/yr
For passive investors: Depreciation is non-cash, so a rental often shows a tax loss while cash-flowing — sheltering income. Rental losses are passive: they offset passive income freely, and up to $25,000/yr can offset ordinary (W-2) income if you actively participate and your MAGI is under $100k (phasing out to $0 by $150k); unused losses carry forward. On sale, claimed depreciation is recaptured at up to 25%, and gains may owe capital-gains tax (a 1031 exchange can defer both). Figures are a year-1 estimate at your 24.0% rate — not tax advice; consult a CPA.
Schools (NCES district)
- District
- North East ISD
- NCES district ID
- 4832940
- Math proficiency
- 38% ▼ -14.00%
- Reading proficiency
- 49% ▼ -4.00%
- Median HH income
- $57,715
- Composite
- 38.1/100
- National rank
- #4276
- State rank
- #276 of 826 in TX
Livability — San Antonio
- Score
- 80/100
- State rank
- #31
- US rank
- #1616
Category grades
Schools grade is shown separately in the Schools card above.
Census & demographics
- Census place
- San Antonio, TX
- County
- Bexar County · 1,990,555 people
- City population
- 1,806,925
- Metro
- San Antonio-New Braunfels, TX
- Population (ZIP)
- 51,933
- Household income
- $91,013
- Rent vs Own
- Severe rent burden
- 828.0
Population outlook (Bexar County) Hauer SSP2
- Today (2025)
- 2,336,851 people
- By 2030
- 2,560,728 · +9.6%
- By 2040
- 3,020,569 · +29.3%
- By 2050
- 3,493,522 · +49.5%
- By 2075
- 4,668,459 · +99.8%
- By 2100
- 5,533,242 · +136.8%
Race, ethnicity, and origin ACS 2023
- Neighborhood character
- Diverse neighborhood (Simpson 0.62)
- Race & ethnicity
- Hispanic / Latino 45% White 42% Two or more races 24% Black 7% Asian 2%
- Hispanic origin (detail)
- Mexican 36% Puerto Rican 1%
- Common ancestry
- Slovak 2% Romanian 2% Lithuanian 2%
- Foreign-born
- 11% · Canada, Jamaica, Vietnam
- Languages at home
- 74% English-only · Spanish 22% Vietnamese 1% Arabic 1%
Political lean MEDSL · Bexar
- 2024 margin
- Lean D (+9.8) · D 54.3% · R 44.6% · Other 1.1%
- 2008→2024 swing
- +4.2pp toward D · 2008: 5.6pp · 2024: 9.8pp
- All cycles
- 2024: D+9.8 2020: D+18.2 2016: D+13.5 2012: D+4.6 2008: D+5.6
Not yet ingested
- Civics
- —
Market trends
- HPI YoY
- ▼ -89.75%
- Current HPI
- 258.6065
- Rent YoY
- ▼ -2.72%
- Metro
- San Antonio-New Braunfels, TX
- State GDP YoY
- ▲ 3.95%
- F500 in state
- 110
Industry mix (Fortune 500 HQ in TX)
| Industry | F500 HQs | Revenue |
|---|---|---|
| Energy | 16 | $1,198B |
|
||
| Technology | 5 | $198B |
|
||
| Engineering / Construction | 4 | $72B |
|
||
| Energy Services | 3 | $60B |
|
||
| Utilities | 3 | $41B |
|
||
| Healthcare | 2 | $330B |
|
||
Price history
+104.2% since first listed15 events — show timeline
- 2026-04-13 Listed $202,000 HARMLS
- 2021-06-10 Sold (Public Records) — Public Records
- 2021-06-09 Sold (MLS) — LERA
- 2021-05-10 Pending — LERA
- 2021-05-05 Contingent — LERA
- 2021-05-03 Listed $229,900 LERA
- 2011-09-20 Sold (Public Records) — Public Records
- 2010-08-06 Listing Removed — LERA
- 2010-06-25 Listed $144,900 LERA
- 2007-11-28 Sold (MLS) — LERA
- 2007-11-26 Sold (Public Records) — Public Records
- 2007-09-25 Listed $152,500 LERA
- 2005-09-22 Sold (Public Records) — Public Records
- 2005-09-16 Sold (MLS) — LERA
- 2005-08-25 Listed $98,900 LERA
Property tax history
+4.2%/yrLatest (2025): $5,999 · -1.9% YoY. Source: county tax records.
Cash-flow waterfall
monthlySold comps — $/sqft
last 12 mo · ≤1 miLoading sold comps…