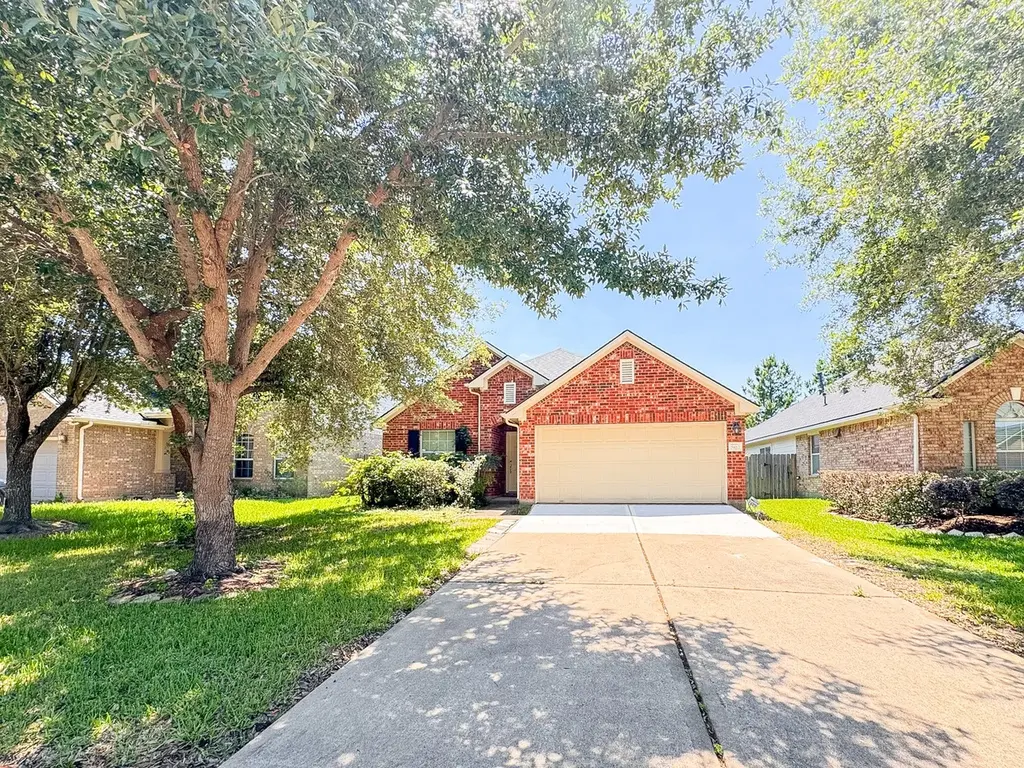
7922 Thorncroft Manor Ln · Houston, TX
Flood risk 4/10 · Minor
- FEMA flood zone
- X (unshaded)
- Chance of flooding over 30 yrs
- 0.22%
- Est. flood insurance / yr
- $507 – $1,088
Fire risk 3/10 · Minor
- Est. fire insurance / yr
- $1,222 – $2,270
Heat risk 9/10 · Severe
- Hot days now (above 111°F)
- 7 days/yr
- Hot days in 30 yrs
- 23 days/yr
Wind risk 9/10 · Severe
- Chance of severe wind over 30 yrs
- 99.0%
Air-quality risk 2/10 · Minimal
- Unhealthy air days now
- 1 days/yr
- Unhealthy air days in 30 yrs
- 2 days/yr
Risk factors via First Street. Map © Google.
Why this score? — see what drove the D+ grade
The composite is a weighted blend of 9 inputs, each scored 0–100. Each bar is that input's sub-score; the figure is the points it added to the 100-point composite (weight × sub-score).
- ARV discount +15.0/15.0
- Cash flow +9.2/30.0
- Schools +4.5/10.0
- 1% rule +4.0/10.0
- Appreciation +3.8/10.0
- Livability +3.7/5.0
- DSCR +2.6/10.0
- Condition / age +2.5/5.0
- Rent growth +2.2/5.0
$239,999
🖨 Deal sheet 📄 Offer letter ✓ Due diligence
Listing remarks
Charming one-story brick home featuring 4 bedrooms, 2 bathrooms, and a 2-car attached garage. This property offers solid structure and has been well maintained, requiring only minor cosmetic updates to make it your own no major repairs needed. Spacious layout provides comfortable living with great potential for personalization. Conveniently located near the Grand Mission community amenities, including pools, parks, and walking trails. Ideal opportunity for buyers seeking a move-in ready home with room to add their own style. Don't miss out on the opportunity to make this home yours!
Key facts
- 5,771 sq ft lot
- 2 garage spots
- Built 2007
Property features AI
Finance
- HOA & community: Part of Grand Mission HOA
Exterior
- Parking: Attached 2-car garage
- Utilities: Public water; Public sewer; Electric service
- Home design: Residential property; One-story entry (all main rooms listed on the first floor)
- Construction: Brick construction; Composition roof; Built in 2007; Slab foundation
- Exterior features: Cleared lot
Interior
- Kitchen: Kitchen on the first floor (14x16)
- Bedrooms: Primary bedroom on the first floor (12x12); Three additional bedrooms on the first floor (11x11; 10x10; 10x10)
- Bathrooms: Two full bathrooms
- Heating & cooling: Central heating (electric); Central air conditioning (electric)
- Interior features: One fireplace; Seven total rooms
Neighborhood map
What this means for you Summary
Snapshot
- This is a 4-bed/2.0-bath single-family listed at $240k.
Deal economics
- At list price, monthly cash flow is $-182 ($-2k/yr) — negative.
- To cash-flow at today's rent, offer at most $208k (13.4% below list).
- To meet the 1% rule (rent ≥ 1% of price), the offer needs to be $216k (9.9% below list).
- Recommended offer: $208k (13.4% below list) — sets the bar for cash-flow.
- Cap rate 5.4% vs local median 3.2% in Houston — top-decile yield for the area; either an underpriced asset or a hidden risk that comps aren't pricing in. Stress-test before assuming the spread holds.
Location & tenants
- Location reads 74/100 on livability (#184 in TX, #4,771 nationally) — a middle-class / working-renter tenant base. Strengths: amenities A+, cost of living A+, housing A+; Watch: crime F.
- Fort Bend ISD (suburban): math 44% / reading 53% proficiency, ranked #140 of 826 in TX (top 17%) — families likely to look elsewhere, expect single-tenant / working-renter base with shorter leases.
- Zoned schools: David Crockett Middle (math 30% / reading 44%, grade F, #756 of 1,662 statewide, top 47%, 1,119 students, 70% FRL) — zoned schools average 70% FRL vs 35% district-wide (36 pts higher); higher-poverty schools than district average — tighter screening recommended.
- Market conditions: Rents soft (-1.1%/yr); 588 active listings in the ZIP; 14 comparable units currently listed for rent nearby; rentals lingering (median 44d on market — plan ~5-8 weeks vacancy on turnover, expect pricing pressure); 57% of comp listings sitting > 30 days — soft ceiling on asking rent; solid renter incomes; 12,093 units permitted in Fort Bend County in 2024 (815 in 5+ unit buildings).
Forward outlook
- Local home prices are declining (-2.5%/yr); year-one equity from $2k of loan paydown is wiped out by about $6k of value loss. Plan a longer hold.
- Fort Bend County population projected at +75% by 2050 — long-run rental-demand tailwind backs the buy-and-hold thesis.
Negotiation context
- Only 9 days on market — expect competitive offers; lowballing is unlikely to land.
- 3 sale attempts since 2y ago; this cycle's ask has dropped $19k (7%) from the opening price — seller is motivated, your offer sets the floor, not the list.
Risks & watch-outs
- Watch-outs: property tax is 2.7% of price.
- Climate carrying-cost: severe wind risk, 99% chance of damaging wind over 30y; extreme-heat days projected 7→23/yr by 2055 (HVAC capex compounding) — expect insurance premiums to compound above CPI over the hold.
Questions for the listing agent
- What do current leases actually rent for vs. the listed asking? Can we see a recent rent roll and the last 12 months of T-12 income?
- Property tax is high relative to price — has the assessment been appealed recently, and will the sale trigger a re-assessment?
- Is there a deadline driving the sale (1031 exchange, divorce, estate, relocation)? That informs how much negotiation room exists.
- Schools are D-rated, which usually means shorter tenancies and higher turnover. Who's the typical renter profile here, and what's been the actual vacancy rate?
- Crime grade is F in this area — have there been break-ins, vandalism, or insurance claims at this property in the last 3 years? What carrier currently insures it and at what premium?
- The area grade is low — what's the realistic commute time and amenity access for the typical tenant pool here? Any planned neighborhood developments (good or bad) we should know about?
- What's the average days-on-market for RENTAL listings here right now (not sales)? A rising rental-DOM trend means longer vacancies and softer asking-rent achievability than the comps imply.
- What's the recent tenant-quality profile in this submarket — average credit score on applications, eviction rate, late-payment / NSF rate, and stable-employment percentage? A property-management company in the area should have these aggregated.
- How much new for-sale + rental construction is in the pipeline within 1–3 miles? Heavy new supply typically softens prices + rents 12–24 months out; constrained supply supports both.
Investment metrics
- 1% rule
- 0.90% ✗
- Cap rate
- 5.38%
- Cash-on-cash
- -3.25%
- DSCR
- 0.86
- GRM
- 9.3
CMA / ARV
- ARV (on-the-fly)
- $327,990
- Comps found
- 12
Show comp detail 12 sales within ~0.75 mi
| Address | Dist | Beds/Ba | Sqft | Sold | Price | $/sf | Match |
|---|---|---|---|---|---|---|---|
| 19134 Quarry Lakes Ln S | 0.26mi | 4/2.0 | 1,924 (+2%) | 1mo | $330,000 | $172 | 84 |
| 19031 Fulvetta Haven Way | 0.21mi | 3/2.0 (-1) | 1,898 (+1%) | 1mo | $330,000 | $174 | 84 |
| 7822 Heather Harvest Way | 0.28mi | 3/2.0 (-1) | 1,838 (-2%) | 2mo | $325,000 | $177 | 77 |
| 7518 Ramsgate Cliff Ln | 0.45mi | 4/2.0 | 1,867 (-1%) | 3mo | $332,000 | $178 | 75 |
| 18914 Whitehaven Bend Ln | 0.32mi | 3/2.0 (-1) | 1,799 (-5%) | 3mo | $320,000 | $178 | 70 |
| 19526 Sundance Edge Ct | 0.35mi | 4/2.0 | 2,057 (+9%) | 3mo | $335,000 | $163 | 66 |
| 7411 Rustic Chase Dr | 0.44mi | 3/2.0 (-1) | 2,097 (+11%) | 2mo | $304,999 | $145 | 54 |
| 19507 Cedar Cove Ct | 0.34mi | 3/2.0 (-1) | 2,158 (+14%) | 2mo | $360,000 | $167 | 53 |
| 8418 Terrace Valley Cir | 0.74mi | 3/2.0 (-1) | 1,780 (-6%) | 3mo | $385,000 | $216 | 49 |
| 8403 Victoria Springs Dr | 0.51mi | 3/2.0 (-1) | 1,636 (-13%) | 1mo | $335,000 | $205 | 48 |
| 7423 Garland Mist Ln | 0.74mi | 3/2.5 (-1) | 2,030 (+8%) | 3mo | $334,900 | $165 | 43 |
| 19327 Christine Crossing Dr | 0.66mi | 3/2.0 (-1) | 1,638 (-13%) | 3mo | $260,000 | $159 | 40 |
Match score weights: distance 35% · size 25% · config 20% · recency 20%. Top-matched comps best support the ARV.
Projected returns pro-forma
-2.47% appreciation · 0.0% rent growth · sell at horizon
- IRR
- -21.5%
- Equity multiple
- 0.24×
- Total profit
- $-51,269
- Equity at exit
- $41,499
- IRR
- -22.6%
- Equity multiple
- -0.17×
- Total profit
- $-78,666
- Equity at exit
- $30,700
Cash invested: $67,200 (down + closing). Projections, not guarantees.
Landlord ↔ Tenant lean methodology
- Overall (STATE)
- 87 Strongly Landlord-Friendly
- State Texas
- 87 Strongly Landlord-Friendly · R+5
- County
- — inherits STATE
- City
- — inherits STATE
ZIP-level market 77407
- Home prices YoY
- -1.1%
- Rents YoY
- -1.1%
- Active inventory
- 588
- Price-to-rent
- 9.3×
Monthly cashflow live
- Estimated rent
- $2,162 high interval (Pro) →
- Mortgage (P&I)
- −$1,259
- Tax from tax record
- −$531 /mo · $6,374/yr
- Insurance
- −$100
- HOA
- −$0
- Vacancy / Maint / Mgmt
- −$454
- Net cashflow
- $-182
Break-even live
UW: 25.0% down · 7.5% · 30yr · 1.5% tax · 5.0% vac · 8.0% maint · 8.0% mgmt
Financing live
Cash to close
- Down payment
- $60,000
- Closing costs
- $7,200
- Reserves months
- —
- Total cash needed
- —
Loan-product check · same deal, 3 products live
Conventional
25% down · 7.5% · 30yr
- Down + closing
- —
- Monthly P&I
- —
- Monthly cashflow
- —
- DSCR
- —
- Eligible?
- —
Personal DTI + credit; lowest rate.
DSCR
20% down · 8.5% · 30yr
- Down + closing
- —
- Monthly P&I
- —
- Monthly cashflow
- —
- DSCR
- —
- Eligible?
- —
No personal income docs; deal must DSCR.
Hard money
10% down · 12.0% · 12mo
- Down + closing
- —
- Monthly P&I
- —
- Monthly cashflow
- —
- DSCR
- —
- Eligible?
- —
Short-term bridge; refi at stabilization.
Rent comps 14 comps
| Address | Beds | Baths | Sqft | Rent | $/sqft | DOM | Units | Dist |
|---|---|---|---|---|---|---|---|---|
| 8019 Cliffside Terrace Ct Richmond, TX | 3.0 | 2.0 | 1867 | $2,199 | $1.18 | 44d | 1 | 0.48mi |
| 19221 Beechnut Rd Unit 3174 Richmond, TX | 3.0 | 2.0 | 1227 | $1,926 | $1.57 | 10d | 1 | 0.48mi |
| 19221 Beechnut Rd Unit 19254 Richmond, TX | 3.0 | 2.0 | 1227 | $1,774 | $1.45 | 44d | 1 | 0.48mi |
| 19221 Beechnut Rd Unit 3112 Richmond, TX | 3.0 | 2.0 | 1227 | $1,894 | $1.54 | 3d | 1 | 0.53mi |
| 8327 Bristol Summit Way Richmond, TX | 3.0 | 2.0 | 2371 | $1,700 | $0.72 | 1d | 1 | 0.68mi |
| 7018 Chapel Meadow Ln Richmond, TX | 3.0 | 2.0 | 2275 | $1,999 | $0.88 | 44d | 1 | 0.85mi |
| 18330 Arcola Bay Ln Richmond, TX | 4.0 | 3.0 | 1928 | $2,400 | $1.24 | 44d | 1 | 0.89mi |
| 6011 Baldwin Elm St Richmond, TX | 3.0 | 2.5 | 2163 | $2,300 | $1.06 | 13d | 1 | 0.93mi |
| 7206 Highland Chase Dr Richmond, TX | 4.0 | 2.0 | 2042 | $2,300 | $1.13 | 44d | 1 | 0.95mi |
| 5730 Baldwin Elm St Richmond, TX | 3.0 | 2.0 | 1717 | $2,100 | $1.22 | 44d | 1 | 1.11mi |
| 19930 Kendall Lake Dr Richmond, TX | 3.0 | 2.0 | 2144 | $2,300 | $1.07 | 44d | 1 | 1.15mi |
| 20115 Windsor Trace Ln Richmond, TX | 4.0 | 2.0 | 2307 | $2,300 | $1.00 | 22d | 1 | 1.24mi |
| 18313 Farm to Market Road 1093 #3174 Richmond, TX | 3.0 | 2.0 | 1350 | $2,241 | $1.66 | 3d | 1 | 1.40mi |
| 18313 Farm to Market Road 1093 #510 Richmond, TX | 3.0 | 2.0 | 1350 | $2,284 | $1.69 | 44d | 1 | 1.40mi |
Listing history 9 events
-
2026-06-18status $239,999 Pending 9 DOM
-
2026-06-18days on market $239,999 Active 9 DOM
-
2026-06-17days on market $239,999 Active 8 DOM
-
2026-06-16days on market $239,999 Active 7 DOM
-
2026-06-15price $239,999 Active 6 DOM
-
2026-06-15days on market $259,000 Active 6 DOM
-
2026-06-13days on market $259,000 Active 4 DOM
-
2026-06-10remarks 589-char remark
-
2026-06-10$259,000 Active 1 DOM
ⓘ Source: listings_history table (triggers on properties + properties_extension) + one-shot
backfill from property_details.listing_events for pre-trigger history.
Tax reassessment forecast TX · Resets to sale price
- Current annual tax
- $6,374 · $531/mo
- Projected year-2 tax
- $6,374 · $531/mo
- Expected delta
- $0/yr ($0/mo · 0.0%)
ⓘ Screening estimate from a state-policy table — verify with the county assessor before closing.
Climate risk First Street
- Flood 4/10 Moderate FEMA zone X (unshaded) · 22% chance over 30 yrs
- Wildfire 3/10 Moderate
- Heat 9/10 Extreme 7 d/yr ≥111°F today · 23 d/yr by 30 yrs out
- Wind 9/10 Extreme 99% chance of damaging wind over 30 yrs
- Air quality 2/10 Low 1 unhealthy d/yr today · 2 by 30 yrs out
Nearby sold comps map
Loading sold comps map…
Walkable amenities ~0.75 mi
Loading nearby amenities…
Taxation est. · year 1
- Rental income
- $25,942
- − Mortgage interest
- −$13,444
- − Property taxes
- −$6,374
- − Insurance
- −$1,200
- − Repairs & maintenance
- −$2,075
- − Management
- −$2,075
- − Depreciation
- −$6,982
- Taxable loss
- −$6,209
- Est. tax savings @ 24.0%
- +$1,490
- After-tax cash flow
- $-693/yr
For passive investors: Depreciation is non-cash, so a rental often shows a tax loss while cash-flowing — sheltering income. Rental losses are passive: they offset passive income freely, and up to $25,000/yr can offset ordinary (W-2) income if you actively participate and your MAGI is under $100k (phasing out to $0 by $150k); unused losses carry forward. On sale, claimed depreciation is recaptured at up to 25%, and gains may owe capital-gains tax (a 1031 exchange can defer both). Figures are a year-1 estimate at your 24.0% rate — not tax advice; consult a CPA.
Schools (NCES district)
- District
- Fort Bend ISD
- NCES district ID
- 4819650
- Math proficiency
- 44% ▼ -15.00%
- Reading proficiency
- 53% ▼ -4.00%
- Median HH income
- $82,360
- Composite
- 44.61/100
- National rank
- #2779
- State rank
- #140 of 826 in TX
Livability — Houston
- Score
- 74/100
- State rank
- #184
- US rank
- #4771
Category grades
Schools grade is shown separately in the Schools card above.
Census & demographics
- County
- Fort Bend County · 836,777 people
- City population
- 3,226,434
- Metro
- Houston-The Woodlands-Sugar Land, TX
- Population (ZIP)
- 88,319
- Household income
- $98,913
- Rent vs Own
- Severe rent burden
- 1838.0
Population outlook (Fort Bend County) Hauer SSP2
- Today (2025)
- 1,004,526 people
- By 2030
- 1,153,104 · +14.8%
- By 2040
- 1,453,718 · +44.7%
- By 2050
- 1,753,781 · +74.6%
- By 2075
- 2,455,772 · +144.5%
- By 2100
- 2,930,528 · +191.7%
Race, ethnicity, and origin ACS 2023
- Neighborhood character
- Highly diverse neighborhood (Simpson 0.75)
- Race & ethnicity
- Asian 33% Black 27% Hispanic / Latino 19% White 18% Two or more races 13%
- Hispanic origin (detail)
- Mexican 10% Puerto Rican 1%
- Common ancestry
- Arab 3% Swedish 2% Hungarian 1%
- Foreign-born
- 48% · Canada, Vietnam, China
- Languages at home
- 43% English-only · Other Indo-European 18% Spanish 14% Vietnamese 6%
Political lean MEDSL · Fort Bend
- 2024 margin
- Toss-up / Even · D 49.5% · R 47.9% · Other 2.6%
- 2008→2024 swing
- +4.0pp toward D · 2008: -2.4pp · 2024: 1.6pp
- All cycles
- 2024: D+1.6 2020: D+10.6 2016: D+6.6 2012: R+6.8 2008: R+2.4
Not yet ingested
- Civics
- —
Market trends
- HPI YoY
- ▼ -2.47%
- Current HPI
- 220.1542
- Rent YoY
- ▼ -1.09%
- Metro
- Houston-The Woodlands-Sugar Land, TX
- State GDP YoY
- ▲ 3.95%
- F500 in state
- 110
Industry mix (Fortune 500 HQ in TX)
| Industry | F500 HQs | Revenue |
|---|---|---|
| Energy | 16 | $1,198B |
|
||
| Technology | 5 | $198B |
|
||
| Engineering / Construction | 4 | $72B |
|
||
| Energy Services | 3 | $60B |
|
||
| Utilities | 3 | $41B |
|
||
| Healthcare | 2 | $330B |
|
||
Price history
-21.5% since first listed7 events — show timeline
- 2026-06-09 Listed $259,000 HARMLS
- 2025-06-03 Listing Removed — HARMLS
- 2025-03-18 Relisted — HARMLS
- 2025-03-13 Pending — HARMLS
- 2025-02-20 Price Changed $300,000 HARMLS
- 2025-02-10 Price Changed $319,900 HARMLS
- 2024-11-18 Listed $329,900 HARMLS
Property tax history
+1.9%/yrLatest (2025): $6,374 · +13.0% YoY. Source: county tax records.
Cash-flow waterfall
monthlySold comps — $/sqft
last 12 mo · ≤1 miLoading sold comps…