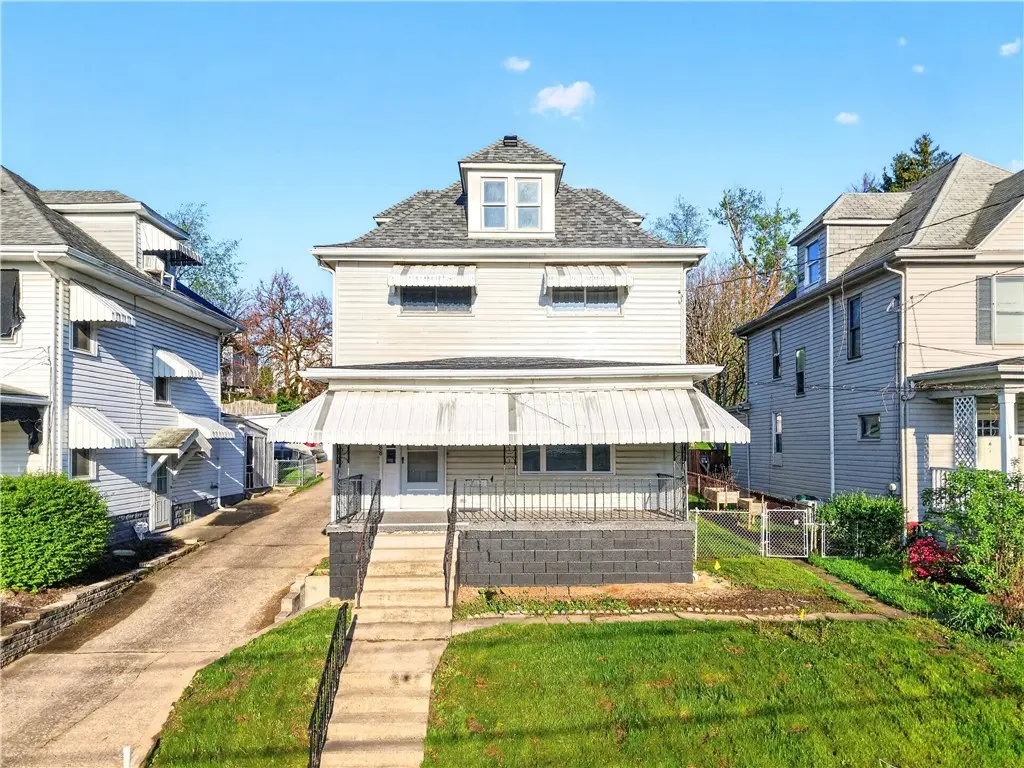
88 Byrer Ave · Uniontown, PA
Flood risk 1/10 · Minimal
- FEMA flood zone
- X (unshaded)
- Chance of flooding over 30 yrs
- 0.0%
- Est. flood insurance / yr
- $473 – $860
Fire risk 1/10 · Minimal
- Est. fire insurance / yr
- $511 – $949
Heat risk 4/10 · Minor
- Hot days now (above 96°F)
- 7 days/yr
- Hot days in 30 yrs
- 19 days/yr
Wind risk 2/10 · Minimal
- Chance of severe wind over 30 yrs
- —
Air-quality risk 2/10 · Minimal
- Unhealthy air days now
- 1 days/yr
- Unhealthy air days in 30 yrs
- 2 days/yr
Risk factors via First Street. Map © Google.
Why this score? — see what drove the C- grade
The composite is a weighted blend of 9 inputs, each scored 0–100. Each bar is that input's sub-score; the figure is the points it added to the 100-point composite (weight × sub-score).
- Cash flow +17.3/30.0
- ARV discount +14.3/15.0
- DSCR +5.4/10.0
- 1% rule +4.9/10.0
- Livability +3.5/5.0
- Schools +3.1/10.0
- Rent growth +2.5/5.0
- Condition / age +2.5/5.0
- Appreciation +0.9/10.0
$165,000
🖨 Deal sheet (PDF) 📄 Offer letter ✓ Due diligence
Listing remarks
Welcome to this spacious and move-in ready 4-bedroom, 1.5-bath home in Uniontown—where everything is NEW, NEW, NEW! Major updates include a new roof (2025), new French drains with basement waterproofing, new central A/C, new 200-amp electrical service, new hot water tank, new plumbing stack, and all new appliances. The beautifully renovated kitchen and bathrooms, along with new luxury vinyl plank flooring, new carpet, and fresh paint throughout, make this home truly turnkey. Enjoy relaxing on the incredible covered front porch or unwind on the covered back porch—perfect for those warm summer days. A great detached garage provides additional storage and parking, while the fenced-
Key facts
- New french drains
- New hot water tank
- New plumbing stack
Tags
Property features AI
Exterior
- Parking: Detached garage with garage door opener; Total 2 parking spaces
- Utilities: Public water; Public sewer
- Home design: 2 stories; Composition roof; Aluminum siding
- Construction: Aluminum siding construction; Composition roof
- Exterior features: Lot approximately 42 x 142; Resale condition
Interior
- Kitchen: Kitchen on main level; Refrigerator; Stove; Dishwasher; Some electric appliances
- Bedrooms: Upper-level bedrooms (three): approx. 11x12, 11x11, 10x10; Additional bedroom/bonus room and entry on main level
- Flooring: Carpet; Laminate
- Bathrooms: 1 full bathroom; 1 half bathroom
- Heating & cooling: Forced air gas heating; Central air conditioning
- Interior features: Pantry; Unfinished walk-up basement; Decorative fireplace (1)
- Laundry & utility: Laundry room in basement
Neighborhood map
What this means for you Summary
Snapshot
- This is a 4-bed/1.5-bath single-family listed at $165k.
Deal economics
- At list price, monthly cash flow is $122 ($1k/yr) — positive.
- The deal already cash-flows at list — no discount required.
- To meet the 1% rule (rent ≥ 1% of price), the offer needs to be $163k (1.2% below list).
- Recommended offer: $160k (3.0% below list) — sets the bar for market timing.
Location & tenants
- Location reads 70/100 on livability (#750 in PA) — a middle-class / working-renter tenant base. Strengths: cost of living A+, health & safety A+, housing A; Watch: amenities D+, crime F, commute F.
- Uniontown Area SD (suburban): math 27% / reading 49% proficiency, ranked #392 of 539 in PA (top 73%) — families likely to look elsewhere, expect single-tenant / working-renter base with shorter leases.
- Zoned schools: Ben Franklin Sch (math 19% / reading 51%, grade F, #1,042 of 1,518 statewide, top 69%, 517 students, 90% FRL); Uniontown Area Shs (math 77%, 668 students, 74% FRL) — zoned schools average 82% FRL vs 56% district-wide (26 pts higher); higher-poverty schools than district average — tighter screening recommended.
- Market conditions: 147 active listings in the ZIP; 3 comparable units currently listed for rent nearby; rentals lingering (median 46d on market — plan ~5-8 weeks vacancy on turnover, expect pricing pressure); 100% of comp listings sitting > 30 days — soft ceiling on asking rent; 201 units permitted in Fayette County in 2024 (10 in 5+ unit buildings).
Forward outlook
- Local home prices are declining (-3.0%/yr); year-one equity from $1k of loan paydown is wiped out by about $5k of value loss. Plan a longer hold.
- Fayette County population projected at -19% by 2050 — secular population decline; favor cash flow + early exit over multi-decade hold.
Negotiation context
- It's been on market 56 days — a 3% lower offer ($160k) is reasonable based on typical stale-listing flexibility.
- 2 sale attempts; this cycle's ask has dropped $34k (17%) from the opening price — seller is motivated, your offer sets the floor, not the list.
- Current owner paid $60k; list at $165k implies a 175% gain — meaningful room to come down on a strong offer.
Risks & watch-outs
- Watch-outs: built in 1930 — expect roof / HVAC / electrical / plumbing capex.
Questions for the listing agent
- It's been on market 56 days. Have you received any prior offers? Is the seller open to a 3% concession, seller financing, or rate buy-down credit?
- Built in 1930 — when were the roof, HVAC, electrical panel, plumbing, and water heater last replaced?
- Is there a deadline driving the sale (1031 exchange, divorce, estate, relocation)? That informs how much negotiation room exists.
- Crime grade is F in this area — have there been break-ins, vandalism, or insurance claims at this property in the last 3 years? What carrier currently insures it and at what premium?
- What's the average days-on-market for RENTAL listings here right now (not sales)? A rising rental-DOM trend means longer vacancies and softer asking-rent achievability than the comps imply.
- What's the recent tenant-quality profile in this submarket — average credit score on applications, eviction rate, late-payment / NSF rate, and stable-employment percentage? A property-management company in the area should have these aggregated.
- How much new for-sale + rental construction is in the pipeline within 1–3 miles? Heavy new supply typically softens prices + rents 12–24 months out; constrained supply supports both.
Investment metrics
- 1% rule
- 0.99% ✗
- Cap rate
- 7.18%
- Cash-on-cash
- 3.16%
- DSCR
- 1.14
- GRM
- 8.4
CMA / ARV
- ARV (median comp)
- $194,155
- List price
- $165,000
- Delta
- -15.02%
- Verdict
- UNDERPRICED
- Comps
- 20 within 1.0 mi
Show comp detail 7 sales within ~0.75 mi
| Address | Dist | Beds/Ba | Sqft | Sold | Price | $/sf | Match |
|---|---|---|---|---|---|---|---|
| 105 Patty Dr | 0.29mi | 3/2.0 (-1) | 2,198 (+4%) | 6mo | $270,000 | $123 | 68 |
| 59 Lebanon Ave | 0.54mi | 4/2.0 | 2,098 (-1%) | 10mo | $159,900 | $76 | 64 |
| 51 Francis St | 0.48mi | 3/3.0 (-1) | 2,124 (+1%) | 14mo | $280,000 | $132 | 54 |
| 14 Leith St | 0.49mi | 4/2.0 | 1,848 (-12%) | 10mo | $40,000 | $22 | 46 |
| 317 Derrick | 0.57mi | 3/2.0 (-1) | 2,015 (-5%) | 18mo | $185,000 | $92 | 43 |
| 158 Clarendon Ave | 0.49mi | 3/2.5 (-1) | 1,800 (-15%) | 2mo | $120,000 | $67 | 42 |
| 122 Shaffer St | 0.68mi | 4/1.5 | 1,832 (-13%) | 7mo | $75,000 | $41 | 40 |
Match score weights: distance 35% · size 25% · config 20% · recency 20%. Top-matched comps best support the ARV.
Projected returns pro-forma
-3.0% appreciation · 3.0% rent growth · sell at horizon
- IRR
- -11.3%
- Equity multiple
- 0.59×
- Total profit
- $-18,946
- Equity at exit
- $24,602
- IRR
- -2.0%
- Equity multiple
- 0.86×
- Total profit
- $-6,353
- Equity at exit
- $14,266
Cash invested: $46,200 (down + closing). Projections, not guarantees.
Landlord ↔ Tenant lean methodology
- Overall (STATE)
- 62 Landlord-Friendly
- State Pennsylvania
- 62 Landlord-Friendly · EVEN
- County
- — inherits STATE
- City
- — inherits STATE
ZIP-level market 15401
- Home prices YoY
- -3.8%
- Active inventory
- 147
- Price-to-rent
- 8.4×
Monthly cashflow live
- Estimated rent
- $1,630 medium interval (Pro) →
- Mortgage (P&I)
- −$865
- Tax from tax record
- −$232 /mo · $2,786/yr
- Insurance
- −$69
- HOA
- −$0
- Vacancy / Maint / Mgmt
- −$342
- Net cashflow
- $122
Break-even live
Sensitivity live
| Price | -10% $215 | -5% $168 | +0% $122 | +5% $75 | +10% $28 |
|---|---|---|---|---|---|
| Rent | -10% $-7 | -5% $57 | +0% $122 | +5% $186 | +10% $250 |
| Rate | -1.0pp $205 | -0.5pp $164 | base $122 | +0.5pp $79 | +1.0pp $35 |
UW: 25.0% down · 7.5% · 30yr · 1.5% tax · 5.0% vac · 8.0% maint · 8.0% mgmt
Financing live
Cash to close
- Down payment
- $41,250
- Closing costs
- $4,950
- Reserves months
- —
- Total cash needed
- —
Loan-product check · same deal, 3 products live
Conventional
25% down · 7.5% · 30yr
- Down + closing
- —
- Monthly P&I
- —
- Monthly cashflow
- —
- DSCR
- —
- Eligible?
- —
Personal DTI + credit; lowest rate.
DSCR
20% down · 8.5% · 30yr
- Down + closing
- —
- Monthly P&I
- —
- Monthly cashflow
- —
- DSCR
- —
- Eligible?
- —
No personal income docs; deal must DSCR.
Hard money
10% down · 12.0% · 12mo
- Down + closing
- —
- Monthly P&I
- —
- Monthly cashflow
- —
- DSCR
- —
- Eligible?
- —
Short-term bridge; refi at stabilization.
Rent comps 3 comps
| Address | Beds | Baths | Sqft | Rent | $/sqft | DOM | Units | Dist |
|---|---|---|---|---|---|---|---|---|
| 14 Leith St Uniontown, PA | 4.0 | 2.0 | 1848 | $1,600 | $0.87 | 46d | 1 | 0.50mi |
| 41 E Kerr St Uniontown, PA | 5.0 | 2.0 | 2915 | $1,100 | $0.38 | 46d | 1 | 1.22mi |
| 189 Wiggins Ln Uniontown, PA | 3.0 | 2.0 | 1663 | $2,300 | $1.38 | 46d | 1 | 1.43mi |
Listing history 24 events
-
2026-06-22days on market $165,000 Active 56 DOM
-
2026-06-21days on market $165,000 Active 55 DOM
-
2026-06-21days on market $165,000 Active 54 DOM
-
2026-06-18days on market $165,000 Active 52 DOM
-
2026-06-17days on market $165,000 Active 51 DOM
-
2026-06-16days on market $165,000 Active 50 DOM
-
2026-06-15pricedays on market $165,000 Active 49 DOM
-
2026-06-13days on market $175,000 Active 47 DOM
-
2026-06-12days on market $175,000 Active 46 DOM
-
2026-06-09days on market $175,000 Active 43 DOM
-
2026-06-08days on market $175,000 Active 42 DOM
-
2026-06-08days on market $175,000 Active 41 DOM
-
2026-06-07days on market $175,000 Active 40 DOM
-
2026-06-04days on market $175,000 Active 37 DOM
-
2026-06-02days on market $175,000 Active 36 DOM
-
2026-06-01days on market $175,000 Active 35 DOM
-
2026-05-31days on market $175,000 Active 34 DOM
-
2026-05-10price $185,000 1005-char remark
-
2026-05-09price $185,000
-
2026-04-27$199,000 Active 1005-char remark
-
2026-04-08price $199,000
-
2026-03-09price $210,000
-
2026-02-13$220,000 Active
-
2025-06-18soldstatus $60,000
ⓘ Source: listings_history table (triggers on properties + properties_extension) + one-shot
backfill from property_details.listing_events for pre-trigger history.
Tax reassessment forecast PA · Partial reset (capped growth)
- Current annual tax
- $2,786 · $232/mo
- Projected year-2 tax
- $2,786 · $232/mo
- Expected delta
- $0/yr ($0/mo · 0.0%)
ⓘ Screening estimate from a state-policy table — verify with the county assessor before closing.
Climate risk First Street
- Flood 1/10 Low FEMA zone X (unshaded) · 0% chance over 30 yrs
- Wildfire 1/10 Low
- Heat 4/10 Moderate 7 d/yr ≥96°F today · 19 d/yr by 30 yrs out
- Wind 2/10 Low
- Air quality 2/10 Low 1 unhealthy d/yr today · 2 by 30 yrs out
Nearby sold comps map
Loading sold comps map…
Walkable amenities ~0.75 mi
Loading nearby amenities…
Taxation est. · year 1
- Rental income
- $19,563
- − Mortgage interest
- −$9,243
- − Property taxes
- −$2,786
- − Insurance
- −$825
- − Repairs & maintenance
- −$1,565
- − Management
- −$1,565
- − Depreciation
- −$4,800
- Taxable loss
- −$1,221
- Est. tax savings @ 24.0%
- +$293
- After-tax cash flow
- $1,753/yr
For passive investors: Depreciation is non-cash, so a rental often shows a tax loss while cash-flowing — sheltering income. Rental losses are passive: they offset passive income freely, and up to $25,000/yr can offset ordinary (W-2) income if you actively participate and your MAGI is under $100k (phasing out to $0 by $150k); unused losses carry forward. On sale, claimed depreciation is recaptured at up to 25%, and gains may owe capital-gains tax (a 1031 exchange can defer both). Figures are a year-1 estimate at your 24.0% rate — not tax advice; consult a CPA.
Schools (NCES district)
- District
- Uniontown Area SD
- NCES district ID
- 4224150
- Math proficiency
- 27% ▼ -8.00%
- Reading proficiency
- 49% ▼ -6.00%
- Median HH income
- $36,744
- Composite
- 31.48/100
- National rank
- #5977
- State rank
- #392 of 539 in PA
Livability — Uniontown
- Score
- 70/100
- State rank
- #750
- US rank
- #7482
Category grades
Schools grade is shown separately in the Schools card above.
Census & demographics
- Census place
- Uniontown, PA
- Population (ZIP)
- 30,230
Population outlook (Fayette County) Hauer SSP2
- Today (2025)
- 127,561 people
- By 2030
- 123,206 · -3.4%
- By 2040
- 113,232 · -11.2%
- By 2050
- 103,468 · -18.9%
- By 2075
- 83,185 · -34.8%
- By 2100
- 62,384 · -51.1%
Race, ethnicity, and origin ACS 2023
- Neighborhood character
- Predominantly White (86%)
- Race & ethnicity
- White 86% Black 7% Two or more races 5% Hispanic / Latino 1%
- Common ancestry
- Romanian 8% Scotch-Irish 2% Iranian 1%
- Foreign-born
- 2% · Canada
- Languages at home
- 97% English-only · Spanish 1% Arabic 1%
Political lean MEDSL · Fayette
- 2024 margin
- Solid R (+37.9) · D 30.8% · R 68.7%
- 2008→2024 swing
- -37.5pp toward R · 2008: -0.4pp · 2024: -37.9pp
- All cycles
- 2024: R+37.9 2020: R+33.5 2016: R+31.0 2012: R+8.3 2008: R+0.4
Not yet ingested
- Civics
- —
Market trends
- HPI YoY
- ▼ -8.29%
- Current HPI
- 210.1257
- Rent YoY
- —
- Metro
- —
- State GDP YoY
- ▲ 1.68%
- F500 in state
- 34
Industry mix (Fortune 500 HQ in PA)
| Industry | F500 HQs | Revenue |
|---|---|---|
| Healthcare | 2 | $309B |
|
||
| Insurance | 2 | $27B |
|
||
| Telecommunications / Media | 1 | $124B |
|
||
| Industrial Distribution | 1 | $22B |
|
||
| Financial Services | 1 | $20B |
|
||
| Chemicals / Materials | 1 | $18B |
|
||
Price history
+175.0% since first listed9 events — show timeline
- 2026-06-15 Price Changed $165,000 West Penn MLS
- 2026-05-21 Price Changed $175,000 West Penn MLS
- 2026-05-10 Price Changed $185,000 West Penn MLS
- 2026-05-09 Price Changed $185,000 West Penn MLS
- 2026-04-27 Listed $199,000 West Penn MLS
- 2026-04-08 Price Changed $199,000 West Penn MLS
- 2026-03-09 Price Changed $210,000 West Penn MLS
- 2026-02-13 Listed $220,000 West Penn MLS
- 2025-06-18 Sold (Public Records) $60,000 Public Records
Property tax history
+2.3%/yrLatest (2026): $2,786 · +2.4% YoY. Source: county tax records.
Cash-flow waterfall
monthlySold comps — $/sqft
last 12 mo · ≤1 miLoading sold comps…