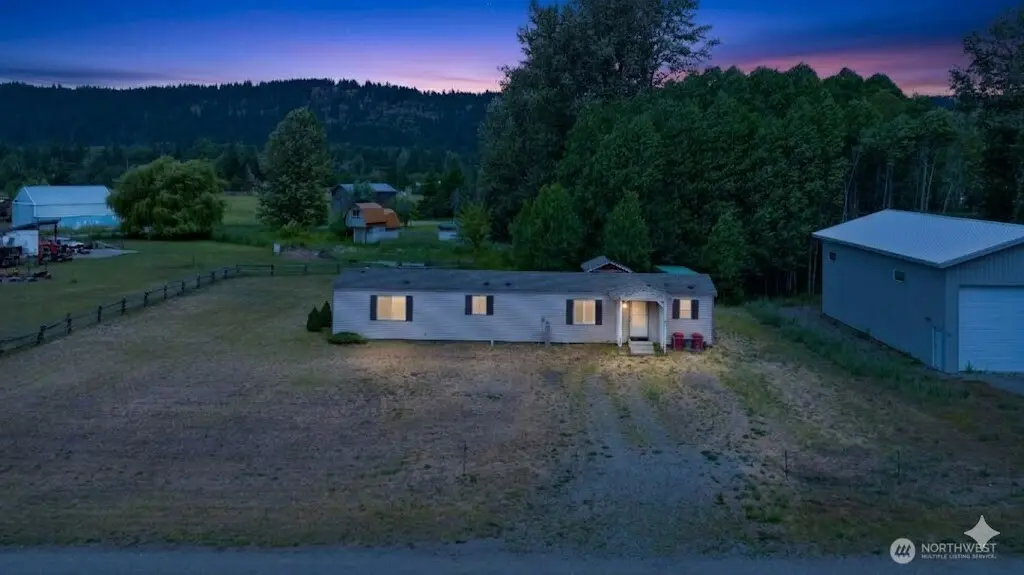
81 Laurel Ln · Ronald, WA
Flood risk 1/10 · Minimal
- FEMA flood zone
- X (unshaded)
- Chance of flooding over 30 yrs
- 0.0%
- Est. flood insurance / yr
- $507 – $1,088
Fire risk 7/10 · Major
- Est. fire insurance / yr
- $604 – $1,122
Heat risk 2/10 · Minimal
- Hot days now (above 88°F)
- 8 days/yr
- Hot days in 30 yrs
- 17 days/yr
Wind risk 1/10 · Minimal
- Chance of severe wind over 30 yrs
- —
Air-quality risk 10/10 · Severe
- Unhealthy air days now
- 20 days/yr
- Unhealthy air days in 30 yrs
- 22 days/yr
Risk factors via First Street. Map © Google.
Why this score? — see what drove the C- grade
The composite is a weighted blend of 9 inputs, each scored 0–100. Each bar is that input's sub-score; the figure is the points it added to the 100-point composite (weight × sub-score).
- Cash flow +22.3/30.0
- ARV discount +7.5/15.0
- DSCR +7.2/10.0
- 1% rule +4.9/10.0
- Schools +4.7/10.0
- Rent growth +2.5/5.0
- Condition / age +2.5/5.0
- Livability +2.4/5.0
- Appreciation +0.0/10.0
$289,000
🖨 Deal sheet 📄 Offer letter ✓ Due diligence
Listing remarks
* RECENTLY REDUCED-BEST VALUE IN THE AREA. Discover the perfect blend of Mountain serenity and outdoor adventure with this charming 2-bedroom, 2-bathroom manufactured home. Nestled on a spacious half-acre lot, this 2003-built residence offers the quiet escape you've been dreaming of, with all the perks of the Cascade lifestyle right at your doorstep. Enjoy a sprawling, partially fenced 0.5 acre lot perfect for weekend BBQ's, gardening, or letting the dogs roam. Conveniently located only 10 minutes from Suncadia Resort, giving you easy access to world-class golfing, upscale dining, and spa amenities. Whether it's hiking, fishing, snowmobiling, biking, you are positioned in the heart of Washi
Key facts
- Partially fenced lot
- Spa amenities
- Upscale dining
Tags
Neighborhood map
What this means for you Summary
Snapshot
- This is a 2-bed/2.0-bath manufactured listed at $289k.
Deal economics
- At list price, monthly cash flow is $478 ($6k/yr) — positive.
- The deal already cash-flows at list — no discount required.
- To meet the 1% rule (rent ≥ 1% of price), the offer needs to be $288k (0.5% below list).
- Recommended offer: $263k (9.0% below list) — sets the bar for market timing.
Location & tenants
- Location reads 48/100 on livability (#583 in WA) — a working-class tenant base; expect higher turnover. Strengths: crime A, cost of living B+; Watch: health & safety C-, schools D+, amenities F.
- Cle Elum-Roslyn School District (town): math 45% / reading 60% proficiency, ranked #126 of 291 in WA (top 43%) — acceptable for families but not a draw, mixed tenant base, ~2y average lease.
- Market conditions: 492 active listings in the ZIP; 1 comparable units currently listed for rent nearby; 433 units permitted in Kittitas County in 2024 (23 in 5+ unit buildings).
Forward outlook
- Local home prices are declining (-3.0%/yr); year-one equity from $2k of loan paydown is wiped out by about $9k of value loss. Plan a longer hold.
- Kittitas County population projected at +30% by 2050 — long-run rental-demand tailwind backs the buy-and-hold thesis.
Negotiation context
- It's been on market 95 days — a 9% lower offer ($263k) is reasonable based on typical stale-listing flexibility.
- Current owner paid $35k; list at $289k implies a 726% gain — meaningful room to come down on a strong offer.
Risks & watch-outs
- Climate carrying-cost: major wildfire risk — expect insurance premiums to compound above CPI over the hold.
Questions for the listing agent
- It's been on market 95 days. Have you received any prior offers? Is the seller open to a 9% concession, seller financing, or rate buy-down credit?
- Why hasn't it sold? Are there any deal-killer items the seller is aware of (foundation, flood, title, zoning, code violations)?
- Is there a deadline driving the sale (1031 exchange, divorce, estate, relocation)? That informs how much negotiation room exists.
- Schools are D-rated, which usually means shorter tenancies and higher turnover. Who's the typical renter profile here, and what's been the actual vacancy rate?
- What's the average days-on-market for RENTAL listings here right now (not sales)? A rising rental-DOM trend means longer vacancies and softer asking-rent achievability than the comps imply.
- What's the recent tenant-quality profile in this submarket — average credit score on applications, eviction rate, late-payment / NSF rate, and stable-employment percentage? A property-management company in the area should have these aggregated.
- How much new for-sale + rental construction is in the pipeline within 1–3 miles? Heavy new supply typically softens prices + rents 12–24 months out; constrained supply supports both.
Investment metrics
- 1% rule
- 0.99% ✗
- Cap rate
- 8.28%
- Cash-on-cash
- 7.08%
- DSCR
- 1.32
- GRM
- 8.4
CMA / ARV
No comps found within radius.
Projected returns pro-forma
-3.0% appreciation · 3.0% rent growth · sell at horizon
- IRR
- -5.5%
- Equity multiple
- 0.80×
- Total profit
- $-16,487
- Equity at exit
- $43,091
- IRR
- 4.2%
- Equity multiple
- 1.30×
- Total profit
- $24,489
- Equity at exit
- $24,987
Cash invested: $80,920 (down + closing). Projections, not guarantees.
Landlord ↔ Tenant lean methodology
- Overall (STATE)
- 28 Tenant-Leaning
- State Washington
- 28 Tenant-Leaning · D+8
- County
- — inherits STATE
- City
- — inherits STATE
ZIP-level market 98922
- Home prices YoY
- -32.3%
- Active inventory
- 492
- Price-to-rent
- 8.4×
Monthly cashflow live
- Estimated rent
- $2,875 medium interval (Pro) →
- Mortgage (P&I)
- −$1,516
- Tax from tax record
- −$158 /mo · $1,891/yr
- Insurance
- −$120
- HOA
- −$0
- Vacancy / Maint / Mgmt
- −$604
- Net cashflow
- $478
Break-even live
UW: 25.0% down · 7.5% · 30yr · 1.5% tax · 5.0% vac · 8.0% maint · 8.0% mgmt
Financing live
Cash to close
- Down payment
- $72,250
- Closing costs
- $8,670
- Reserves months
- —
- Total cash needed
- —
Loan-product check · same deal, 3 products live
Conventional
25% down · 7.5% · 30yr
- Down + closing
- —
- Monthly P&I
- —
- Monthly cashflow
- —
- DSCR
- —
- Eligible?
- —
Personal DTI + credit; lowest rate.
DSCR
20% down · 8.5% · 30yr
- Down + closing
- —
- Monthly P&I
- —
- Monthly cashflow
- —
- DSCR
- —
- Eligible?
- —
No personal income docs; deal must DSCR.
Hard money
10% down · 12.0% · 12mo
- Down + closing
- —
- Monthly P&I
- —
- Monthly cashflow
- —
- DSCR
- —
- Eligible?
- —
Short-term bridge; refi at stabilization.
Rent comps 1 comps
| Address | Beds | Baths | Sqft | Rent | $/sqft | DOM | Units | Dist |
|---|---|---|---|---|---|---|---|---|
| Hundley Rd Cle Elum, WA | 2.0 | 2.0 | 1200 | $2,875 | $2.40 | 12d | 1 | 0.99mi |
Listing history 19 events
-
2026-06-19days on market $289,000 Active 95 DOM
-
2026-06-18days on market $289,000 Active 94 DOM
-
2026-06-17days on market $289,000 Active 93 DOM
-
2026-06-16days on market $289,000 Active 92 DOM
-
2026-06-15days on market $289,000 Active 91 DOM
-
2026-06-14days on market $289,000 Active 89 DOM
-
2026-06-12days on market $289,000 Active 88 DOM
-
2026-06-09days on market $289,000 Active 85 DOM
-
2026-06-08days on market $289,000 Active 84 DOM
-
2026-06-07days on market $289,000 Active 83 DOM
-
2026-06-05days on market $289,000 Active 80 DOM
-
2026-06-03days on market $289,000 Active 79 DOM
-
2026-06-02days on market $289,000 Active 78 DOM
-
2026-06-01days on market $289,000 Active 77 DOM
-
2026-05-31days on market $289,000 Active 76 DOM
-
2026-05-30days on market $289,000 Active 75 DOM
-
2026-04-29price $289,000
-
2026-03-16$299,000 Active
-
2002-06-04soldstatus $35,000
ⓘ Source: listings_history table (triggers on properties + properties_extension) + one-shot
backfill from property_details.listing_events for pre-trigger history.
Tax reassessment forecast WA · Resets to sale price
- Current annual tax
- $1,891 · $158/mo
- Projected year-2 tax
- $2,832 · $236/mo
- Expected delta
- +$941/yr (+$78/mo · 49.8%)
ⓘ Screening estimate from a state-policy table — verify with the county assessor before closing.
Climate risk First Street
- Flood 1/10 Low FEMA zone X (unshaded) · 0% chance over 30 yrs
- Wildfire 7/10 Severe
- Heat 2/10 Low 8 d/yr ≥88°F today · 17 d/yr by 30 yrs out
- Wind 1/10 Low
- Air quality 10/10 Extreme 20 unhealthy d/yr today · 22 by 30 yrs out
Nearby sold comps map
Loading sold comps map…
Walkable amenities ~0.75 mi
Loading nearby amenities…
Taxation est. · year 1
- Rental income
- $34,500
- − Mortgage interest
- −$16,188
- − Property taxes
- −$1,891
- − Insurance
- −$1,445
- − Repairs & maintenance
- −$2,760
- − Management
- −$2,760
- − Depreciation
- −$8,407
- Taxable income
- $1,048
- Est. tax owed @ 24.0%
- −$252
- After-tax cash flow
- $5,481/yr
For passive investors: Depreciation is non-cash, so a rental often shows a tax loss while cash-flowing — sheltering income. Rental losses are passive: they offset passive income freely, and up to $25,000/yr can offset ordinary (W-2) income if you actively participate and your MAGI is under $100k (phasing out to $0 by $150k); unused losses carry forward. On sale, claimed depreciation is recaptured at up to 25%, and gains may owe capital-gains tax (a 1031 exchange can defer both). Figures are a year-1 estimate at your 24.0% rate — not tax advice; consult a CPA.
Schools (NCES district)
- District
- Cle Elum-Roslyn School District
- NCES district ID
- 5301350
- Math proficiency
- 45% ▼ -6.00%
- Reading proficiency
- 60% ▲ 1.00%
- Median HH income
- $49,561
- Composite
- 46.7/100
- National rank
- #5248
- State rank
- #126 of 291 in WA
Livability — Ronald
- Score
- 48/100
- State rank
- #583
- US rank
- #26012
Category grades
Schools grade is shown separately in the Schools card above.
Census & demographics
- Population (ZIP)
- 7,915
Population outlook (Kittitas County) Hauer SSP2
- Today (2025)
- 48,605 people
- By 2030
- 51,628 · +6.2%
- By 2040
- 57,361 · +18.0%
- By 2050
- 63,241 · +30.1%
- By 2075
- 79,310 · +63.2%
- By 2100
- 94,769 · +95.0%
Race, ethnicity, and origin ACS 2023
- Neighborhood character
- Predominantly White (81%)
- Race & ethnicity
- White 81% Two or more races 10% Hispanic / Latino 7%
- Hispanic origin (detail)
- Mexican 7%
- Common ancestry
- Italian 13% Lithuanian 5% Portuguese 4%
- Foreign-born
- 1% · Canada
- Languages at home
- 97% English-only · Spanish 2%
Political lean MEDSL · Kittitas
- 2024 margin
- R (+14.6) · D 41.1% · R 55.7% · Other 3.2%
- 2008→2024 swing
- -6.5pp toward R · 2008: -8.1pp · 2024: -14.6pp
- All cycles
- 2024: R+14.6 2020: R+10.2 2016: R+14.5 2012: R+12.6 2008: R+8.1
Not yet ingested
- Civics
- —
Market trends
- HPI YoY
- ▼ -105.04%
- Current HPI
- 219.8787
- Rent YoY
- —
- Metro
- —
- State GDP YoY
- ▲ 4.65%
- F500 in state
- 22
Industry mix (Fortune 500 HQ in WA)
| Industry | F500 HQs | Revenue |
|---|---|---|
| Retail | 2 | $269B |
|
||
| Technology / Retail | 1 | $638B |
|
||
| Technology | 1 | $245B |
|
||
| Telecommunications | 1 | $38B |
|
||
| Food / Beverage | 1 | $36B |
|
||
| Automotive / Trucks | 1 | $34B |
|
||
Price history
+725.7% since first listed3 events — show timeline
- 2026-04-29 Price Changed $289,000 NWMLS as Distributed by MLS Grid
- 2026-03-16 Listed $299,000 NWMLS as Distributed by MLS Grid
- 2002-06-04 Sold (Public Records) $35,000 Public Records
Property tax history
+18.7%/yrLatest (2026): $1,891 · +4.3% YoY. Source: county tax records.
Cash-flow waterfall
monthlySold comps — $/sqft
last 12 mo · ≤1 miLoading sold comps…