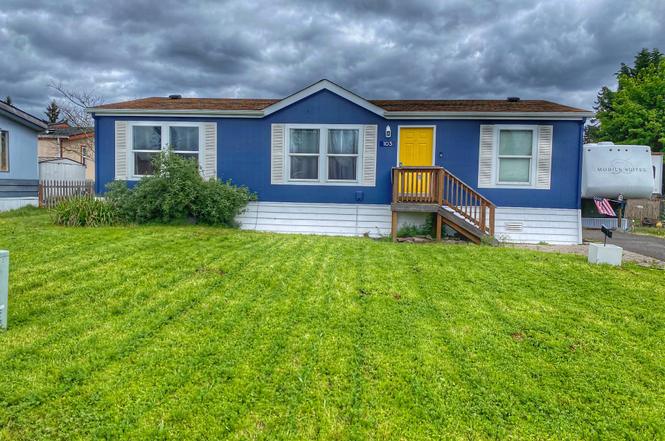
3700 X St #103 · Vancouver, WA
Flood risk No data
- FEMA flood zone
- —
- Chance of flooding over 30 yrs
- —
- Est. flood insurance / yr
- —
Fire risk No data
- Est. fire insurance / yr
- —
Heat risk No data
- Hot days now (above threshold)
- —
- Hot days in 30 yrs
- —
Wind risk No data
- Chance of severe wind over 30 yrs
- —
Air-quality risk No data
- Unhealthy air days now
- —
- Unhealthy air days in 30 yrs
- —
Risk factors via First Street. Map © Google.
Why this score? — see what drove the C+ grade
The composite is a weighted blend of 9 inputs, each scored 0–100. Each bar is that input's sub-score; the figure is the points it added to the 100-point composite (weight × sub-score).
- Cash flow +28.9/30.0
- DSCR +10.0/10.0
- 1% rule +7.7/10.0
- ARV discount +4.3/15.0
- Schools +4.3/10.0
- Livability +4.1/5.0
- Rent growth +2.8/5.0
- Condition / age +2.5/5.0
- Appreciation +0.0/10.0
$145,000
🖨 Deal sheet 📄 Offer letter ✓ Due diligence
Listing remarks MLS
Just like new 2008 Palm Harbor.Low HOA dues $340 includes water, sewer, garbage.Front & back parking off street.Lr yard with storage shed.Tinted energy efficent windows with blinds.Vaulted throughout.Great open floorplan with eating bar,pantry & lots of cabinets.Large master with walk-in closet.All appliances stay!AC ready. Like new home at a great price!OPEN HOUSE 3/21 1-4PM.
Key facts
- Built 2008
- Listed 60 days
Neighborhood map
What this means for you Summary
Snapshot
- This is a 3-bed/2.0-bath manufactured listed at $145k.
Deal economics
- At list price, monthly cash flow is $492 ($6k/yr) — positive.
- The deal already cash-flows at list — no discount required.
- Meets the 1% rule at list price ($2k rent vs $145k).
- Recommended offer: $141k (3.0% below list) — sets the bar for market timing.
- Cap rate 10.4% vs local median 2.7% in Vancouver — top-decile yield for the area; either an underpriced asset or a hidden risk that comps aren't pricing in. Stress-test before assuming the spread holds.
Location & tenants
- Location reads 82/100 on livability (#62 in WA, #1,133 nationally) — a professional / high-income tenant draw. Strengths: amenities A+, commute A+, housing A+; Watch: crime F, cost of living D-.
- Vancouver School District (suburban): math 43% / reading 53% proficiency, ranked #156 of 291 in WA (top 54%) — families likely to look elsewhere, expect single-tenant / working-renter base with shorter leases.
- Zoned schools: Washington Elementary (254 students, 84% FRL); Discovery Middle School (548 students, 78% FRL); Hudson'S Bay High School (1,143 students, 64% FRL) — zoned schools average 75% FRL vs 44% district-wide (31 pts higher); higher-poverty schools than district average — tighter screening recommended.
- Market conditions: Rents rising (+1.2%/yr); 88 active listings in the ZIP; 40 comparable units currently listed for rent nearby; rentals at typical pace (median 22d on market — plan ~3-4 weeks tenant-placement turnaround); solid renter incomes; 3,547 units permitted in Clark County in 2024 (1,361 in 5+ unit buildings).
Forward outlook
- Local home prices are declining (-3.0%/yr); year-one equity from $1k of loan paydown is wiped out by about $4k of value loss. Plan a longer hold.
- Clark County population projected at +29% by 2050 — long-run rental-demand tailwind backs the buy-and-hold thesis.
- At projected returns (-3.0% appreciation + 1.2% rent growth), your $41k cash investment doubles in ~10 years — after that, you're playing with house money.
Negotiation context
- It's been on market 60 days — a 3% lower offer ($141k) is reasonable based on typical stale-listing flexibility.
- 3 sale attempts since 16y ago with the ask held roughly flat each time — persistent listings suggest the price (not the market) is what's stuck; bring a comps-based counter.
- Current owner paid $38k; list at $145k implies a 282% gain — meaningful room to come down on a strong offer.
Questions for the listing agent
- It's been on market 60 days. Have you received any prior offers? Is the seller open to a 3% concession, seller financing, or rate buy-down credit?
- Is there a deadline driving the sale (1031 exchange, divorce, estate, relocation)? That informs how much negotiation room exists.
- Crime grade is F in this area — have there been break-ins, vandalism, or insurance claims at this property in the last 3 years? What carrier currently insures it and at what premium?
- What's the average days-on-market for RENTAL listings here right now (not sales)? A rising rental-DOM trend means longer vacancies and softer asking-rent achievability than the comps imply.
- What's the recent tenant-quality profile in this submarket — average credit score on applications, eviction rate, late-payment / NSF rate, and stable-employment percentage? A property-management company in the area should have these aggregated.
- How much new for-sale + rental construction is in the pipeline within 1–3 miles? Heavy new supply typically softens prices + rents 12–24 months out; constrained supply supports both.
Investment metrics
- 1% rule
- 1.27% ✓
- Cap rate
- 10.37%
- Cash-on-cash
- 14.55%
- DSCR
- 1.65
- GRM
- 6.6
CMA / ARV
- ARV (on-the-fly)
- $135,432
- Comps found
- 1
Show comp detail 1 sale within ~0.75 mi
| Address | Dist | Beds/Ba | Sqft | Sold | Price | $/sf | Match |
|---|---|---|---|---|---|---|---|
| 3623 V St Unit B | 0.09mi | 3/1.0 | 1,049 (-12%) | 14mo | $120,000 | $114 | 61 |
Match score weights: distance 35% · size 25% · config 20% · recency 20%. Top-matched comps best support the ARV.
Projected returns pro-forma
-3.0% appreciation · 1.17% rent growth · sell at horizon
- IRR
- 3.0%
- Equity multiple
- 1.11×
- Total profit
- $4,541
- Equity at exit
- $21,620
- IRR
- 10.7%
- Equity multiple
- 1.77×
- Total profit
- $31,199
- Equity at exit
- $12,537
Cash invested: $40,600 (down + closing). Projections, not guarantees.
Landlord ↔ Tenant lean methodology
- Overall (STATE)
- 28 Tenant-Leaning
- State Washington
- 28 Tenant-Leaning · D+8
- County
- — inherits STATE
- City
- — inherits STATE
ZIP-level market 98663
- Rents YoY
- 1.2%
- Active inventory
- 88
- Price-to-rent
- 6.6×
Monthly cashflow live
- Estimated rent
- $1,837 high interval (Pro) →
- Mortgage (P&I)
- −$760
- Tax from tax record
- −$138 /mo · $1,653/yr
- Insurance
- −$60
- HOA
- −$0
- Vacancy / Maint / Mgmt
- −$386
- Net cashflow
- $492
Break-even live
UW: 25.0% down · 7.5% · 30yr · 1.5% tax · 5.0% vac · 8.0% maint · 8.0% mgmt
Financing live
Cash to close
- Down payment
- $36,250
- Closing costs
- $4,350
- Reserves months
- —
- Total cash needed
- —
Loan-product check · same deal, 3 products live
Conventional
25% down · 7.5% · 30yr
- Down + closing
- —
- Monthly P&I
- —
- Monthly cashflow
- —
- DSCR
- —
- Eligible?
- —
Personal DTI + credit; lowest rate.
DSCR
20% down · 8.5% · 30yr
- Down + closing
- —
- Monthly P&I
- —
- Monthly cashflow
- —
- DSCR
- —
- Eligible?
- —
No personal income docs; deal must DSCR.
Hard money
10% down · 12.0% · 12mo
- Down + closing
- —
- Monthly P&I
- —
- Monthly cashflow
- —
- DSCR
- —
- Eligible?
- —
Short-term bridge; refi at stabilization.
Rent comps 40 comps
| Address | Beds | Baths | Sqft | Rent | $/sqft | DOM | Units | Dist |
|---|---|---|---|---|---|---|---|---|
| 3504 S St Unit C Vancouver, WA | 2.0 | 1.0 | 924 | $1,495 | $1.62 | 24d | 1 | 0.25mi |
| 3315 T St Unit 1 Vancouver, WA | 2.0 | 1.0 | 720 | $1,350 | $1.88 | 24d | 1 | 0.26mi |
| 2702 E 33rd St Unit 1334336P Vancouver, WA | 3.0 | 2.0 | 1496 | $5,271 | $3.52 | 24d | 1 | 0.38mi |
| 2805 S St Vancouver, WA | 4.0 | 1.0 | 1352 | $2,150 | $1.59 | 24d | 1 | 0.53mi |
| 3011 Fairmount Ave Unit 3011 Vancouver, WA | 2.0 | 1.0 | 1000 | $1,725 | $1.73 | 24d | 1 | 0.53mi |
| 1820 E 27th St Vancouver, WA | 2.0 | 1.0 | 900 | $1,635 | $1.82 | 24d | 1 | 0.59mi |
| 4105 NE St Johns Rd Vancouver, WA | 3.0 | 2.0 | 1016 | $1,995 | $1.96 | 16d | 2 | 0.61mi |
| 2600 T St Vancouver, WA | 1.0–3.0 | 1.0 | 675 | $1,699 | $2.52 | 2d | 10 | 0.64mi |
| 4622 NE Saint James Rd Unit 4704B Vancouver, WA | 2.0 | 1.0 | 850 | $1,375 | $1.62 | 24d | 1 | 0.66mi |
| 2610 R St Vancouver, WA | 2.0 | 1.0 | 800 | $1,347 | $1.68 | 11d | 4 | 0.67mi |
| 4705 NE Leverich Ct Vancouver, WA | 2.0 | 2.0 | 825 | $1,747 | $2.12 | 12d | 2 | 0.79mi |
| 4617 NE St Johns Rd Vancouver, WA | 2.0 | 1.5 | 939 | $1,615 | $1.72 | 8d | 1 | 0.80mi |
| 3503 NE 49th St Vancouver, WA | 2.0 | 1.5 | 1100 | $1,409 | $1.28 | 24d | 1 | 0.80mi |
| 2817 Neals Ln Vancouver, WA | 2.0 | 1.0 | 900 | $1,275 | $1.42 | 24d | 1 | 0.85mi |
| 2615 Neals Ln Vancouver, WA | 2.0 | 1.0 | 850 | $1,390 | $1.64 | 3d | 1 | 0.88mi |
| 2012 Y St Unit 2014 Vancouver, WA | 2.0 | 1.0 | 720 | $1,450 | $2.01 | 11d | 1 | 0.88mi |
| 3805 NE 49th St Unit A103 Vancouver, WA | 2.0 | 2.0 | 995 | $1,599 | $1.61 | 8d | 1 | 0.92mi |
| 3805 NE 49th St Unit B204 Vancouver, WA | 3.0 | 2.0 | 1325 | $1,899 | $1.43 | 24d | 1 | 0.92mi |
| 3805 NE 49th St Unit B202 Vancouver, WA | 2.0 | 2.0 | 995 | $1,599 | $1.61 | 24d | 1 | 0.92mi |
| 3512 NE 51st St Vancouver, WA | 2.0 | 1.0 | 950 | $1,489 | $1.57 | 3d | 1 | 0.95mi |
| 3100 Falk Rd Vancouver, WA | 2.0–3.0 | 2.0–3.0 | 1234 | $2,299 | $1.86 | 2d | 4 | 0.96mi |
| 2218 E 18th St Unit A Vancouver, WA | 2.0 | 1.0 | 1218 | $1,895 | $1.56 | 24d | 1 | 0.97mi |
| 2218 E 18th St Unit B Vancouver, WA | 2.0 | 2.0 | 1218 | $1,795 | $1.47 | 24d | 1 | 0.97mi |
| 2478 Rossiter Ln Vancouver, WA | 2.0–3.0 | 1.0–1.5 | 1100 | $2,299 | $2.09 | 3d | 6 | 0.99mi |
| 2920 Falk Rd Vancouver, WA | 2.0–3.0 | 2.5–3.0 | 1268 | $2,565 | $2.02 | 2d | 1 | 1.00mi |
| 301 NE 45th St Vancouver, WA | 1.0–2.0 | 1.0–2.0 | 875 | $1,899 | $2.17 | 4d | 8 | 1.02mi |
| 301 NE 45th St Vancouver, WA | 1.0–3.0 | 1.0–2.0 | 1025 | $1,899 | $1.85 | 15d | 8 | 1.02mi |
| 3505 NE Creston Ave Unit 1334334P Vancouver, WA | 2.0 | 2.0 | 1097 | $3,511 | $3.20 | 24d | 1 | 1.03mi |
| 204 E 35th St Unit 1334340P Vancouver, WA | 2.0 | 2.0 | 1097 | $4,444 | $4.05 | 24d | 1 | 1.03mi |
| 2009 Norris Rd Unit 6 Vancouver, WA | 2.0 | 1.0 | 850 | $1,295 | $1.52 | 24d | 1 | 1.04mi |
| 3311 E 21st St Apt 12 Vancouver, WA | 2.0 | 1.0 | 825 | $1,200 | $1.45 | 18d | 1 | 1.08mi |
| 4316 NE 34th Cir Vancouver, WA | 3.0 | 2.5 | 1482 | $2,450 | $1.65 | 2d | 1 | 1.10mi |
| 2431 E 16th St Vancouver, WA | 2.0 | 1.5 | 1040 | $1,762 | $1.69 | 24d | 1 | 1.10mi |
| 308 E 28th St Vancouver, WA | 1.0–2.0 | 1.0 | 730 | $1,575 | $2.16 | 3d | 2 | 1.10mi |
| 5009 NE Hazel Dell Ave Vancouver, WA | 2.0 | 1.0 | 700 | $1,400 | $2.00 | 12d | 1 | 1.10mi |
| 2815 E 19th St Apt Q Vancouver, WA | 2.0 | 1.0 | 850 | $1,395 | $1.64 | 22d | 1 | 1.10mi |
| 2815 E 19th St Unit D Vancouver, WA | 2.0 | 1.0 | 850 | $1,395 | $1.64 | 24d | 1 | 1.10mi |
| 5009 NE Hazel Dell Ave Unit 2 Vancouver, WA | 2.0 | 1.0 | 700 | $1,400 | $2.00 | 16d | 1 | 1.11mi |
| 3700 E Fourth Plain Blvd Vancouver, WA | 2.0 | 1.0 | 700 | $1,409 | $2.01 | 8d | 1 | 1.11mi |
| 3306 E 18th St Unit WA3304-1 Vancouver, WA | 3.0 | 2.0 | 1150 | $1,825 | $1.59 | 24d | 1 | 1.11mi |
Listing history 9 events
-
2022-07-30status Pending
-
2022-07-06status Pending
-
2022-05-06$145,000 Active
-
2010-05-20soldstatus $38,000 Sold 387-char remark
Show marketing remark (387 chars)
Just like new 2008 Palm Harbor.Low HOA dues $340 includes water, sewer, garbage.Front & back parking off street.Lr yard with storage shed.Tinted energy efficent windows with blinds.Vaulted throughout.Great open floorplan with eating bar,pantry & lots of cabinets.Large master with walk-in closet.All appliances stay!AC ready. Like new home at a great price!OPEN HOUSE 3/21 1-4PM.
-
2010-05-13status Pending 387-char remark
Show marketing remark (387 chars)
Just like new 2008 Palm Harbor.Low HOA dues $340 includes water, sewer, garbage.Front & back parking off street.Lr yard with storage shed.Tinted energy efficent windows with blinds.Vaulted throughout.Great open floorplan with eating bar,pantry & lots of cabinets.Large master with walk-in closet.All appliances stay!AC ready. Like new home at a great price!OPEN HOUSE 3/21 1-4PM.
-
2010-05-06status Active 387-char remark
Show marketing remark (387 chars)
Just like new 2008 Palm Harbor.Low HOA dues $340 includes water, sewer, garbage.Front & back parking off street.Lr yard with storage shed.Tinted energy efficent windows with blinds.Vaulted throughout.Great open floorplan with eating bar,pantry & lots of cabinets.Large master with walk-in closet.All appliances stay!AC ready. Like new home at a great price!OPEN HOUSE 3/21 1-4PM.
-
2010-04-29historical Bumpable 387-char remark
Show marketing remark (387 chars)
Just like new 2008 Palm Harbor.Low HOA dues $340 includes water, sewer, garbage.Front & back parking off street.Lr yard with storage shed.Tinted energy efficent windows with blinds.Vaulted throughout.Great open floorplan with eating bar,pantry & lots of cabinets.Large master with walk-in closet.All appliances stay!AC ready. Like new home at a great price!OPEN HOUSE 3/21 1-4PM.
-
2010-03-15price $40,000 387-char remark
Show marketing remark (387 chars)
Just like new 2008 Palm Harbor.Low HOA dues $340 includes water, sewer, garbage.Front & back parking off street.Lr yard with storage shed.Tinted energy efficent windows with blinds.Vaulted throughout.Great open floorplan with eating bar,pantry & lots of cabinets.Large master with walk-in closet.All appliances stay!AC ready. Like new home at a great price!OPEN HOUSE 3/21 1-4PM.
-
2010-01-22$45,000 Active 387-char remark
Show marketing remark (387 chars)
Just like new 2008 Palm Harbor.Low HOA dues $340 includes water, sewer, garbage.Front & back parking off street.Lr yard with storage shed.Tinted energy efficent windows with blinds.Vaulted throughout.Great open floorplan with eating bar,pantry & lots of cabinets.Large master with walk-in closet.All appliances stay!AC ready. Like new home at a great price!OPEN HOUSE 3/21 1-4PM.
ⓘ Source: listings_history table (triggers on properties + properties_extension) + one-shot
backfill from property_details.listing_events for pre-trigger history.
Tax reassessment forecast WA · Resets to sale price
- Current annual tax
- $1,653 · $138/mo
- Projected year-2 tax
- $1,653 · $138/mo
- Expected delta
- $0/yr ($0/mo · 0.0%)
ⓘ Screening estimate from a state-policy table — verify with the county assessor before closing.
Nearby sold comps map
Loading sold comps map…
Walkable amenities ~0.75 mi
Loading nearby amenities…
Taxation est. · year 1
- Rental income
- $22,039
- − Mortgage interest
- −$8,122
- − Property taxes
- −$1,653
- − Insurance
- −$725
- − Repairs & maintenance
- −$1,763
- − Management
- −$1,763
- − Depreciation
- −$4,218
- Taxable income
- $3,794
- Est. tax owed @ 24.0%
- −$911
- After-tax cash flow
- $4,997/yr
For passive investors: Depreciation is non-cash, so a rental often shows a tax loss while cash-flowing — sheltering income. Rental losses are passive: they offset passive income freely, and up to $25,000/yr can offset ordinary (W-2) income if you actively participate and your MAGI is under $100k (phasing out to $0 by $150k); unused losses carry forward. On sale, claimed depreciation is recaptured at up to 25%, and gains may owe capital-gains tax (a 1031 exchange can defer both). Figures are a year-1 estimate at your 24.0% rate — not tax advice; consult a CPA.
Schools (NCES district)
- District
- Vancouver School District
- NCES district ID
- 5309270
- Math proficiency
- 43% ▬ 0.00%
- Reading proficiency
- 53% ▬ 0.00%
- Median HH income
- $52,562
- Composite
- 43.45/100
- National rank
- #6479
- State rank
- #156 of 291 in WA
Livability — Vancouver
- Score
- 82/100
- State rank
- #62
- US rank
- #1133
Category grades
Schools grade is shown separately in the Schools card above.
Census & demographics
- Census place
- Vancouver, WA
- County
- Clark County · 513,189 people
- City population
- 360,195
- Metro
- Portland-Vancouver-Hillsboro, OR-WA
- Population (ZIP)
- 16,202
- Household income
- $86,018
- Rent vs Own
- Severe rent burden
- 521.0
Population outlook (Clark County) Hauer SSP2
- Today (2025)
- 529,610 people
- By 2030
- 563,242 · +6.4%
- By 2040
- 625,905 · +18.2%
- By 2050
- 681,558 · +28.7%
- By 2075
- 805,967 · +52.2%
- By 2100
- 877,450 · +65.7%
Race, ethnicity, and origin ACS 2023
- Neighborhood character
- Predominantly White (70%)
- Race & ethnicity
- White 70% Hispanic / Latino 16% Two or more races 12% Asian 2% Pacific Islander 1% Black 1% Native American 1%
- Hispanic origin (detail)
- Mexican 13% Puerto Rican 1%
- Common ancestry
- Italian 5% Portuguese 5% Slovak 3%
- Foreign-born
- 11% · Canada
- Languages at home
- 81% English-only · Spanish 12% Russian/Polish/Slavic 4% Other Indo-European 1%
Political lean MEDSL · Clark
- 2024 margin
- Lean D (+7.0) · D 52.1% · R 45.1% · Other 2.8%
- 2008→2024 swing
- +0.9pp no change · 2008: 6.1pp · 2024: 7.0pp
- All cycles
- 2024: D+7.0 2020: D+5.1 2016: D+0.1 2012: D+0.1 2008: D+6.1
Not yet ingested
- Civics
- —
Market trends
- HPI YoY
- ▼ -341.36%
- Current HPI
- 339.1855
- Rent YoY
- ▲ 1.17%
- Metro
- Portland-Vancouver-Hillsboro, OR-WA
- State GDP YoY
- ▲ 4.65%
- F500 in state
- 22
Industry mix (Fortune 500 HQ in WA)
| Industry | F500 HQs | Revenue |
|---|---|---|
| Retail | 2 | $269B |
|
||
| Technology / Retail | 1 | $638B |
|
||
| Technology | 1 | $245B |
|
||
| Telecommunications | 1 | $38B |
|
||
| Food / Beverage | 1 | $36B |
|
||
| Automotive / Trucks | 1 | $34B |
|
||
Price history
+222.2% since first listed9 events — show timeline
- 2022-07-30 Pending — RMLS
- 2022-07-06 Pending — RMLS
- 2022-05-06 Listed $145,000 RMLS
- 2010-05-20 Sold (MLS) $38,000 RMLS
- 2010-05-13 Pending — RMLS
- 2010-05-06 Relisted — RMLS
- 2010-04-29 Contingent — RMLS
- 2010-03-15 Price Changed $40,000 RMLS
- 2010-01-22 Listed $45,000 RMLS
Property tax history
+7.2%/yrLatest (2026): $1,653 · +49.7% YoY. Source: county tax records.
Cash-flow waterfall
monthlySold comps — $/sqft
last 12 mo · ≤1 miLoading sold comps…