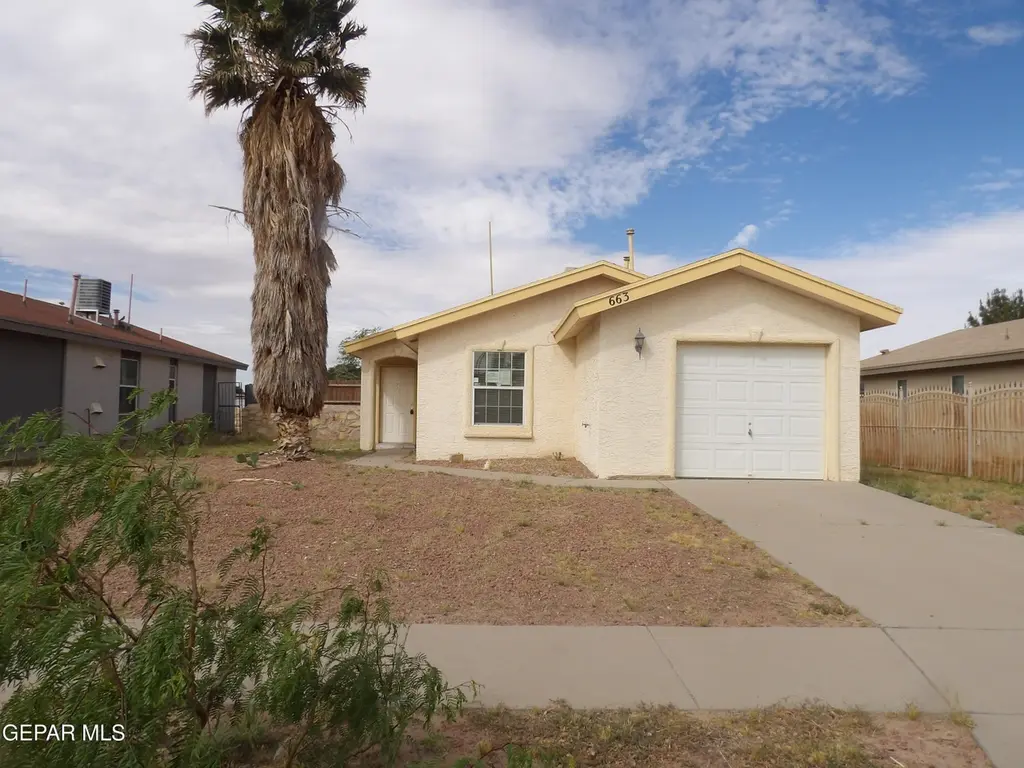
663 Danube Dr · Horizon City, TX
Flood risk 1/10 · Minimal
- FEMA flood zone
- X
- Chance of flooding over 30 yrs
- 0.0%
- Est. flood insurance / yr
- $507 – $1,088
Fire risk 3/10 · Minor
- Est. fire insurance / yr
- $1,222 – $2,270
Heat risk 5/10 · Moderate
- Hot days now (above 100°F)
- 6 days/yr
- Hot days in 30 yrs
- 19 days/yr
Wind risk 1/10 · Minimal
- Chance of severe wind over 30 yrs
- —
Air-quality risk 3/10 · Minor
- Unhealthy air days now
- 2 days/yr
- Unhealthy air days in 30 yrs
- 2 days/yr
Risk factors via First Street. Map © Google.
Why this score? — see what drove the D+ grade
The composite is a weighted blend of 9 inputs, each scored 0–100. Each bar is that input's sub-score; the figure is the points it added to the 100-point composite (weight × sub-score).
- Cash flow +17.5/30.0
- ARV discount +7.5/15.0
- 1% rule +7.3/10.0
- DSCR +5.5/10.0
- Livability +3.3/5.0
- Rent growth +3.2/5.0
- Condition / age +2.5/5.0
- Schools +1.5/10.0
- Appreciation +0.0/10.0
$127,106
🖨 Deal sheet 📄 Offer letter ✓ Due diligence
Listing remarks
Single story 3 bedroom 2 bath home in the Desert Palms subdivision. Right off Darrington Road with easy access to I-10/Loop 375 and near schools, shopping centers, and restaurants.
Key facts
- 6,120 sq ft lot
- Garage
- Built 2004
Property features AI
Finance
- Financial info: Owned by bank/Real Estate Owned
Exterior
- Parking: 1-car garage
- Home design: Single family residence
- Construction: Stucco construction; Shingle pitched roof; Total building area 1090
- Exterior features: Walled backyard
Interior
- Kitchen: Dishwasher
- Flooring: Tile; Carpet
- Bathrooms: 2 full bathrooms
- Heating & cooling: Natural gas forced air heating; Evaporative cooling
- Interior features: Ceiling fan(s); Blinds
Neighborhood map
What this means for you Summary
Snapshot
- This is a 3-bed/2.0-bath single-family listed at $127k.
Deal economics
- At list price, monthly cash flow is $97 ($1k/yr) — positive.
- The deal already cash-flows at list — no discount required.
- Meets the 1% rule at list price ($2k rent vs $127k).
- Recommended offer: $123k (3.0% below list) — sets the bar for market timing.
Location & tenants
- Location reads 66/100 on livability (#619 in TX) — a middle-class / working-renter tenant base. Strengths: crime A+, cost of living A+, housing A+; Watch: employment D, amenities F, commute F.
- Clint ISD (suburban): math 14% / reading 22% proficiency, ranked #792 of 826 in TX (top 96%) — low school quality limits family demand, transient renter base, plan for 1-2y turnover.
- Zoned schools: Carroll T Welch El (math 8% / reading 12%, grade F, #4,259 of 4,322 statewide, top 99%, 636 students, 93% FRL); Ricardo Estrada Middle (math 15% / reading 16%, grade F, #1,556 of 1,662 statewide, top 94%, 518 students, 91% FRL); Horizon H S (math 14% / reading 26%, grade F, #1,397 of 1,632 statewide, top 87%, 1,677 students, 85% FRL) — zoned schools average 90% FRL vs 59% district-wide (30 pts higher); higher-poverty schools than district average — tighter screening recommended.
- Market conditions: Rents rising (+2.9%/yr); 2088 active listings in the ZIP; 10 comparable units currently listed for rent nearby; rentals leasing fast (median 11d on market — plan ~1-2 weeks tenant-placement turnaround); solid renter incomes; 2,196 units permitted in El Paso County in 2024 (143 in 5+ unit buildings).
Forward outlook
- Local home prices are declining (-3.0%/yr); year-one equity from $878 of loan paydown is wiped out by about $4k of value loss. Plan a longer hold.
- El Paso County population projected at +10% by 2050 — modest demand growth; plan on rents tracking national, not racing it.
Negotiation context
- It's been on market 49 days — a 3% lower offer ($123k) is reasonable based on typical stale-listing flexibility.
- 3 sale attempts since 8y ago; this cycle's ask has dropped $7k (5%) from the opening price — seller is motivated, your offer sets the floor, not the list.
Risks & watch-outs
- Watch-outs: property tax is 4.0% of price.
- Climate carrying-cost: extreme-heat days projected 6→19/yr by 2055 (HVAC capex compounding) — expect insurance premiums to compound above CPI over the hold.
Questions for the listing agent
- It's been on market 49 days. Have you received any prior offers? Is the seller open to a 3% concession, seller financing, or rate buy-down credit?
- Property tax is high relative to price — has the assessment been appealed recently, and will the sale trigger a re-assessment?
- Is there a deadline driving the sale (1031 exchange, divorce, estate, relocation)? That informs how much negotiation room exists.
- Schools are D-rated, which usually means shorter tenancies and higher turnover. Who's the typical renter profile here, and what's been the actual vacancy rate?
- The area grade is low — what's the realistic commute time and amenity access for the typical tenant pool here? Any planned neighborhood developments (good or bad) we should know about?
- What's the average days-on-market for RENTAL listings here right now (not sales)? A rising rental-DOM trend means longer vacancies and softer asking-rent achievability than the comps imply.
- What's the recent tenant-quality profile in this submarket — average credit score on applications, eviction rate, late-payment / NSF rate, and stable-employment percentage? A property-management company in the area should have these aggregated.
- How much new for-sale + rental construction is in the pipeline within 1–3 miles? Heavy new supply typically softens prices + rents 12–24 months out; constrained supply supports both.
Investment metrics
- 1% rule
- 1.23% ✓
- Cap rate
- 7.21%
- Cash-on-cash
- 3.29%
- DSCR
- 1.15
- GRM
- 6.8
CMA / ARV
No comps found within radius.
Projected returns pro-forma
-3.0% appreciation · 2.93% rent growth · sell at horizon
- IRR
- -11.1%
- Equity multiple
- 0.60×
- Total profit
- $-14,317
- Equity at exit
- $18,952
- IRR
- -1.7%
- Equity multiple
- 0.88×
- Total profit
- $-4,180
- Equity at exit
- $10,990
Cash invested: $35,590 (down + closing). Projections, not guarantees.
Landlord ↔ Tenant lean methodology
- Overall (STATE)
- 87 Strongly Landlord-Friendly
- State Texas
- 87 Strongly Landlord-Friendly · R+5
- County
- — inherits STATE
- City
- — inherits STATE
ZIP-level market 79928
- Home prices YoY
- -16.9%
- Rents YoY
- 2.9%
- Active inventory
- 2088
- Price-to-rent
- 6.8×
Monthly cashflow live
- Estimated rent
- $1,566 high interval (Pro) →
- Mortgage (P&I)
- −$667
- Tax from tax record
- −$420 /mo · $5,041/yr
- Insurance
- −$53
- HOA
- −$0
- Vacancy / Maint / Mgmt
- −$329
- Net cashflow
- $97
Break-even live
UW: 25.0% down · 7.5% · 30yr · 1.5% tax · 5.0% vac · 8.0% maint · 8.0% mgmt
Financing live
Cash to close
- Down payment
- $31,776
- Closing costs
- $3,813
- Reserves months
- —
- Total cash needed
- —
Loan-product check · same deal, 3 products live
Conventional
25% down · 7.5% · 30yr
- Down + closing
- —
- Monthly P&I
- —
- Monthly cashflow
- —
- DSCR
- —
- Eligible?
- —
Personal DTI + credit; lowest rate.
DSCR
20% down · 8.5% · 30yr
- Down + closing
- —
- Monthly P&I
- —
- Monthly cashflow
- —
- DSCR
- —
- Eligible?
- —
No personal income docs; deal must DSCR.
Hard money
10% down · 12.0% · 12mo
- Down + closing
- —
- Monthly P&I
- —
- Monthly cashflow
- —
- DSCR
- —
- Eligible?
- —
Short-term bridge; refi at stabilization.
Rent comps 10 comps
| Address | Beds | Baths | Sqft | Rent | $/sqft | DOM | Units | Dist |
|---|---|---|---|---|---|---|---|---|
| 14565 Hendrik Dr Unit B El Paso, TX | 2.0 | 1.0 | 970 | $900 | $0.93 | 3d | 1 | 0.25mi |
| 14624 Achim Dr El Paso, TX | 3.0 | 2.0 | 1422 | $1,500 | $1.05 | 10d | 1 | 0.38mi |
| 656 Orchid Dr Horizon City, TX | 3.0 | 2.0 | 1092 | $1,350 | $1.24 | 24d | 1 | 0.41mi |
| 14269 Escalera Dr El Paso, TX | 3.0 | 2.0 | 1269 | $1,850 | $1.46 | 3d | 1 | 0.64mi |
| 456 Von Bargen Dr Horizon City, TX | 3.0 | 2.0 | 1120 | $1,300 | $1.16 | 14d | 1 | 0.68mi |
| 14333 Paraiso Dr El Paso, TX | 3.0 | 2.0 | 1224 | $2,000 | $1.63 | 3d | 1 | 0.83mi |
| 14361 Star Cactus Ave Horizon City, TX | 3.0 | 2.0 | 1170 | $1,600 | $1.37 | 10d | 1 | 0.86mi |
| 14608 Adonis Blue Ct El Paso, TX | 3.0 | 2.5 | 1350 | $1,650 | $1.22 | 10d | 1 | 0.87mi |
| 14496 Cabana Dr Horizon City, TX | 3.0 | 2.0 | 1120 | $1,475 | $1.32 | 44d | 1 | 0.87mi |
| 15006 Nunda Dr Unit B Horizon City, TX | 3.0 | 2.0 | 1120 | $1,250 | $1.12 | 24d | 1 | 1.12mi |
Listing history 22 events
-
2026-06-18days on market $127,106 Active 49 DOM
-
2026-06-17days on market $127,106 Active 48 DOM
-
2026-06-16days on market $127,106 Active 47 DOM
-
2026-06-15days on market $127,106 Active 46 DOM
-
2026-06-13days on market $127,106 Active 44 DOM
-
2026-06-10days on market $127,106 Active 41 DOM
-
2026-06-09days on market $127,106 Active 40 DOM
-
2026-06-08days on market $127,106 Active 39 DOM
-
2026-06-07pricedays on market $127,106 Active 38 DOM
-
2026-06-03days on market $133,796 Active 34 DOM
-
2026-06-03days on market $133,796 Active 33 DOM
-
2026-06-01days on market $133,796 Active 32 DOM
-
2026-05-31days on market $133,796 Active 31 DOM
-
2026-04-30$133,796 Active 181-char remark
-
2019-03-12status Pending
-
2019-03-12historical
-
2018-12-17price $90,000
-
2018-11-08status Active
-
2018-11-06status Pending
-
2018-10-19$95,000 Active
-
2011-03-02soldstatus
-
2011-03-02soldstatus
ⓘ Source: listings_history table (triggers on properties + properties_extension) + one-shot
backfill from property_details.listing_events for pre-trigger history.
Tax reassessment forecast TX · Resets to sale price
- Current annual tax
- $5,041 · $420/mo
- Projected year-2 tax
- $5,041 · $420/mo
- Expected delta
- $0/yr ($0/mo · 0.0%)
ⓘ Screening estimate from a state-policy table — verify with the county assessor before closing.
Climate risk First Street
- Flood 1/10 Low FEMA zone X · 0% chance over 30 yrs
- Wildfire 3/10 Moderate
- Heat 5/10 Major 6 d/yr ≥100°F today · 19 d/yr by 30 yrs out
- Wind 1/10 Low
- Air quality 3/10 Moderate 2 unhealthy d/yr today · 2 by 30 yrs out
Nearby sold comps map
Loading sold comps map…
Walkable amenities ~0.75 mi
Loading nearby amenities…
Taxation est. · year 1
- Rental income
- $18,791
- − Mortgage interest
- −$7,120
- − Property taxes
- −$5,041
- − Insurance
- −$636
- − Repairs & maintenance
- −$1,503
- − Management
- −$1,503
- − Depreciation
- −$3,698
- Taxable loss
- −$710
- Est. tax savings @ 24.0%
- +$170
- After-tax cash flow
- $1,340/yr
For passive investors: Depreciation is non-cash, so a rental often shows a tax loss while cash-flowing — sheltering income. Rental losses are passive: they offset passive income freely, and up to $25,000/yr can offset ordinary (W-2) income if you actively participate and your MAGI is under $100k (phasing out to $0 by $150k); unused losses carry forward. On sale, claimed depreciation is recaptured at up to 25%, and gains may owe capital-gains tax (a 1031 exchange can defer both). Figures are a year-1 estimate at your 24.0% rate — not tax advice; consult a CPA.
Schools (NCES district)
- District
- Clint ISD
- NCES district ID
- 4814430
- Math proficiency
- 14% ▼ -32.00%
- Reading proficiency
- 22% ▼ -15.00%
- Median HH income
- $37,490
- Composite
- 15.03/100
- National rank
- #9356
- State rank
- #792 of 826 in TX
Livability — Horizon City
- Score
- 66/100
- State rank
- #619
- US rank
- #11815
Category grades
Schools grade is shown separately in the Schools card above.
Census & demographics
- Census place
- Horizon City, TX
- County
- El Paso County · 761,266 people
- City population
- 86,599
- Metro
- El Paso, TX
- Population (ZIP)
- 86,599
- Household income
- $76,643
- Rent vs Own
- Severe rent burden
- 838.0
Population outlook (El Paso County) Hauer SSP2
- Today (2025)
- 897,899 people
- By 2030
- 922,694 · +2.8%
- By 2040
- 960,492 · +7.0%
- By 2050
- 982,919 · +9.5%
- By 2075
- 997,266 · +11.1%
- By 2100
- 900,630 · +0.3%
Race, ethnicity, and origin ACS 2023
- Neighborhood character
- Predominantly Hispanic (89%)
- Race & ethnicity
- Hispanic / Latino 89% Two or more races 39% White 7% Black 2% Native American 2%
- Hispanic origin (detail)
- Mexican 84%
- Foreign-born
- 23% · Canada
- Languages at home
- 25% English-only · Spanish 74% Other Asian/Pacific 1%
Political lean MEDSL · El Paso
- 2024 margin
- D (+15.1) · D 57.0% · R 41.8% · Other 1.2%
- 2008→2024 swing
- -17.4pp toward R · 2008: 32.5pp · 2024: 15.1pp
- All cycles
- 2024: D+15.1 2020: D+35.1 2016: D+43.2 2012: D+32.6 2008: D+32.5
Not yet ingested
- Civics
- —
Market trends
- HPI YoY
- ▼ -40.72%
- Current HPI
- 200.6454
- Rent YoY
- ▲ 2.93%
- Metro
- El Paso, TX
- State GDP YoY
- ▲ 3.95%
- F500 in state
- 110
Industry mix (Fortune 500 HQ in TX)
| Industry | F500 HQs | Revenue |
|---|---|---|
| Energy | 16 | $1,198B |
|
||
| Technology | 5 | $198B |
|
||
| Engineering / Construction | 4 | $72B |
|
||
| Energy Services | 3 | $60B |
|
||
| Utilities | 3 | $41B |
|
||
| Healthcare | 2 | $330B |
|
||
Price history
+33.8% since first listed10 events — show timeline
- 2026-06-05 Price Changed $127,106 GEPARMLS
- 2026-04-30 Listed $133,796 GEPARMLS
- 2019-03-12 Pending — GEPARMLS
- 2019-03-12 Listing Removed — GEPARMLS
- 2018-12-17 Price Changed $90,000 GEPARMLS
- 2018-11-08 Relisted — GEPARMLS
- 2018-11-06 Pending — GEPARMLS
- 2018-10-19 Listed $95,000 GEPARMLS
- 2011-03-02 Sold (Public Records) — Public Records
- 2011-03-02 Sold (Public Records) — Public Records
Property tax history
+7.1%/yrLatest (2025): $5,041 · +5.4% YoY. Source: county tax records.
Cash-flow waterfall
monthlySold comps — $/sqft
last 12 mo · ≤1 miLoading sold comps…