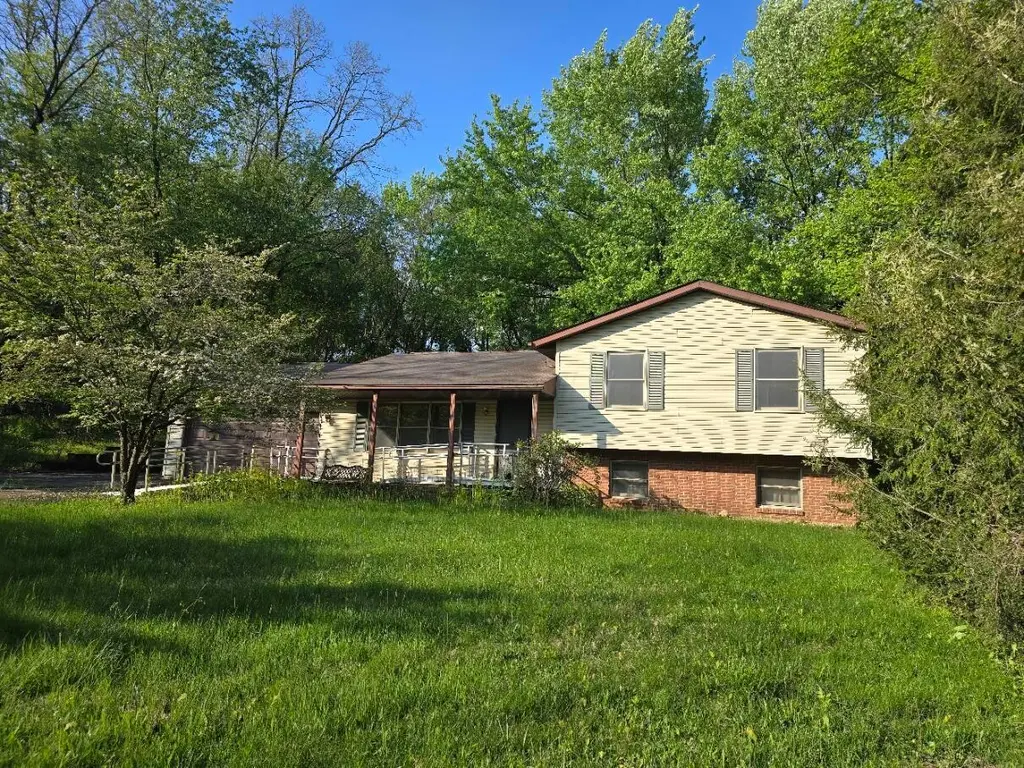
174 Crabapple Dr · Apple Valley, OH
Flood risk 1/10 · Minimal
- FEMA flood zone
- X (unshaded)
- Chance of flooding over 30 yrs
- 0.0%
- Est. flood insurance / yr
- $473 – $860
Fire risk 1/10 · Minimal
- Est. fire insurance / yr
- $713 – $1,323
Heat risk 3/10 · Minor
- Hot days now (above 99°F)
- 7 days/yr
- Hot days in 30 yrs
- 17 days/yr
Wind risk 2/10 · Minimal
- Chance of severe wind over 30 yrs
- 0.0%
Air-quality risk 2/10 · Minimal
- Unhealthy air days now
- 1 days/yr
- Unhealthy air days in 30 yrs
- 3 days/yr
Risk factors via First Street. Map © Google.
Why this score? — see what drove the C- grade
The composite is a weighted blend of 9 inputs, each scored 0–100. Each bar is that input's sub-score; the figure is the points it added to the 100-point composite (weight × sub-score).
- ARV discount +15.0/15.0
- Cash flow +13.6/30.0
- Schools +5.0/10.0
- 1% rule +4.4/10.0
- DSCR +4.1/10.0
- Livability +3.2/5.0
- Rent growth +2.5/5.0
- Condition / age +2.5/5.0
- Appreciation +0.0/10.0
$155,000
🖨 Deal sheet 📄 Offer letter ✓ Due diligence
Listing remarks
Opportunity Awaits in Orchard Hills! Split-Level on a Double Lot in East Knox Local SD Don't miss this well-priced split-level home nestled on a spacious double lot (~0.7 acre) in the Orchard Hills Subdivision of Howard Township, Knox County. Built in 1996, this 3-bedroom, 2-full-bath home offers 1,232 sq ft of finished living space plus a full 1,144 sq ft unfinished basement -- ready for your vision and packed with equity potential. The main and upper levels feature comfortable living areas, a functional kitchen, and three upstairs bedrooms, while the lower level provides a fourth bedroom and a family room. The master suite includes a private full en suite bath for added convenience. Majo
Key facts
- Double lot
- New water heater
- Brand new hvac
Tags
Property features AI
Finance
- HOA & community: Homeowners association with annual fee of $377
Exterior
- Parking: Attached 2-car garage
- Utilities: Public water; Public sewer
- Home design: Single family residence; Multi/split level; No shared/common walls; Built in 1996
- Construction: Block foundation
- Exterior features: Lot about 0.75 acre; Additional parcel: 23-00108.000
Interior
- Flooring: Carpet; Vinyl
- Bathrooms: 2 full bathrooms
- Heating & cooling: Forced air heating (propane); Central air conditioning
- Interior features: Full basement; Living area approximately 1,232
Neighborhood map
What this means for you Summary
Snapshot
- This is a 3-bed/2.0-bath single-family listed at $155k.
Deal economics
- At list price, monthly cash flow is $10 ($119/yr) — positive.
- The deal already cash-flows at list — no discount required.
- To meet the 1% rule (rent ≥ 1% of price), the offer needs to be $145k (6.5% below list).
- Recommended offer: $145k (6.5% below list) — sets the bar for 1% rule.
- Cap rate 6.4% vs local median 2.0% in Apple Valley — top-decile yield for the area; either an underpriced asset or a hidden risk that comps aren't pricing in. Stress-test before assuming the spread holds.
Location & tenants
- Location reads 65/100 on livability (#700 in OH) — a middle-class / working-renter tenant base. Strengths: cost of living A+, housing A+, crime A; Watch: schools D-, amenities F, commute F.
- East Knox Local (rural): math 55% / reading 62% proficiency, ranked #302 of 656 in OH (top 46%) — acceptable for families but not a draw, mixed tenant base, ~2y average lease.
- Market conditions: 115 active listings in the ZIP; 1 comparable units currently listed for rent nearby; solid renter incomes; 195 units permitted in Knox County in 2024 (0 in 5+ unit buildings).
Forward outlook
- Local home prices are declining (-3.0%/yr); year-one equity from $1k of loan paydown is wiped out by about $5k of value loss. Plan a longer hold.
- Knox County population projected at -14% by 2050 — secular population decline; favor cash flow + early exit over multi-decade hold.
Negotiation context
- Only 1 days on market — expect competitive offers; lowballing is unlikely to land.
- 2 sale attempts with the ask held roughly flat each time — persistent listings suggest the price (not the market) is what's stuck; bring a comps-based counter.
- Current owner paid $129k; 20% above their basis — modest negotiation headroom, anchor on the comps not their cost.
Questions for the listing agent
- What does the HOA fee cover, when was the last increase, and are there any pending special assessments or reserve-fund shortfalls?
- Is there a deadline driving the sale (1031 exchange, divorce, estate, relocation)? That informs how much negotiation room exists.
- Schools are D-rated, which usually means shorter tenancies and higher turnover. Who's the typical renter profile here, and what's been the actual vacancy rate?
- What's the average days-on-market for RENTAL listings here right now (not sales)? A rising rental-DOM trend means longer vacancies and softer asking-rent achievability than the comps imply.
- What's the recent tenant-quality profile in this submarket — average credit score on applications, eviction rate, late-payment / NSF rate, and stable-employment percentage? A property-management company in the area should have these aggregated.
- How much new for-sale + rental construction is in the pipeline within 1–3 miles? Heavy new supply typically softens prices + rents 12–24 months out; constrained supply supports both.
Investment metrics
- 1% rule
- 0.94% ✗
- Cap rate
- 6.37%
- Cash-on-cash
- 0.27%
- DSCR
- 1.01
- GRM
- 8.9
CMA / ARV
- ARV (on-the-fly)
- $224,224
- Comps found
- 12
Show comp detail 12 sales within ~0.75 mi
| Address | Dist | Beds/Ba | Sqft | Sold | Price | $/sf | Match |
|---|---|---|---|---|---|---|---|
| 174 Crabapple Dr | 0.00mi | 4/2.0 (+1) | 1,232 (0%) | 0mo | $165,000 | $134 | 95 |
| 667 Winesap Cir | 0.20mi | 3/2.0 | 1,346 (+9%) | 5mo | $267,500 | $199 | 71 |
| 88 Baldwin Ct | 0.12mi | 3/2.5 | 1,292 (+5%) | 20mo | $268,000 | $207 | 68 |
| 1485 Apple Valley Dr | 0.26mi | 2/2.0 (-1) | 1,190 (-3%) | 12mo | $210,000 | $176 | 67 |
| 1176 Apple Valley Dr | 0.43mi | 2/1.0 (-1) | 1,200 (-3%) | 6mo | $199,900 | $167 | 61 |
| 93 Crabapple Ct | 0.24mi | 3/2.0 | 1,388 (+13%) | 8mo | $190,000 | $137 | 61 |
| 1137 Apple Valley Dr | 0.52mi | 3/2.0 | 1,344 (+9%) | 2mo | $380,000 | $283 | 59 |
| 551 Crabapple Dr | 0.44mi | 3/2.0 | 1,320 (+7%) | 12mo | $240,000 | $182 | 58 |
| 494 Crabapple Dr | 0.50mi | 2/2.0 (-1) | 1,288 (+4%) | 18mo | $200,000 | $155 | 49 |
| 1601 Apple Valley Dr | 0.60mi | 4/3.0 (+1) | 1,152 (-6%) | 9mo | $264,000 | $229 | 45 |
| 177 Northern Spy Dr | 0.62mi | 2/1.0 (-1) | 1,092 (-11%) | 2mo | $251,000 | $230 | 42 |
| 220 Northern Spy Dr | 0.67mi | 2/2.0 (-1) | 1,100 (-11%) | 11mo | $190,000 | $173 | 37 |
Match score weights: distance 35% · size 25% · config 20% · recency 20%. Top-matched comps best support the ARV.
Projected returns pro-forma
-3.0% appreciation · 3.0% rent growth · sell at horizon
- IRR
- -15.8%
- Equity multiple
- 0.44×
- Total profit
- $-24,425
- Equity at exit
- $23,111
- IRR
- -7.3%
- Equity multiple
- 0.53×
- Total profit
- $-20,208
- Equity at exit
- $13,402
Cash invested: $43,400 (down + closing). Projections, not guarantees.
Landlord ↔ Tenant lean methodology
- Overall (STATE)
- 73 Landlord-Friendly
- State Ohio
- 73 Landlord-Friendly · R+6
- County
- — inherits STATE
- City
- — inherits STATE
ZIP-level market 43028
- Home prices YoY
- -32.1%
- Active inventory
- 115
- Price-to-rent
- 8.9×
Monthly cashflow live
- Estimated rent
- $1,450 medium interval (Pro) →
- Mortgage (P&I)
- −$813
- Tax from tax record
- −$227 /mo · $2,726/yr
- Insurance
- −$65
- HOA
- −$31
- Vacancy / Maint / Mgmt
- −$304
- Net cashflow
- $10
Break-even live
UW: 25.0% down · 7.5% · 30yr · 1.5% tax · 5.0% vac · 8.0% maint · 8.0% mgmt
Financing live
Cash to close
- Down payment
- $38,750
- Closing costs
- $4,650
- Reserves months
- —
- Total cash needed
- —
Loan-product check · same deal, 3 products live
Conventional
25% down · 7.5% · 30yr
- Down + closing
- —
- Monthly P&I
- —
- Monthly cashflow
- —
- DSCR
- —
- Eligible?
- —
Personal DTI + credit; lowest rate.
DSCR
20% down · 8.5% · 30yr
- Down + closing
- —
- Monthly P&I
- —
- Monthly cashflow
- —
- DSCR
- —
- Eligible?
- —
No personal income docs; deal must DSCR.
Hard money
10% down · 12.0% · 12mo
- Down + closing
- —
- Monthly P&I
- —
- Monthly cashflow
- —
- DSCR
- —
- Eligible?
- —
Short-term bridge; refi at stabilization.
Rent comps 1 comps
| Address | Beds | Baths | Sqft | Rent | $/sqft | DOM | Units | Dist |
|---|---|---|---|---|---|---|---|---|
| 186 Crabapple Dr Howard, OH | 2.0 | 1.5 | 1200 | $1,450 | $1.21 | 1d | 1 | 0.02mi |
HOA detail
- Monthly dues
- $31 · $372/yr
Listing history 7 events
-
2026-05-25status Pending
-
2026-05-25$155,000 Active
-
2026-05-25$155,000 Active
-
2005-05-04soldstatus $129,000
-
2002-03-26soldstatus $119,000
-
1999-06-07soldstatus $106,900
-
1995-10-13soldstatus $8,250
ⓘ Source: listings_history table (triggers on properties + properties_extension) + one-shot
backfill from property_details.listing_events for pre-trigger history.
Tax reassessment forecast OH · Partial reset (capped growth)
- Current annual tax
- $2,726 · $227/mo
- Projected year-2 tax
- $2,726 · $227/mo
- Expected delta
- $0/yr ($0/mo · 0.0%)
ⓘ Screening estimate from a state-policy table — verify with the county assessor before closing.
Climate risk First Street
- Flood 1/10 Low FEMA zone X (unshaded) · 0% chance over 30 yrs
- Wildfire 1/10 Low
- Heat 3/10 Moderate 7 d/yr ≥99°F today · 17 d/yr by 30 yrs out
- Wind 2/10 Low 0% chance of damaging wind over 30 yrs
- Air quality 2/10 Low 1 unhealthy d/yr today · 3 by 30 yrs out
Nearby sold comps map
Loading sold comps map…
Walkable amenities ~0.75 mi
Loading nearby amenities…
Taxation est. · year 1
- Rental income
- $17,400
- − Mortgage interest
- −$8,682
- − Property taxes
- −$2,726
- − Insurance
- −$775
- − Repairs & maintenance
- −$1,392
- − Management
- −$1,392
- − HOA
- −$372
- − Depreciation
- −$4,509
- Taxable loss
- −$2,449
- Est. tax savings @ 24.0%
- +$588
- After-tax cash flow
- $706/yr
For passive investors: Depreciation is non-cash, so a rental often shows a tax loss while cash-flowing — sheltering income. Rental losses are passive: they offset passive income freely, and up to $25,000/yr can offset ordinary (W-2) income if you actively participate and your MAGI is under $100k (phasing out to $0 by $150k); unused losses carry forward. On sale, claimed depreciation is recaptured at up to 25%, and gains may owe capital-gains tax (a 1031 exchange can defer both). Figures are a year-1 estimate at your 24.0% rate — not tax advice; consult a CPA.
Schools (NCES district)
- District
- East Knox Local
- NCES district ID
- 3910013
- Math proficiency
- 55% ▼ -4.00%
- Reading proficiency
- 62% ▼ -8.00%
- Median HH income
- $54,761
- Composite
- 50.27/100
- National rank
- #1888
- State rank
- #302 of 656 in OH
Livability — Apple Valley
- Score
- 65/100
- State rank
- #700
- US rank
- #12521
Category grades
Schools grade is shown separately in the Schools card above.
Census & demographics
- Census place
- Apple Valley, OH
- County
- Knox · 63,297 people
- Population (ZIP)
- 8,063
- Household income
- $89,543
- Rent vs Own
Population outlook (Knox County) Hauer SSP2
- Today (2025)
- 60,036 people
- By 2030
- 58,670 · -2.3%
- By 2040
- 54,963 · -8.4%
- By 2050
- 51,353 · -14.5%
- By 2075
- 43,196 · -28.0%
- By 2100
- 34,514 · -42.5%
Race, ethnicity, and origin ACS 2023
- Neighborhood character
- Predominantly White (93%)
- Race & ethnicity
- White 93% Two or more races 4% Asian 2% Hispanic / Latino 2% Black 1%
- Common ancestry
- Iranian 3% Romanian 2% Italian 2%
- Foreign-born
- 2% · China
- Languages at home
- 97% English-only · German/W. Germanic 2% Chinese 1%
Political lean MEDSL · Knox
- 2024 margin
- Solid R (+44.9) · D 27.1% · R 72.0%
- 2008→2024 swing
- -25.0pp toward R · 2008: -19.9pp · 2024: -44.9pp
- All cycles
- 2024: R+44.9 2020: R+43.8 2016: R+38.2 2012: R+24.3 2008: R+19.9
Not yet ingested
- Civics
- —
Market trends
- HPI YoY
- ▼ -143.51%
- Current HPI
- 304.1773
- Rent YoY
- —
- Metro
- —
- State GDP YoY
- ▲ 1.98%
- F500 in state
- 48
Industry mix (Fortune 500 HQ in OH)
| Industry | F500 HQs | Revenue |
|---|---|---|
| Insurance | 3 | $145B |
|
||
| Industrial Machinery | 3 | $49B |
|
||
| Financial Services | 3 | $24B |
|
||
| Consumer Goods | 2 | $93B |
|
||
| Aerospace / Defense | 2 | $47B |
|
||
| Utilities | 2 | $33B |
|
||
Price history
+1778.8% since first listed7 events — show timeline
- 2026-05-25 Pending — CBRMLS
- 2026-05-25 Listed $155,000 KCBOR
- 2026-05-25 Listed $155,000 CBRMLS
- 2005-05-04 Sold (Public Records) $129,000 Public Records
- 2002-03-26 Sold (Public Records) $119,000 Public Records
- 1999-06-07 Sold (Public Records) $106,900 Public Records
- 1995-10-13 Sold (Public Records) $8,250 Public Records
Property tax history
+4.0%/yrLatest (2025): $2,726 · -0.8% YoY. Source: county tax records.
Cash-flow waterfall
monthlySold comps — $/sqft
last 12 mo · ≤1 miLoading sold comps…