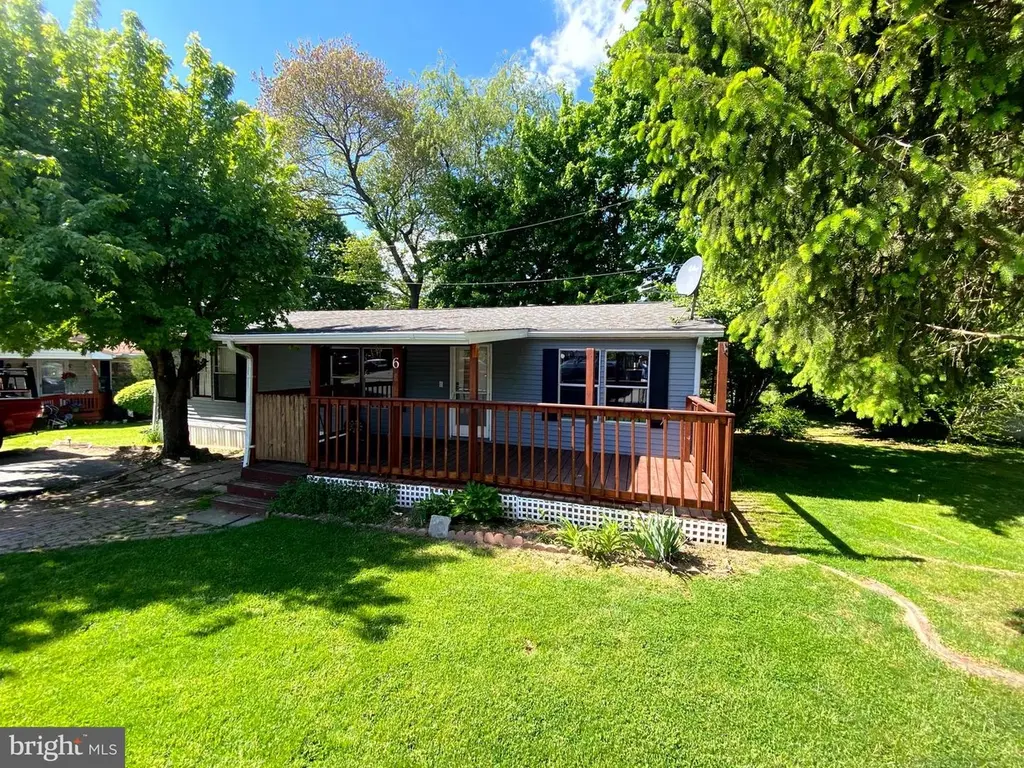
6 Londonderry Ct · Cochranville, PA
Flood risk 1/10 · Minimal
- FEMA flood zone
- X (unshaded)
- Chance of flooding over 30 yrs
- 0.0%
- Est. flood insurance / yr
- $473 – $860
Fire risk 1/10 · Minimal
- Est. fire insurance / yr
- $511 – $949
Heat risk 5/10 · Moderate
- Hot days now (above 100°F)
- 7 days/yr
- Hot days in 30 yrs
- 14 days/yr
Wind risk 6/10 · Moderate
- Chance of severe wind over 30 yrs
- 27.0%
Air-quality risk 2/10 · Minimal
- Unhealthy air days now
- 1 days/yr
- Unhealthy air days in 30 yrs
- 3 days/yr
Risk factors via First Street. Map © Google.
Why this score? — see what drove the B grade
The composite is a weighted blend of 9 inputs, each scored 0–100. Each bar is that input's sub-score; the figure is the points it added to the 100-point composite (weight × sub-score).
- Cash flow +30.0/30.0
- 1% rule +10.0/10.0
- DSCR +10.0/10.0
- ARV discount +7.5/15.0
- Appreciation +4.8/10.0
- Schools +3.8/10.0
- Livability +3.0/5.0
- Rent growth +2.5/5.0
- Condition / age +2.5/5.0
$109,900
🖨 Deal sheet 📄 Offer letter ✓ Due diligence
Listing remarks
Welcome to 6 Londonderry Ct! A well-maintained and move-in ready 3-bedroom, 2-bath home located in a desirable community in Londonderry Township. This home features numerous recent updates, including new flooring throughout, a new water heater, updated central air system, and fully remodeled bathrooms. Fresh paint throughout gives the home a clean, modern feel. The spacious layout offers comfortable living with ample natural light, while the front porch provides a spacious, great space for relaxing or entertaining. Off-street parking for two vehicles adds convenience. Located in a well-kept community with monthly lot rent of $505, this home offers an affordable opportunity for homeownership
Key facts
- 5,227 sq ft lot
- 2 parking spots
- Built 1988
Property features AI
Finance
- Other: Private, paved road; Located in Londonderry Court park (park name); Pets allowed on a case-by-case basis
- Financial info: Ground rent listed (annual ground rent referenced)
- HOA & community: Monthly fee of $505
Exterior
- Parking: Driveway parking (2 spaces); Brick and paved driveway; Total of 2 garage/parking spaces
- Utilities: Community water; On-site septic; Electric available; Propane (leased)
- Home design: Manufactured double-wide home; Estimated year built; Estimated finished above-grade area
- Construction: Manufactured/modular construction; Shingle roof; Shed on property
- Exterior features: Rear yard; Deck(s); Porch(es); Shed; Ground rent exists
Interior
- Kitchen: Gas oven/range; Refrigerator
- Bedrooms: Three bedrooms on the main level (Master bedroom, Bedroom 2, Bedroom 3)
- Flooring: Luxury vinyl plank; Tile/brick
- Bathrooms: Two full bathrooms on the main level
- Heating & cooling: Forced air heating; Propane hot water; Central air conditioning (electric); 200+ amp electrical service
- Interior features: Dining area; Walk-in closets; Wood stove; Galley kitchen; Drywall walls and ceilings
- Laundry & utility: Washer and dryer on the main floor; Water heater
Neighborhood map
What this means for you Summary
Snapshot
- This is a 3-bed/2.0-bath manufactured listed at $110k.
Deal economics
- At list price, monthly cash flow is $966 ($12k/yr) — positive.
- The deal already cash-flows at list — no discount required.
- Meets the 1% rule at list price ($2k rent vs $110k).
- Recommended offer: $107k (3.0% below list) — sets the bar for market timing.
Location & tenants
- Location reads 60/100 on livability (#1,455 in PA) — a middle-class / working-renter tenant base. Strengths: housing A, cost of living A-, crime B+; Watch: schools F, amenities F, commute F.
- Octorara Area SD (rural): math 33% / reading 51% proficiency, ranked #286 of 539 in PA (top 53%) — families likely to look elsewhere, expect single-tenant / working-renter base with shorter leases.
- Market conditions: 36 active listings in the ZIP; 1,513 units permitted in Chester County in 2024 (354 in 5+ unit buildings).
Forward outlook
- In year one you build about $327 of equity ($760 loan paydown + $-433 appreciation (-0.4% local appreciation)).
- Chester County population projected at +6% by 2050 — modest demand growth; plan on rents tracking national, not racing it.
- At projected returns (-0.4% appreciation + 3.0% rent growth), your $31k cash investment doubles in ~3 years — after that, you're playing with house money.
Negotiation context
- It's been on market 44 days — a 3% lower offer ($107k) is reasonable based on typical stale-listing flexibility.
Risks & watch-outs
- Climate carrying-cost: major wind risk, 27% chance of damaging wind over 30y; extreme-heat days projected 7→14/yr by 2055 (HVAC capex compounding) — expect insurance premiums to compound above CPI over the hold.
Questions for the listing agent
- It's been on market 44 days. Have you received any prior offers? Is the seller open to a 3% concession, seller financing, or rate buy-down credit?
- Is there a deadline driving the sale (1031 exchange, divorce, estate, relocation)? That informs how much negotiation room exists.
- Schools are F-rated, which usually means shorter tenancies and higher turnover. Who's the typical renter profile here, and what's been the actual vacancy rate?
- What's the average days-on-market for RENTAL listings here right now (not sales)? A rising rental-DOM trend means longer vacancies and softer asking-rent achievability than the comps imply.
- What's the recent tenant-quality profile in this submarket — average credit score on applications, eviction rate, late-payment / NSF rate, and stable-employment percentage? A property-management company in the area should have these aggregated.
- How much new for-sale + rental construction is in the pipeline within 1–3 miles? Heavy new supply typically softens prices + rents 12–24 months out; constrained supply supports both.
Investment metrics
- 1% rule
- 1.86% ✓
- Cap rate
- 16.84%
- Cash-on-cash
- 37.67%
- DSCR
- 2.68
- GRM
- 4.5
CMA / ARV
- ARV (median comp)
- $229,480
- List price
- $109,900
- Delta
- -52.11%
- Verdict
- UNDERPRICED
- Comps
- 3 within 2.0 mi
Projected returns pro-forma
-0.39% appreciation · 3.0% rent growth · sell at horizon
- IRR
- 37.9%
- Equity multiple
- 2.83×
- Total profit
- $56,258
- Equity at exit
- $29,765
- IRR
- 41.5%
- Equity multiple
- 5.56×
- Total profit
- $140,250
- Equity at exit
- $34,108
Cash invested: $30,772 (down + closing). Projections, not guarantees.
Landlord ↔ Tenant lean methodology
- Overall (STATE)
- 62 Landlord-Friendly
- State Pennsylvania
- 62 Landlord-Friendly · EVEN
- County
- — inherits STATE
- City
- — inherits STATE
ZIP-level market 19330
- Home prices YoY
- -0.1%
- Active inventory
- 36
- Price-to-rent
- 4.5×
Monthly cashflow live
- Estimated rent
- $2,049 medium interval (Pro) →
- Mortgage (P&I)
- −$576
- Tax from tax record
- −$30 /mo · $363/yr
- Insurance
- −$46
- HOA
- −$0
- Vacancy / Maint / Mgmt
- −$430
- Net cashflow
- $966
Break-even live
UW: 25.0% down · 7.5% · 30yr · 1.5% tax · 5.0% vac · 8.0% maint · 8.0% mgmt
Financing live
Cash to close
- Down payment
- $27,475
- Closing costs
- $3,297
- Reserves months
- —
- Total cash needed
- —
Loan-product check · same deal, 3 products live
Conventional
25% down · 7.5% · 30yr
- Down + closing
- —
- Monthly P&I
- —
- Monthly cashflow
- —
- DSCR
- —
- Eligible?
- —
Personal DTI + credit; lowest rate.
DSCR
20% down · 8.5% · 30yr
- Down + closing
- —
- Monthly P&I
- —
- Monthly cashflow
- —
- DSCR
- —
- Eligible?
- —
No personal income docs; deal must DSCR.
Hard money
10% down · 12.0% · 12mo
- Down + closing
- —
- Monthly P&I
- —
- Monthly cashflow
- —
- DSCR
- —
- Eligible?
- —
Short-term bridge; refi at stabilization.
Listing history 17 events
-
2026-06-18days on market $109,900 Active 44 DOM
-
2026-06-17days on market $109,900 Active 43 DOM
-
2026-06-16days on market $109,900 Active 42 DOM
-
2026-06-15days on market $109,900 Active 41 DOM
-
2026-06-13days on market $109,900 Active 39 DOM
-
2026-06-13pricedays on market $109,900 Active 38 DOM
-
2026-06-09days on market $116,000 Active 35 DOM
-
2026-06-08days on market $116,000 Active 34 DOM
-
2026-06-07days on market $116,000 Active 33 DOM
-
2026-06-04days on market $116,000 Active 30 DOM
-
2026-06-03days on market $116,000 Active 29 DOM
-
2026-06-02days on market $116,000 Active 28 DOM
-
2026-06-01days on market $116,000 Active 27 DOM
-
2026-05-31days on market $116,000 Active 26 DOM
-
2026-05-12price $116,000 834-char remark
-
2026-05-06$123,000 Active 834-char remark
-
2026-05-04historical $123,000 834-char remark
ⓘ Source: listings_history table (triggers on properties + properties_extension) + one-shot
backfill from property_details.listing_events for pre-trigger history.
Tax reassessment forecast PA · Partial reset (capped growth)
- Current annual tax
- $363 · $30/mo
- Projected year-2 tax
- $1,050 · $87/mo
- Expected delta
- +$687/yr (+$57/mo · 189.0%)
ⓘ Screening estimate from a state-policy table — verify with the county assessor before closing.
Climate risk First Street
- Flood 1/10 Low FEMA zone X (unshaded) · 0% chance over 30 yrs
- Wildfire 1/10 Low
- Heat 5/10 Major 7 d/yr ≥100°F today · 14 d/yr by 30 yrs out
- Wind 6/10 Major 27% chance of damaging wind over 30 yrs
- Air quality 2/10 Low 1 unhealthy d/yr today · 3 by 30 yrs out
Nearby sold comps map
Loading sold comps map…
Walkable amenities ~0.75 mi
Loading nearby amenities…
Taxation est. · year 1
- Rental income
- $24,583
- − Mortgage interest
- −$6,156
- − Property taxes
- −$363
- − Insurance
- −$550
- − Repairs & maintenance
- −$1,967
- − Management
- −$1,967
- − Depreciation
- −$3,197
- Taxable income
- $10,384
- Est. tax owed @ 24.0%
- −$2,492
- After-tax cash flow
- $9,100/yr
For passive investors: Depreciation is non-cash, so a rental often shows a tax loss while cash-flowing — sheltering income. Rental losses are passive: they offset passive income freely, and up to $25,000/yr can offset ordinary (W-2) income if you actively participate and your MAGI is under $100k (phasing out to $0 by $150k); unused losses carry forward. On sale, claimed depreciation is recaptured at up to 25%, and gains may owe capital-gains tax (a 1031 exchange can defer both). Figures are a year-1 estimate at your 24.0% rate — not tax advice; consult a CPA.
Schools (NCES district)
- District
- Octorara Area SD
- NCES district ID
- 4218030
- Math proficiency
- 33% ▼ -11.00%
- Reading proficiency
- 51% ▼ -13.00%
- Median HH income
- $65,710
- Composite
- 37.59/100
- National rank
- #4383
- State rank
- #286 of 539 in PA
Livability — Cochranville
- Score
- 60/100
- State rank
- #1455
- US rank
- #18701
Category grades
Schools grade is shown separately in the Schools card above.
Census & demographics
- Population (ZIP)
- 5,678
Population outlook (Chester County) Hauer SSP2
- Today (2025)
- 546,756 people
- By 2030
- 559,441 · +2.3%
- By 2040
- 576,377 · +5.4%
- By 2050
- 580,602 · +6.2%
- By 2075
- 581,575 · +6.4%
- By 2100
- 540,922 · -1.1%
Race, ethnicity, and origin ACS 2023
- Neighborhood character
- Predominantly White (77%)
- Race & ethnicity
- White 77% Hispanic / Latino 17% Two or more races 9% Black 2% Asian 1%
- Hispanic origin (detail)
- Mexican 14% Puerto Rican 3%
- Common ancestry
- Polish 5% Romanian 3% Slovak 3%
- Foreign-born
- 11% · Canada, Dominican Republic
- Languages at home
- 81% English-only · Spanish 13% German/W. Germanic 4% Other Indo-European 1%
Political lean MEDSL · Chester
- 2024 margin
- D (+14.5) · D 56.7% · R 42.2% · Other 1.0%
- 2008→2024 swing
- +5.2pp toward D · 2008: 9.2pp · 2024: 14.5pp
- All cycles
- 2024: D+14.5 2020: D+17.0 2016: D+9.2 2012: R+0.4 2008: D+9.2
Not yet ingested
- Civics
- —
Market trends
- HPI YoY
- ▼ -0.39%
- Current HPI
- 278.0929
- Rent YoY
- —
- Metro
- —
- State GDP YoY
- ▲ 1.68%
- F500 in state
- 34
Industry mix (Fortune 500 HQ in PA)
| Industry | F500 HQs | Revenue |
|---|---|---|
| Healthcare | 2 | $309B |
|
||
| Insurance | 2 | $27B |
|
||
| Telecommunications / Media | 1 | $124B |
|
||
| Industrial Distribution | 1 | $22B |
|
||
| Financial Services | 1 | $20B |
|
||
| Chemicals / Materials | 1 | $18B |
|
||
Price history
-10.7% since first listed4 events — show timeline
- 2026-06-11 Price Changed $109,900 BRIGHT MLS
- 2026-05-12 Price Changed $116,000 BRIGHT MLS
- 2026-05-06 Listed $123,000 BRIGHT MLS
- 2026-05-04 Coming Soon $123,000 BRIGHT MLS
Property tax history
-5.5%/yrLatest (2026): $363 · +2.5% YoY. Source: county tax records.
Cash-flow waterfall
monthlySold comps — $/sqft
last 12 mo · ≤1 miLoading sold comps…