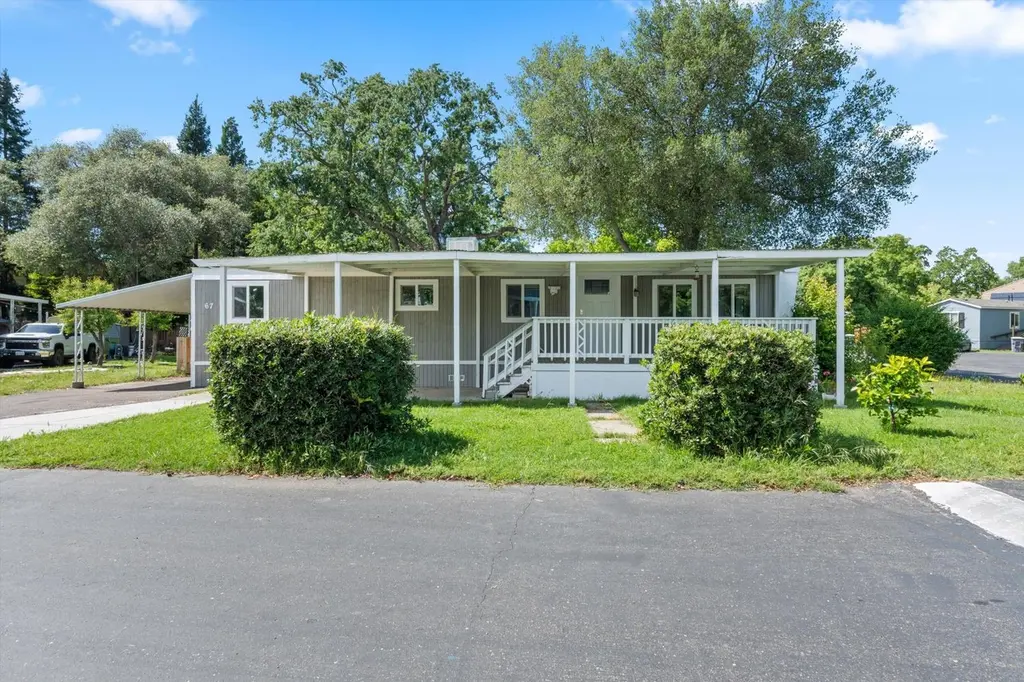
6805 Douglas Blvd #67 · Granite Bay, CA
Flood risk No data
- FEMA flood zone
- —
- Chance of flooding over 30 yrs
- —
- Est. flood insurance / yr
- —
Fire risk No data
- Est. fire insurance / yr
- —
Heat risk No data
- Hot days now (above threshold)
- —
- Hot days in 30 yrs
- —
Wind risk No data
- Chance of severe wind over 30 yrs
- —
Air-quality risk No data
- Unhealthy air days now
- —
- Unhealthy air days in 30 yrs
- —
Risk factors via First Street. Map © Google.
Why this score? — see what drove the C- grade
The composite is a weighted blend of 9 inputs, each scored 0–100. Each bar is that input's sub-score; the figure is the points it added to the 100-point composite (weight × sub-score).
- Cash flow +15.0/30.0
- ARV discount +14.9/15.0
- Schools +6.2/10.0
- 1% rule +5.0/10.0
- DSCR +5.0/10.0
- Livability +3.2/5.0
- Rent growth +2.5/5.0
- Condition / age +2.5/5.0
- Appreciation +0.0/10.0
$79,500
🖨 Deal sheet 📄 Offer letter ✓ Due diligence
Listing remarks
Welcome to this beautifully updated home located in the highly desirable Granite Bay Estates community in Granite Bay. Situated just minutes from Folsom Lake, scenic walking and biking trails, shopping, dining, and recreation, this move-in-ready property offers comfort, convenience, and an exceptional lifestyle. Inside, you'll find numerous upgrades throughout, including a centralized heating and cooling system, remodeled kitchen featuring modern IKEA cabinetry, a new dishwasher, updated flooring, new interior doors, and a new front entry door. Additional improvements include new siding, dual-pane windows, new washer and dryer, and updated shower sliding doors, creating a fresh and modern f
Key facts
- New front entry door
- Remodeled kitchen
- Updated home
Tags
Property features AI
Finance
- Financial info: Land lease: No (listed land lease amount present in source but excluded per instructions)
- HOA & community: No association
Exterior
- Parking: Attached covered parking
- Utilities: Public water; Public sewer; Electric: Other; Utilities: see remarks
- Home design: Manufactured in-park home; Single wide; Built in 1965
- Construction: Metal roof; Wood skirting; Sahara manufactured home
- Exterior features: Corner lot; Landscaped front yard; Landscaped back yard; Close to clubhouse; Storage shed(s)
Interior
- Kitchen: Laminate counters; Free standing gas range; Free standing refrigerator; Hood over range; Dishwasher
- Bedrooms: 4 bedrooms
- Flooring: See remarks
- Bathrooms: 2 full bathrooms; Tub with shower over
- Heating & cooling: Central heating; Central air conditioning
- Interior features: Porch; Storage area
- Laundry & utility: Laundry closet inside the home
Neighborhood map
What this means for you Summary
Snapshot
- This is a 4-bed/2.0-bath manufactured listed at $80k.
Deal economics
- At list price, monthly cash flow is $3k ($31k/yr) — positive.
- The deal already cash-flows at list — no discount required.
- Meets the 1% rule at list price ($4k rent vs $80k).
- Recommended offer: $77k (3.0% below list) — sets the bar for market timing.
- Cap rate 45.6% vs local median 1.2% in Granite Bay — top-decile yield for the area; either an underpriced asset or a hidden risk that comps aren't pricing in. Stress-test before assuming the spread holds.
Location & tenants
- Location reads 65/100 on livability (#386 in CA) — a middle-class / working-renter tenant base. Strengths: schools A+, employment A+, housing A+; Watch: amenities F, commute F, cost of living F.
- Eureka Union (suburban): math 61% / reading 74% proficiency, ranked #48 of 517 in CA (top 9%) — acceptable for families but not a draw, mixed tenant base, ~2y average lease; only 8% free/reduced lunch — higher-income household profile.
- Market conditions: 164 active listings in the ZIP; high-income renter base; 3,535 units permitted in Placer County in 2024 (689 in 5+ unit buildings).
Forward outlook
- Local home prices are declining (-3.0%/yr); year-one equity from $550 of loan paydown is wiped out by about $2k of value loss. Plan a longer hold.
- Placer County population projected at +20% by 2050 — long-run rental-demand tailwind backs the buy-and-hold thesis.
- At projected returns (-3.0% appreciation + 3.0% rent growth), your $22k cash investment doubles in ~1 year — after that, you're playing with house money.
Negotiation context
- It's been on market 41 days — a 3% lower offer ($77k) is reasonable based on typical stale-listing flexibility.
Questions for the listing agent
- It's been on market 41 days. Have you received any prior offers? Is the seller open to a 3% concession, seller financing, or rate buy-down credit?
- Built in 1965 — when were the roof, HVAC, electrical panel, plumbing, and water heater last replaced?
- Is there a deadline driving the sale (1031 exchange, divorce, estate, relocation)? That informs how much negotiation room exists.
- Schools are A-rated — typically a magnet for longer-tenancy family renters. What's the average tenant stay here, and is there a school-zone premium baked into asking?
- What's the average days-on-market for RENTAL listings here right now (not sales)? A rising rental-DOM trend means longer vacancies and softer asking-rent achievability than the comps imply.
- What's the recent tenant-quality profile in this submarket — average credit score on applications, eviction rate, late-payment / NSF rate, and stable-employment percentage? A property-management company in the area should have these aggregated.
- How much new for-sale + rental construction is in the pipeline within 1–3 miles? Heavy new supply typically softens prices + rents 12–24 months out; constrained supply supports both.
Investment metrics
- 1% rule
- 5.02% ✓
- Cap rate
- 45.59%
- Cash-on-cash
- 140.34%
- DSCR
- 7.24
- GRM
- 1.7
CMA / ARV
- ARV (on-the-fly)
- $95,040
- Comps found
- 1
Show comp detail 1 sale within ~0.75 mi
| Address | Dist | Beds/Ba | Sqft | Sold | Price | $/sf | Match |
|---|---|---|---|---|---|---|---|
| 6805 Douglas Blvd #83 | 0.00mi | 3/2.0 (-1) | 1,080 (+12%) | 19mo | $107,000 | $99 | 58 |
Match score weights: distance 35% · size 25% · config 20% · recency 20%. Top-matched comps best support the ARV.
Projected returns pro-forma
-3.0% appreciation · 3.0% rent growth · sell at horizon
- IRR
- —
- Equity multiple
- 7.87×
- Total profit
- $152,980
- Equity at exit
- $11,854
- IRR
- —
- Equity multiple
- 16.59×
- Total profit
- $346,954
- Equity at exit
- $6,874
Cash invested: $22,260 (down + closing). Projections, not guarantees.
Landlord ↔ Tenant lean methodology
- Overall (STATE)
- 18 Strongly Tenant-Friendly
- State California
- 18 Strongly Tenant-Friendly · D+13
- County
- — inherits STATE
- City
- — inherits STATE
ZIP-level market 95746
- Active inventory
- 164
- Price-to-rent
- 1.7×
Monthly cashflow live
- Estimated rent
- $3,991 medium interval (Pro) →
- Mortgage (P&I)
- −$417
- Tax est. 1.5%
- −$99 /mo · $1,192/yr
- Insurance
- −$33
- HOA
- −$0
- Vacancy / Maint / Mgmt
- −$838
- Net cashflow
- $2,603
Break-even live
UW: 25.0% down · 7.5% · 30yr · 1.5% tax · 5.0% vac · 8.0% maint · 8.0% mgmt
Financing live
Cash to close
- Down payment
- $19,875
- Closing costs
- $2,385
- Reserves months
- —
- Total cash needed
- —
Loan-product check · same deal, 3 products live
Conventional
25% down · 7.5% · 30yr
- Down + closing
- —
- Monthly P&I
- —
- Monthly cashflow
- —
- DSCR
- —
- Eligible?
- —
Personal DTI + credit; lowest rate.
DSCR
20% down · 8.5% · 30yr
- Down + closing
- —
- Monthly P&I
- —
- Monthly cashflow
- —
- DSCR
- —
- Eligible?
- —
No personal income docs; deal must DSCR.
Hard money
10% down · 12.0% · 12mo
- Down + closing
- —
- Monthly P&I
- —
- Monthly cashflow
- —
- DSCR
- —
- Eligible?
- —
Short-term bridge; refi at stabilization.
Listing history 8 events
-
2026-06-13statusdays on market $79,500 Pending 41 DOM
-
2026-06-09days on market $79,500 Active 39 DOM
-
2026-06-08days on market $79,500 Active 38 DOM
-
2026-06-07days on market $79,500 Active 37 DOM
-
2026-06-03days on market $79,500 Active 33 DOM
-
2026-06-02days on market $79,500 Active 32 DOM
-
2026-06-01days on market $79,500 Active 31 DOM
-
2026-05-31days on market $79,500 Active 30 DOM
ⓘ Source: listings_history table (triggers on properties + properties_extension) + one-shot
backfill from property_details.listing_events for pre-trigger history.
Nearby sold comps map
Loading sold comps map…
Walkable amenities ~0.75 mi
Loading nearby amenities…
Taxation est. · year 1
- Rental income
- $47,888
- − Mortgage interest
- −$4,453
- − Property taxes
- −$1,192
- − Insurance
- −$398
- − Repairs & maintenance
- −$3,831
- − Management
- −$3,831
- − Depreciation
- −$2,313
- Taxable income
- $31,870
- Est. tax owed @ 24.0%
- −$7,649
- After-tax cash flow
- $23,590/yr
For passive investors: Depreciation is non-cash, so a rental often shows a tax loss while cash-flowing — sheltering income. Rental losses are passive: they offset passive income freely, and up to $25,000/yr can offset ordinary (W-2) income if you actively participate and your MAGI is under $100k (phasing out to $0 by $150k); unused losses carry forward. On sale, claimed depreciation is recaptured at up to 25%, and gains may owe capital-gains tax (a 1031 exchange can defer both). Figures are a year-1 estimate at your 24.0% rate — not tax advice; consult a CPA.
Schools (NCES district)
- District
- Eureka Union
- NCES district ID
- 0613080
- Math proficiency
- 61% ▼ -8.00%
- Reading proficiency
- 74% ▼ -5.00%
- Median HH income
- $103,282
- Composite
- 62.34/100
- National rank
- #695
- State rank
- #48 of 517 in CA
Livability — Granite Bay
- Score
- 65/100
- State rank
- #386
- US rank
- #13127
Category grades
Schools grade is shown separately in the Schools card above.
Census & demographics
- Census place
- Granite Bay, CA
- County
- Placer County · 390,510 people
- City population
- 22,985
- Metro
- Sacramento-Roseville-Folsom, CA
- Population (ZIP)
- 22,985
- Household income
- $183,305
- Rent vs Own
- Severe rent burden
- 176.0
Population outlook (Placer County) Hauer SSP2
- Today (2025)
- 422,709 people
- By 2030
- 444,249 · +5.1%
- By 2040
- 480,192 · +13.6%
- By 2050
- 506,390 · +19.8%
- By 2075
- 550,219 · +30.2%
- By 2100
- 547,760 · +29.6%
Race, ethnicity, and origin ACS 2023
- Neighborhood character
- Predominantly White (72%)
- Race & ethnicity
- White 72% Asian 10% Hispanic / Latino 10% Two or more races 8% Black 3%
- Hispanic origin (detail)
- Mexican 6%
- Common ancestry
- Lithuanian 3% Slovak 3% Romanian 3%
- Foreign-born
- 11% · Canada, China, Vietnam
- Languages at home
- 85% English-only · Spanish 4% Other Indo-European 4% Chinese 1%
Political lean MEDSL · Placer
- 2024 margin
- Lean R (+8.5) · D 44.3% · R 52.8% · Other 2.9%
- 2008→2024 swing
- +2.8pp toward D · 2008: -11.3pp · 2024: -8.5pp
- All cycles
- 2024: R+8.5 2020: R+6.7 2016: R+11.3 2012: R+20.1 2008: R+11.3
Not yet ingested
- Civics
- —
Market trends
- HPI YoY
- ▼ -664.09%
- Current HPI
- 264.5367
- Rent YoY
- —
- Metro
- Sacramento-Roseville-Folsom, CA
- State GDP YoY
- ▲ 3.21%
- F500 in state
- 116
Industry mix (Fortune 500 HQ in CA)
| Industry | F500 HQs | Revenue |
|---|---|---|
| Technology | 27 | $1,492B |
|
||
| Financial Services | 3 | $174B |
|
||
| Retail | 3 | $44B |
|
||
| Insurance | 3 | $26B |
|
||
| Media / Entertainment | 2 | $115B |
|
||
| Pharmaceuticals / Biotech | 2 | $62B |
|
||
Cash-flow waterfall
monthlySold comps — $/sqft
last 12 mo · ≤1 miLoading sold comps…