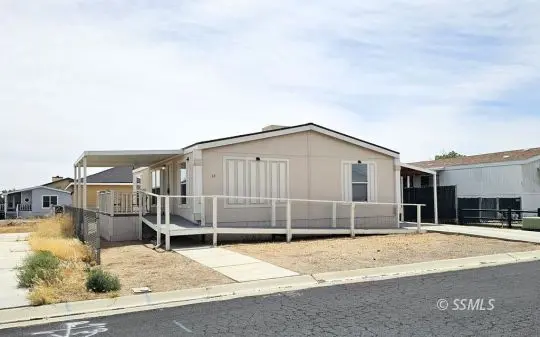
620 W Upjohn Ave #43 · Ridgecrest, CA
Flood risk 1/10 · Minimal
- FEMA flood zone
- X (unshaded)
- Chance of flooding over 30 yrs
- 0.0%
- Est. flood insurance / yr
- $507 – $1,088
Fire risk 3/10 · Minor
- Est. fire insurance / yr
- $659 – $1,223
Heat risk 8/10 · Major
- Hot days now (above 105°F)
- 7 days/yr
- Hot days in 30 yrs
- 21 days/yr
Wind risk 1/10 · Minimal
- Chance of severe wind over 30 yrs
- —
Air-quality risk 7/10 · Major
- Unhealthy air days now
- 14 days/yr
- Unhealthy air days in 30 yrs
- 15 days/yr
Risk factors via First Street. Map © Google.
Why this score? — see what drove the D- grade
The composite is a weighted blend of 9 inputs, each scored 0–100. Each bar is that input's sub-score; the figure is the points it added to the 100-point composite (weight × sub-score).
- Cash flow +12.8/30.0
- ARV discount +7.5/15.0
- DSCR +3.8/10.0
- 1% rule +3.6/10.0
- Livability +3.5/5.0
- Rent growth +3.4/5.0
- Schools +2.9/10.0
- Condition / age +2.5/5.0
- Appreciation +0.0/10.0
$159,000
🖨 Deal sheet (PDF) 📄 Offer letter ✓ Due diligence
Listing remarks
Great home in Boulder Pointe, where you own your own land, no space rent. This 1080 sq ft home has 3 comfortable bedrooms and 2 bathrooms, each with a tub. High vaulted ceilings make the living space roomy and bright. The home has a split floor plan, with a master bedroom/bath on one end and two guest bedrooms and a second bathroom on the other. Indoor laundry room. Large front deck. Wheelchair access front entry. Covered carport and fenced backyard with a metal shed. Newer roof and evaporative cooler. Maintained and Quiet neighborhood. Move-in ready. Short drive to the Naval Air Weapons Station, China Lake ( NAWS ) . Check out the video walkthrough: https://youtu. be/EYMqvaZRTAg?si=0hsUnoU
Key facts
- Own your own land
- Covered carport
- Split floor plan
Tags
Property features AI
Finance
- Other: Directions: W Upjohn Ave to Boulder Point Mobilehome Park; take the middle road (S Sierra Vista St) to #43 on the right
- HOA & community: Homeowners association with a $46 monthly fee
Exterior
- Utilities: Public water; Sewer connected; Natural gas connected
- Home design: Manufactured double-wide home; Residential property; Located in Boulder Pointe subdivision; Zoned R3
- Construction: Wood siding; Composition/shingle roof; Permanent foundation; Built as affixed manufactured home
- Exterior features: Deck; Covered patio/porch; Patio; Partial fencing; Shed(s)
Interior
- Kitchen: Dishwasher; Range; Oven; Refrigerator
- Flooring: Carpet; Vinyl
- Bathrooms: 2 full bathrooms
- Heating & cooling: Forced air heating (natural gas); Evaporative cooling
- Interior features: Vaulted ceilings; Walk-in closets; Crawl space foundation
- Laundry & utility: Washer and dryer included; Natural gas connected
Neighborhood map
What this means for you Summary
Snapshot
- This is a 3-bed/2.0-bath manufactured listed at $159k.
Deal economics
- At list price, monthly cash flow is $-14 ($-168/yr) — negative.
- To cash-flow at today's rent, offer at most $157k (1.6% below list).
- To meet the 1% rule (rent ≥ 1% of price), the offer needs to be $137k (14.1% below list).
- Recommended offer: $137k (14.1% below list) — sets the bar for 1% rule.
- Cap rate 6.2% vs local median 4.0% in Ridgecrest — top-decile yield for the area; either an underpriced asset or a hidden risk that comps aren't pricing in. Stress-test before assuming the spread holds.
Location & tenants
- Location reads 70/100 on livability (#243 in CA) — a middle-class / working-renter tenant base. Strengths: commute A+, housing A+; Watch: amenities D+, cost of living D+, crime F.
- Sierra Sands Unified (town): math 25% / reading 39% proficiency, ranked #294 of 517 in CA (top 57%) — families likely to look elsewhere, expect single-tenant / working-renter base with shorter leases.
- Zoned schools: Faller Elementary (math 21% / reading 37%, grade F, #891 of 1,571 statewide, top 57%, 538 students, 48% FRL); James Monroe Middle (math 16% / reading 29%, grade F, #382 of 498 statewide, top 78%, 548 students, 49% FRL); Burroughs High (math 37% / reading 70%, grade C-, #281 of 1,170 statewide, top 24%, 1,479 students, 40% FRL) — zoned schools at 46% FRL track the district average.
- Market conditions: Rents rising (+3.6%/yr); 332 active listings in the ZIP; 40 comparable units currently listed for rent nearby; rentals leasing fast (median 5d on market — plan ~1-2 weeks tenant-placement turnaround); solid renter incomes; 3,244 units permitted in Kern County in 2024 (73 in 5+ unit buildings).
Forward outlook
- Local home prices are declining (-3.0%/yr); year-one equity from $1k of loan paydown is wiped out by about $5k of value loss. Plan a longer hold.
- Kern County population projected at +17% by 2050 — long-run rental-demand tailwind backs the buy-and-hold thesis.
Negotiation context
- It's been on market 26 days — a 2% lower offer ($157k) is reasonable based on typical stale-listing flexibility.
- Current owner paid $80k; list at $159k implies a 99% gain — meaningful room to come down on a strong offer.
Risks & watch-outs
- Climate carrying-cost: extreme-heat days projected 7→21/yr by 2055 (HVAC capex compounding) — expect insurance premiums to compound above CPI over the hold.
Questions for the listing agent
- What do current leases actually rent for vs. the listed asking? Can we see a recent rent roll and the last 12 months of T-12 income?
- What does the HOA fee cover, when was the last increase, and are there any pending special assessments or reserve-fund shortfalls?
- Is there a deadline driving the sale (1031 exchange, divorce, estate, relocation)? That informs how much negotiation room exists.
- Crime grade is F in this area — have there been break-ins, vandalism, or insurance claims at this property in the last 3 years? What carrier currently insures it and at what premium?
- The area grade is low — what's the realistic commute time and amenity access for the typical tenant pool here? Any planned neighborhood developments (good or bad) we should know about?
- What's the average days-on-market for RENTAL listings here right now (not sales)? A rising rental-DOM trend means longer vacancies and softer asking-rent achievability than the comps imply.
- What's the recent tenant-quality profile in this submarket — average credit score on applications, eviction rate, late-payment / NSF rate, and stable-employment percentage? A property-management company in the area should have these aggregated.
- How much new for-sale + rental construction is in the pipeline within 1–3 miles? Heavy new supply typically softens prices + rents 12–24 months out; constrained supply supports both.
Investment metrics
- 1% rule
- 0.86% ✗
- Cap rate
- 6.19%
- Cash-on-cash
- -0.38%
- DSCR
- 0.98
- GRM
- 9.7
CMA / ARV
No comps found within radius.
Projected returns pro-forma
-3.0% appreciation · 3.58% rent growth · sell at horizon
- IRR
- -16.3%
- Equity multiple
- 0.42×
- Total profit
- $-25,839
- Equity at exit
- $23,707
- IRR
- -7.0%
- Equity multiple
- 0.55×
- Total profit
- $-20,255
- Equity at exit
- $13,747
Cash invested: $44,520 (down + closing). Projections, not guarantees.
Landlord ↔ Tenant lean methodology
- Overall (STATE)
- 18 Strongly Tenant-Friendly
- State California
- 18 Strongly Tenant-Friendly · D+13
- County
- — inherits STATE
- City
- — inherits STATE
ZIP-level market 93555
- Home prices YoY
- -24.0%
- Rents YoY
- 3.6%
- Active inventory
- 332
- Price-to-rent
- 9.7×
Monthly cashflow live
- Estimated rent
- $1,365 high interval (Pro) →
- Mortgage (P&I)
- −$834
- Tax from tax record
- −$146 /mo · $1,757/yr
- Insurance
- −$66
- HOA
- −$46
- Vacancy / Maint / Mgmt
- −$287
- Net cashflow
- $-14
Break-even live
Sensitivity live
| Price | -10% $76 | -5% $31 | +0% $-14 | +5% $-59 | +10% $-104 |
|---|---|---|---|---|---|
| Rent | -10% $-122 | -5% $-68 | +0% $-14 | +5% $40 | +10% $94 |
| Rate | -1.0pp $66 | -0.5pp $26 | base $-14 | +0.5pp $-55 | +1.0pp $-97 |
UW: 25.0% down · 7.5% · 30yr · 1.5% tax · 5.0% vac · 8.0% maint · 8.0% mgmt
Financing live
Cash to close
- Down payment
- $39,750
- Closing costs
- $4,770
- Reserves months
- —
- Total cash needed
- —
Loan-product check · same deal, 3 products live
Conventional
25% down · 7.5% · 30yr
- Down + closing
- —
- Monthly P&I
- —
- Monthly cashflow
- —
- DSCR
- —
- Eligible?
- —
Personal DTI + credit; lowest rate.
DSCR
20% down · 8.5% · 30yr
- Down + closing
- —
- Monthly P&I
- —
- Monthly cashflow
- —
- DSCR
- —
- Eligible?
- —
No personal income docs; deal must DSCR.
Hard money
10% down · 12.0% · 12mo
- Down + closing
- —
- Monthly P&I
- —
- Monthly cashflow
- —
- DSCR
- —
- Eligible?
- —
Short-term bridge; refi at stabilization.
Rent comps 40 comps
| Address | Beds | Baths | Sqft | Rent | $/sqft | DOM | Units | Dist |
|---|---|---|---|---|---|---|---|---|
| 413 S Sunset St Unit C Ridgecrest, CA | 2.0 | 1.0 | 900 | $1,050 | $1.17 | 4d | 1 | 0.09mi |
| 740 W Church Ave Ridgecrest, CA | 4.0 | 2.0 | 1500 | $1,800 | $1.20 | 21d | 1 | 0.19mi |
| 430 W Wilson Ave Ridgecrest, CA | 3.0 | 1.0 | 1080 | $1,350 | $1.25 | 4d | 1 | 0.27mi |
| 424 W Wilson Ave Unit A Ridgecrest, CA | 2.0 | 1.0 | 900 | $995 | $1.11 | 4d | 1 | 0.29mi |
| 139 S Norma St Unit B Ridgecrest, CA | 2.0 | 1.0 | 810 | $950 | $1.17 | 4d | 1 | 0.33mi |
| 135 S Norma St Apt A Ridgecrest, CA | 2.0 | 1.0 | 810 | $975 | $1.20 | 4d | 1 | 0.34mi |
| 327 W Haloid Ave Ridgecrest, CA | 2.0 | 1.5 | 800 | $1,100 | $1.38 | 4d | 1 | 0.40mi |
| 308 W Wilson Ave Apt B Ridgecrest, CA | 2.0 | 1.0 | 880 | $1,275 | $1.45 | 4d | 1 | 0.44mi |
| 707 S Norma St Ridgecrest, CA | 2.0 | 1.0 | 950 | $1,000 | $1.05 | 4d | 1 | 0.45mi |
| 311 W Church Ave Unit B Ridgecrest, CA | 2.0 | 1.0 | 780 | $1,475 | $1.89 | 4d | 1 | 0.46mi |
| 235 W Robertson Rd Ridgecrest, CA | 2.0 | 1.0 | 725 | $1,250 | $1.72 | 4d | 1 | 0.50mi |
| 741 S Allen St Unit B Ridgecrest, CA | 2.0 | 1.0 | 700 | $950 | $1.36 | 45d | 1 | 0.51mi |
| 736 S Norma St Unit C Ridgecrest, CA | 2.0 | 1.0 | 800 | $1,000 | $1.25 | 4d | 1 | 0.54mi |
| 219 W Robertson Rd Ridgecrest, CA | 3.0 | 1.0 | 955 | $1,200 | $1.26 | 21d | 1 | 0.55mi |
| 824 S Norma St Unit 832A Ridgecrest, CA | 3.0 | 2.0 | 925 | $1,650 | $1.78 | 4d | 1 | 0.58mi |
| 824 S Norma St Unit 804B Ridgecrest, CA | 2.0 | 2.0 | 850 | $1,550 | $1.82 | 4d | 1 | 0.58mi |
| 824 S Norma St Unit 848A Ridgecrest, CA | 2.0 | 1.0 | 800 | $1,350 | $1.69 | 4d | 1 | 0.58mi |
| 824 S Norma St Unit 848B Ridgecrest, CA | 2.0 | 1.0 | 800 | $1,350 | $1.69 | 25d | 1 | 0.58mi |
| 204 W Robertson Rd Apt C Ridgecrest, CA | 2.0 | 1.0 | 1215 | $1,150 | $0.95 | 45d | 1 | 0.59mi |
| 804 S Nevada St Ridgecrest, CA | 4.0 | 2.0 | 1470 | $1,900 | $1.29 | 45d | 1 | 0.62mi |
| 141 W Upjohn Ave Unit 109 Ridgecrest, CA | 2.0 | 2.0 | 1000 | $1,100 | $1.10 | 4d | 1 | 0.64mi |
| 201 N Alvord St Apt E Ridgecrest, CA | 2.0 | 1.0 | 768 | $925 | $1.20 | 4d | 1 | 0.64mi |
| 1000 W Coronado Ave Ridgecrest, CA | 3.0 | 2.0 | 1161 | $1,600 | $1.38 | 45d | 1 | 0.68mi |
| 1217 W Upjohn Ave Ridgecrest, CA | 3.0 | 1.0 | 936 | $950 | $1.01 | 4d | 1 | 0.71mi |
| 922 W Vulcan Ave Ridgecrest, CA | 3.0 | 2.0 | 1458 | $2,100 | $1.44 | 45d | 1 | 0.76mi |
| 401 N Norma St Ridgecrest, CA | 3.0 | 2.0 | 1360 | $1,500 | $1.10 | 4d | 1 | 0.80mi |
| 1205 W Mariposa Ave Unit B Ridgecrest, CA | 3.0 | 2.0 | 1300 | $1,550 | $1.19 | 4d | 1 | 0.83mi |
| 332 N Alvord St Unit A Ridgecrest, CA | 2.0 | 2.0 | 1000 | $950 | $0.95 | 25d | 1 | 0.86mi |
| 332 N Alvord St Unit 332 Ridgecrest, CA | 3.0 | 2.0 | 1100 | $1,100 | $1.00 | 45d | 1 | 0.86mi |
| 920 W Perch Ave Ridgecrest, CA | 3.0 | 2.0 | 1326 | $1,450 | $1.09 | 13d | 1 | 0.87mi |
| 1128 Argus Ave Ridgecrest, CA | 3.0 | 2.0 | 1346 | $11,800 | $8.77 | 45d | 1 | 0.88mi |
| 228 S Gemstone St Unit B Ridgecrest, CA | 2.0 | 1.0 | 891 | $1,000 | $1.12 | 4d | 1 | 0.88mi |
| 205 E Upjohn Ave Ridgecrest, CA | 2.0 | 2.5 | 1288 | $1,225 | $0.95 | 45d | 1 | 0.92mi |
| 1340 W Mariposa Ave Unit 1 Ridgecrest, CA | 2.0 | 1.0 | 780 | $1,495 | $1.92 | 4d | 1 | 0.94mi |
| 247 E Upjohn Ave Ridgecrest, CA | 3.0 | 2.5 | 1305 | $1,425 | $1.09 | 4d | 1 | 0.94mi |
| 255 E Upjohn Ave Ridgecrest, CA | 2.0 | 2.5 | 1258 | $1,350 | $1.07 | 4d | 1 | 0.96mi |
| 520 Silveridge St Ridgecrest, CA | 3.0 | 2.0 | 1471 | $2,000 | $1.36 | 45d | 1 | 1.01mi |
| 117 S Silver Ridge St Ridgecrest, CA | 3.0 | 2.0 | 1144 | $1,500 | $1.31 | 45d | 1 | 1.02mi |
| 1140 College Heights Blvd Ridgecrest, CA | 2.0 | 1.0 | 950 | $1,050 | $1.11 | 4d | 1 | 1.19mi |
| 238 N Gold Canyon St Unit C537A Ridgecrest, CA | 3.0 | 1.0 | 1030 | $1,445 | $1.40 | 4d | 1 | 1.22mi |
HOA detail
- Monthly dues
- $46 · $552/yr
Listing history 19 events
-
2026-06-21days on market $159,000 Active 26 DOM
-
2026-06-18days on market $159,000 Active 23 DOM
-
2026-06-17days on market $159,000 Active 22 DOM
-
2026-06-16days on market $159,000 Active 21 DOM
-
2026-06-15days on market $159,000 Active 20 DOM
-
2026-06-14days on market $159,000 Active 18 DOM
-
2026-06-13days on market $159,000 Active 17 DOM
-
2026-06-10days on market $159,000 Active 15 DOM
-
2026-06-09days on market $159,000 Active 14 DOM
-
2026-06-08days on market $159,000 Active 13 DOM
-
2026-06-07days on market $159,000 Active 12 DOM
-
2026-06-05days on market $159,000 Active 9 DOM
-
2026-06-03days on market $159,000 Active 8 DOM
-
2026-06-03days on market $159,000 Active 7 DOM
-
2026-06-01days on market $159,000 Active 6 DOM
-
2026-05-31days on market $159,000 Active 5 DOM
-
2026-05-26$159,000 Active
-
2010-01-21soldstatus $80,000
-
2004-01-21soldstatus $97,000
ⓘ Source: listings_history table (triggers on properties + properties_extension) + one-shot
backfill from property_details.listing_events for pre-trigger history.
Tax reassessment forecast CA · Resets to sale price
- Current annual tax
- $1,757 · $146/mo
- Projected year-2 tax
- $1,757 · $146/mo
- Expected delta
- $0/yr ($0/mo · 0.0%)
ⓘ Screening estimate from a state-policy table — verify with the county assessor before closing.
Climate risk First Street
- Flood 1/10 Low FEMA zone X (unshaded) · 0% chance over 30 yrs
- Wildfire 3/10 Moderate
- Heat 8/10 Severe 7 d/yr ≥105°F today · 21 d/yr by 30 yrs out
- Wind 1/10 Low
- Air quality 7/10 Severe 14 unhealthy d/yr today · 15 by 30 yrs out
Nearby sold comps map
Loading sold comps map…
Walkable amenities ~0.75 mi
Loading nearby amenities…
Taxation est. · year 1
- Rental income
- $16,381
- − Mortgage interest
- −$8,906
- − Property taxes
- −$1,757
- − Insurance
- −$795
- − Repairs & maintenance
- −$1,311
- − Management
- −$1,311
- − HOA
- −$552
- − Depreciation
- −$4,625
- Taxable loss
- −$2,875
- Est. tax savings @ 24.0%
- +$690
- After-tax cash flow
- $522/yr
For passive investors: Depreciation is non-cash, so a rental often shows a tax loss while cash-flowing — sheltering income. Rental losses are passive: they offset passive income freely, and up to $25,000/yr can offset ordinary (W-2) income if you actively participate and your MAGI is under $100k (phasing out to $0 by $150k); unused losses carry forward. On sale, claimed depreciation is recaptured at up to 25%, and gains may owe capital-gains tax (a 1031 exchange can defer both). Figures are a year-1 estimate at your 24.0% rate — not tax advice; consult a CPA.
Schools (NCES district)
- District
- Sierra Sands Unified
- NCES district ID
- 0636800
- Math proficiency
- 25% ▼ -11.00%
- Reading proficiency
- 39% ▼ -11.00%
- Median HH income
- $58,937
- Composite
- 28.66/100
- National rank
- #6699
- State rank
- #294 of 517 in CA
Livability — Ridgecrest
- Score
- 70/100
- State rank
- #243
- US rank
- #8014
Category grades
Schools grade is shown separately in the Schools card above.
Census & demographics
- Census place
- Ridgecrest, CA
- County
- Kern County · 710,371 people
- City population
- 33,845
- Metro
- Bakersfield, CA
- Population (ZIP)
- 33,845
- Household income
- $86,700
- Rent vs Own
- Severe rent burden
- 975.0
Population outlook (Kern County) Hauer SSP2
- Today (2025)
- 947,286 people
- By 2030
- 978,984 · +3.3%
- By 2040
- 1,045,018 · +10.3%
- By 2050
- 1,105,232 · +16.7%
- By 2075
- 1,229,538 · +29.8%
- By 2100
- 1,238,059 · +30.7%
Race, ethnicity, and origin ACS 2023
- Neighborhood character
- Majority White (65%)
- Race & ethnicity
- White 65% Hispanic / Latino 20% Two or more races 12% Black 4% Asian 4% Native American 1%
- Hispanic origin (detail)
- Mexican 15%
- Common ancestry
- Italian 4% Lithuanian 2% Slovak 2%
- Foreign-born
- 7% · Canada
- Languages at home
- 84% English-only · Spanish 11% Other Indo-European 1% Other Asian/Pacific 1%
Political lean MEDSL · Kern
- 2024 margin
- Strong R (+21.1) · D 38.2% · R 59.3% · Other 2.5%
- 2008→2024 swing
- -3.3pp toward R · 2008: -17.8pp · 2024: -21.1pp
- All cycles
- 2024: R+21.1 2020: R+10.2 2016: R+15.0 2012: R+20.9 2008: R+17.8
Not yet ingested
- Civics
- —
Market trends
- HPI YoY
- ▼ -120.17%
- Current HPI
- 380.5208
- Rent YoY
- ▲ 3.58%
- Metro
- Bakersfield, CA
- State GDP YoY
- ▲ 3.21%
- F500 in state
- 116
Industry mix (Fortune 500 HQ in CA)
| Industry | F500 HQs | Revenue |
|---|---|---|
| Technology | 27 | $1,492B |
|
||
| Financial Services | 3 | $174B |
|
||
| Retail | 3 | $44B |
|
||
| Insurance | 3 | $26B |
|
||
| Media / Entertainment | 2 | $115B |
|
||
| Pharmaceuticals / Biotech | 2 | $62B |
|
||
Price history
+63.9% since first listed3 events — show timeline
- 2026-05-26 Listed $159,000 SSMLS
- 2010-01-21 Sold (Public Records) $80,000 Public Records
- 2004-01-21 Sold (Public Records) $97,000 Public Records
Property tax history
+3.8%/yrLatest (2025): $1,757 · +5.1% YoY. Source: county tax records.
Cash-flow waterfall
monthlySold comps — $/sqft
last 12 mo · ≤1 miLoading sold comps…