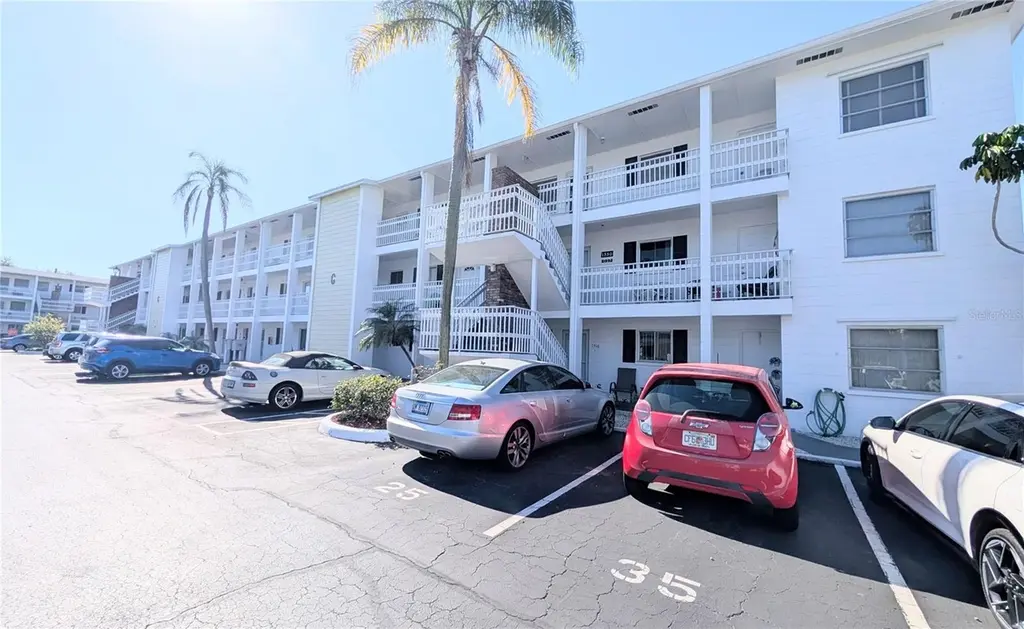
1540 Pleasant Rd Unit G35 · Bayshore Gardens, FL
Flood risk 1/10 · Minimal
- FEMA flood zone
- X (unshaded)
- Chance of flooding over 30 yrs
- 0.0%
- Est. flood insurance / yr
- $507 – $1,088
Fire risk 1/10 · Minimal
- Est. fire insurance / yr
- $947 – $1,759
Heat risk 10/10 · Severe
- Hot days now (above 106°F)
- 7 days/yr
- Hot days in 30 yrs
- 30 days/yr
Wind risk 10/10 · Severe
- Chance of severe wind over 30 yrs
- 99.0%
Air-quality risk 2/10 · Minimal
- Unhealthy air days now
- 1 days/yr
- Unhealthy air days in 30 yrs
- 2 days/yr
Risk factors via First Street. Map © Google.
Why this score? — see what drove the C- grade
The composite is a weighted blend of 9 inputs, each scored 0–100. Each bar is that input's sub-score; the figure is the points it added to the 100-point composite (weight × sub-score).
- Cash flow +17.6/30.0
- 1% rule +9.7/10.0
- ARV discount +7.5/15.0
- DSCR +5.5/10.0
- Schools +4.4/10.0
- Livability +4.1/5.0
- Condition / age +2.5/5.0
- Rent growth +1.1/5.0
- Appreciation +0.0/10.0
$79,900
🖨 Deal sheet 📄 Offer letter ✓ Due diligence
Listing remarks
Exceptional condo that is priced to sell. This cute condo has newer windows, a new electrical panel, a newer hot water heater, a lovely updated bathroom with a one piece tub/shower enclosure. The floors are newer wood look laminate and the walls are freshly painted. The only thing left to do here is to move right in and enjoy the maintenance free lifestyle this community offers. The community also offers very nice amenities including a heated pool, shuffleboard courts, and a very nice clubhouse where you can enjoy many annual events and dinners. The shopping is close at hand with a Publix Grocery Store, T. J. Maxx, Target and several smaller stores and restaurants just across the street. Y
Key facts
- Newer windows
- New electrical panel
- Updated bathroom
Tags
Property features AI
Finance
- Other: Association contact: Seth Perl
- Financial info: Total monthly fees $292; total annual fees $3,504; Lease restrictions apply
- HOA & community: Monthly condo fee of $292; Association requires approval; Association amenities: clubhouse, elevator(s), laundry, pool, shuffleboard court; Association fees include cable TV, common area taxes, pool, structure & grounds maintenance, management, pest control, private road; Community features: buyer approval required, clubhouse, pool, sidewalks; Senior community; No pets allowed
Exterior
- Parking: Assigned parking; Guest parking available
- Utilities: Public water; Public sewer; Electricity connected; Cable available; Water connected; Sewer connected
- Home design: Residential condominium; 3 total stories; unit on third floor; North-facing
- Construction: Block construction; Shingle roof; Slab foundation; Building identifier: G35
- Exterior features: Balcony; Gunite heated in-ground pool
Interior
- Kitchen: Range; Range hood; Electric water heater
- Bedrooms: 1 bedroom (on floor 3)
- Flooring: Laminate
- Bathrooms: 1 full bathroom
- Heating & cooling: No central heating; Wall / window cooling unit(s)
- Interior features: Ceiling fans; Living room / dining room combo; Window treatments; Blinds; Building has elevator
- Laundry & utility: Laundry room
Neighborhood map
What this means for you Summary
Snapshot
- This is a 1-bed/1.0-bath condo listed at $80k.
Deal economics
- At list price, monthly cash flow is $63 ($760/yr) — positive.
- The deal already cash-flows at list — no discount required.
- Meets the 1% rule at list price ($1k rent vs $80k).
- Recommended offer: $75k (6.0% below list) — sets the bar for market timing.
- Cap rate 7.2% vs local median 4.7% in Bayshore Gardens — top-decile yield for the area; either an underpriced asset or a hidden risk that comps aren't pricing in. Stress-test before assuming the spread holds.
Location & tenants
- Location reads 82/100 on livability (#72 in FL, #1,180 nationally) — a professional / high-income tenant draw. Strengths: cost of living A+, housing A+, health & safety A+; Watch: crime C-, commute C-, schools F.
- Manatee (suburban): math 54% / reading 50% proficiency, ranked #26 of 73 in FL (top 36%) — acceptable for families but not a draw, mixed tenant base, ~2y average lease.
- Market conditions: Rents falling (-5.5%/yr); 361 active listings in the ZIP; 26 comparable units currently listed for rent nearby; rentals at typical pace (median 24d on market — plan ~3-4 weeks tenant-placement turnaround); 7,472 units permitted in Manatee County in 2024 (1,782 in 5+ unit buildings).
- This rent runs 31% of the median local income ($45k/yr) — at the standard rent-burdened threshold; future hikes will face affordability resistance.
Forward outlook
- Local home prices are declining (-3.0%/yr); year-one equity from $552 of loan paydown is wiped out by about $2k of value loss. Plan a longer hold.
- Manatee County population projected at +43% by 2050 — long-run rental-demand tailwind backs the buy-and-hold thesis.
Negotiation context
- It's been on market 87 days — a 6% lower offer ($75k) is reasonable based on typical stale-listing flexibility.
- 11 sale attempts since 22y ago; this cycle's ask has dropped $8k (9%) from the opening price — seller is motivated, your offer sets the floor, not the list.
Risks & watch-outs
- Watch-outs: HOA is 25% of rent.
- Climate carrying-cost: severe wind risk, 99% chance of damaging wind over 30y; extreme-heat days projected 7→30/yr by 2055 (HVAC capex compounding) — expect insurance premiums to compound above CPI over the hold.
Questions for the listing agent
- It's been on market 87 days. Have you received any prior offers? Is the seller open to a 6% concession, seller financing, or rate buy-down credit?
- Built in 1966 — when were the roof, HVAC, electrical panel, plumbing, and water heater last replaced?
- What does the HOA fee cover, when was the last increase, and are there any pending special assessments or reserve-fund shortfalls?
- Any open or pending special assessments — roof, HVAC, plumbing, elevator, façade? What's the per-unit balance and payoff schedule, and is the seller paying it off at close or rolling it to the buyer?
- Why hasn't it sold? Are there any deal-killer items the seller is aware of (foundation, flood, title, zoning, code violations)?
- Is there a deadline driving the sale (1031 exchange, divorce, estate, relocation)? That informs how much negotiation room exists.
- Schools are F-rated, which usually means shorter tenancies and higher turnover. Who's the typical renter profile here, and what's been the actual vacancy rate?
- What's the average days-on-market for RENTAL listings here right now (not sales)? A rising rental-DOM trend means longer vacancies and softer asking-rent achievability than the comps imply.
- What's the recent tenant-quality profile in this submarket — average credit score on applications, eviction rate, late-payment / NSF rate, and stable-employment percentage? A property-management company in the area should have these aggregated.
- How much new apartment / multifamily construction is in the pipeline within 1–3 miles? Heavy new supply (>2% of stock underway) typically softens rents 12–24 months out; light construction supports rent growth.
Investment metrics
- 1% rule
- 1.47% ✓
- Cap rate
- 7.24%
- Cash-on-cash
- 3.40%
- DSCR
- 1.15
- GRM
- 5.7
CMA / ARV
No comps found within radius.
Projected returns pro-forma
-3.0% appreciation · 0.0% rent growth · sell at horizon
- IRR
- -15.9%
- Equity multiple
- 0.46×
- Total profit
- $-12,140
- Equity at exit
- $11,913
- IRR
- -18.7%
- Equity multiple
- 0.20×
- Total profit
- $-17,806
- Equity at exit
- $6,908
Cash invested: $22,372 (down + closing). Projections, not guarantees.
Landlord ↔ Tenant lean methodology
- Overall (STATE)
- 87 Strongly Landlord-Friendly
- State Florida
- 87 Strongly Landlord-Friendly · R+3
- County
- — inherits STATE
- City
- — inherits STATE
ZIP-level market 34207
- Rents YoY
- -5.5%
- Active inventory
- 361
- Price-to-rent
- 5.7×
Monthly cashflow live
- Estimated rent
- $1,172 high interval (Pro) →
- Mortgage (P&I)
- −$419
- Tax from tax record
- −$119 /mo · $1,422/yr
- Insurance
- −$33
- HOA
- −$292
- Vacancy / Maint / Mgmt
- −$246
- Net cashflow
- $63
Break-even live
UW: 25.0% down · 7.5% · 30yr · 1.5% tax · 5.0% vac · 8.0% maint · 8.0% mgmt
Financing live
Cash to close
- Down payment
- $19,975
- Closing costs
- $2,397
- Reserves months
- —
- Total cash needed
- —
Loan-product check · same deal, 3 products live
Conventional
25% down · 7.5% · 30yr
- Down + closing
- —
- Monthly P&I
- —
- Monthly cashflow
- —
- DSCR
- —
- Eligible?
- —
Personal DTI + credit; lowest rate.
DSCR
20% down · 8.5% · 30yr
- Down + closing
- —
- Monthly P&I
- —
- Monthly cashflow
- —
- DSCR
- —
- Eligible?
- —
No personal income docs; deal must DSCR.
Hard money
10% down · 12.0% · 12mo
- Down + closing
- —
- Monthly P&I
- —
- Monthly cashflow
- —
- DSCR
- —
- Eligible?
- —
Short-term bridge; refi at stabilization.
Rent comps 26 comps
| Address | Beds | Baths | Sqft | Rent | $/sqft | DOM | Units | Dist |
|---|---|---|---|---|---|---|---|---|
| 1566 Pleasant Rd Unit J24 Bradenton, FL | 2.0 | 1.0 | 733 | $1,150 | $1.57 | 23d | 1 | 0.08mi |
| 5908 17th St W Unit C36 Bradenton, FL | 1.0 | 1.0 | 576 | $950 | $1.65 | 16d | 1 | 0.16mi |
| 5888 17th St W Unit C23 Bradenton, FL | 1.0 | 1.0 | 576 | $1,100 | $1.91 | 23d | 1 | 0.17mi |
| 1839 Sunny Dr Unit E36 Bradenton, FL | 1.0 | 1.0 | 576 | $1,350 | $2.34 | 23d | 1 | 0.18mi |
| 1825 Flamingo Blvd Unit O26 Bradenton, FL | 1.0 | 1.0 | 576 | $1,000 | $1.74 | 23d | 1 | 0.18mi |
| 1807 Restful Dr Unit N4 Bradenton, FL | 2.0 | 1.0 | 733 | $1,150 | $1.57 | 3d | 1 | 0.19mi |
| 1859 Restful Dr Unit L26 Bradenton, FL | 1.0 | 1.0 | 576 | $1,150 | $2.00 | 23d | 1 | 0.24mi |
| 1875 Sunny Dr Unit G32 Bradenton, FL | 1.0 | 1.0 | 576 | $1,100 | $1.91 | 23d | 1 | 0.25mi |
| 5858 Welcome Rd Unit J23 Bradenton, FL | 2.0 | 1.0 | 744 | $1,150 | $1.55 | 3d | 1 | 0.28mi |
| 1874 Sunny Dr Unit F32 Bradenton, FL | 2.0 | 1.0 | 744 | $950 | $1.28 | 23d | 1 | 0.28mi |
| 5955 Palm Ln Unit A33 Bradenton, FL | 2.0 | 1.0 | 744 | $1,150 | $1.55 | 14d | 1 | 0.31mi |
| 2028 Canal Dr Unit M26 Bradenton, FL | 1.0 | 1.0 | 576 | $1,050 | $1.82 | 10d | 1 | 0.36mi |
| 2547 60th Ave W Unit L-36 Bradenton, FL | 1.0 | 1.0 | 576 | $1,100 | $1.91 | 16d | 1 | 0.51mi |
| 5531 16th St W Unit 5537 Bradenton, FL | 2.0 | 1.0 | 750 | $1,650 | $2.20 | 3d | 1 | 0.54mi |
| 5310 26th St W Bradenton, FL | 1.0–2.0 | 1.0 | 789 | $1,250 | $1.58 | 3d | 4 | 1.06mi |
| 5310 26th St W Bradenton, FL | 1.0–2.0 | 1.0 | 789 | $1,250 | $1.58 | 20d | 5 | 1.06mi |
| 5310 26th St W Bradenton, FL | 1.0–2.0 | 1.0 | 789 | $1,250 | $1.58 | 11d | 5 | 1.06mi |
| 5400 26th St W Bradenton, FL | 1.0–2.0 | 1.0–2.0 | 902 | $1,358 | $1.50 | 23d | 1 | 1.08mi |
| 6050 34th St W Bradenton, FL | 1.0–2.0 | 1.0 | 734 | $1,185 | $1.61 | 1d | 19 | 1.22mi |
| 6916 Marlin Ln Bradenton, FL | 2.0 | 1.0 | 430 | $1,250 | $2.91 | 23d | 1 | 1.23mi |
| 205 52nd Avenue Dr W Bradenton, FL | 1.0 | 1.0 | 528 | $1,200 | $2.27 | 23d | 1 | 1.25mi |
| 915 50th Avenue Plz W Bradenton, FL | 2.0 | 1.0 | 700 | $1,200 | $1.71 | 23d | 1 | 1.26mi |
| 2803 52nd Avenue Dr W Unit 2803 Bradenton, FL | 2.0 | 1.0 | 750 | $1,599 | $2.13 | 23d | 1 | 1.26mi |
| 110 52nd Avenue Ter E Bradenton, FL | 2.0 | 1.5 | 684 | $1,450 | $2.12 | 23d | 1 | 1.29mi |
| 5001 22nd St W Unit B Bradenton, FL | 2.0 | 1.0 | 729 | $1,700 | $2.33 | 16d | 1 | 1.33mi |
| 707 50th Ave W Bradenton, FL | 2.0 | 1.0 | 730 | $1,150 | $1.58 | 23d | 1 | 1.37mi |
HOA detail condo
- Monthly dues
- $292 · $3,504/yr
- Likely covers
- waterelectricpool
- Assessments
- None detected in remarks — confirm with the listing agent.
Listing history 50 events
-
2026-06-18days on market $79,900 Active 87 DOM
-
2026-06-17days on market $79,900 Active 86 DOM
-
2026-06-16days on market $79,900 Active 85 DOM
-
2026-06-15days on market $79,900 Active 84 DOM
-
2026-06-13days on market $79,900 Active 82 DOM
-
2026-06-13days on market $79,900 Active 81 DOM
-
2026-06-10days on market $79,900 Active 79 DOM
-
2026-06-09days on market $79,900 Active 78 DOM
-
2026-06-08days on market $79,900 Active 77 DOM
-
2026-06-08days on market $79,900 Active 76 DOM
-
2026-06-03days on market $79,900 Active 72 DOM
-
2026-06-02days on market $79,900 Active 71 DOM
-
2026-06-01days on market $79,900 Active 70 DOM
-
2026-05-31days on market $79,900 Active 69 DOM
-
2026-05-11price $79,900
-
2026-04-16price $84,900
-
2026-03-23$88,000 Active
-
2026-01-06historical
-
2025-12-05price $89,900
-
2025-09-19price $92,000
-
2025-08-06price $94,900
-
2025-06-11$99,900 Active
-
2024-11-12historical
-
2024-10-04price $121,900
-
2024-08-20price $123,900
-
2024-06-07price $124,900
-
2024-06-07$1,214,900 Active
-
2024-04-03soldstatus $108,000
-
2024-03-25soldstatus $108,000 Closed
-
2024-03-19status Pending
-
2024-03-14$109,900 Active
-
2022-01-03soldstatus $79,000
-
2021-12-21soldstatus $79,000 Closed
-
2021-11-05status Pending
-
2021-10-25$84,000 Active
-
2021-07-21soldstatus $75,000 Closed
-
2021-07-21soldstatus $75,000
-
2021-06-18status Pending
-
2021-06-01$78,000 Active
-
2019-08-09soldstatus $57,000 Sold
-
2019-08-09soldstatus $57,000
-
2019-06-25status Pending
-
2019-05-18status Active
-
2019-04-18status Pending
-
2019-02-04$59,900 Active
-
2007-02-28soldstatus $45,000
-
2007-02-27soldstatus $45,000
-
2007-02-26soldstatus $45,000
-
2007-01-13$52,400
-
2007-01-04$52,400
ⓘ Source: listings_history table (triggers on properties + properties_extension) + one-shot
backfill from property_details.listing_events for pre-trigger history.
Tax reassessment forecast FL · Resets to sale price
- Current annual tax
- $1,422 · $119/mo
- Projected year-2 tax
- $1,422 · $119/mo
- Expected delta
- $0/yr ($0/mo · -0.0%)
ⓘ Screening estimate from a state-policy table — verify with the county assessor before closing.
Climate risk First Street
- Flood 1/10 Low FEMA zone X (unshaded) · 0% chance over 30 yrs
- Wildfire 1/10 Low
- Heat 10/10 Extreme 7 d/yr ≥106°F today · 30 d/yr by 30 yrs out
- Wind 10/10 Extreme 99% chance of damaging wind over 30 yrs
- Air quality 2/10 Low 1 unhealthy d/yr today · 2 by 30 yrs out
Nearby sold comps map
Loading sold comps map…
Walkable amenities ~0.75 mi
Loading nearby amenities…
Taxation est. · year 1
- Rental income
- $14,068
- − Mortgage interest
- −$4,476
- − Property taxes
- −$1,422
- − Insurance
- −$400
- − Repairs & maintenance
- −$1,125
- − Management
- −$1,125
- − HOA
- −$3,504
- − Depreciation
- −$2,324
- Taxable loss
- −$308
- Est. tax savings @ 24.0%
- +$74
- After-tax cash flow
- $834/yr
For passive investors: Depreciation is non-cash, so a rental often shows a tax loss while cash-flowing — sheltering income. Rental losses are passive: they offset passive income freely, and up to $25,000/yr can offset ordinary (W-2) income if you actively participate and your MAGI is under $100k (phasing out to $0 by $150k); unused losses carry forward. On sale, claimed depreciation is recaptured at up to 25%, and gains may owe capital-gains tax (a 1031 exchange can defer both). Figures are a year-1 estimate at your 24.0% rate — not tax advice; consult a CPA.
Schools (NCES district)
- District
- Manatee
- NCES district ID
- 1201230
- Math proficiency
- 54% ▼ -6.00%
- Reading proficiency
- 50% ▼ -2.00%
- Median HH income
- $49,607
- Composite
- 44.43/100
- National rank
- #2806
- State rank
- #26 of 73 in FL
Livability — Bayshore Gardens
- Score
- 82/100
- State rank
- #72
- US rank
- #1180
Category grades
Schools grade is shown separately in the Schools card above.
Census & demographics
- Census place
- Bayshore Gardens, FL
- County
- Manatee County · 416,364 people
- City population
- 33,840
- Metro
- North Port-Sarasota-Bradenton, FL
- Population (ZIP)
- 34,081
- Household income
- $45,010
- Rent vs Own
- Severe rent burden
- 1474.0
Population outlook (Manatee County) Hauer SSP2
- Today (2025)
- 447,342 people
- By 2030
- 488,911 · +9.3%
- By 2040
- 567,934 · +27.0%
- By 2050
- 637,995 · +42.6%
- By 2075
- 781,970 · +74.8%
- By 2100
- 848,272 · +89.6%
Race, ethnicity, and origin ACS 2023
- Neighborhood character
- Diverse neighborhood (Simpson 0.57)
- Race & ethnicity
- White 58% Hispanic / Latino 29% Two or more races 13% Black 7%
- Hispanic origin (detail)
- Mexican 12% Puerto Rican 4% Cuban 3% Dominican 1%
- Common ancestry
- Lithuanian 3% Romanian 2% Slovak 2%
- Foreign-born
- 16% · Canada, Jamaica
- Languages at home
- 74% English-only · Spanish 22% Other Indo-European 1% French/Haitian/Cajun 1%
Political lean MEDSL · Manatee
- 2024 margin
- Strong R (+23.5) · D 37.9% · R 61.4%
- 2008→2024 swing
- -16.5pp toward R · 2008: -7.0pp · 2024: -23.5pp
- All cycles
- 2024: R+23.5 2020: R+16.1 2016: R+17.1 2012: R+12.5 2008: R+7.0
Not yet ingested
- Civics
- —
Market trends
- HPI YoY
- ▼ -305.32%
- Current HPI
- 369.9899
- Rent YoY
- ▼ -5.50%
- Metro
- North Port-Sarasota-Bradenton, FL
- State GDP YoY
- ▲ 3.28%
- F500 in state
- 36
Industry mix (Fortune 500 HQ in FL)
| Industry | F500 HQs | Revenue |
|---|---|---|
| Industrial Technology | 2 | $29B |
|
||
| Insurance | 2 | $17B |
|
||
| Retail | 1 | $60B |
|
||
| Technology Distribution | 1 | $58B |
|
||
| Homebuilding | 1 | $35B |
|
||
| Technology Manufacturing | 1 | $35B |
|
||
Price history
+331.9% since first listed40 events — show timeline
- 2026-05-11 Price Changed $79,900 Stellar MLS as Distributed by MLS Grid
- 2026-04-16 Price Changed $84,900 Stellar MLS as Distributed by MLS Grid
- 2026-03-23 Listed $88,000 Stellar MLS as Distributed by MLS Grid
- 2026-01-06 Listing Removed — Stellar MLS as Distributed by MLS Grid
- 2025-12-05 Price Changed $89,900 Stellar MLS as Distributed by MLS Grid
- 2025-09-19 Price Changed $92,000 Stellar MLS as Distributed by MLS Grid
- 2025-08-06 Price Changed $94,900 Stellar MLS as Distributed by MLS Grid
- 2025-06-11 Listed $99,900 Stellar MLS as Distributed by MLS Grid
- 2024-11-12 Listing Removed — Stellar MLS as Distributed by MLS Grid
- 2024-10-04 Price Changed $121,900 Stellar MLS as Distributed by MLS Grid
- 2024-08-20 Price Changed $123,900 Stellar MLS as Distributed by MLS Grid
- 2024-06-07 Price Changed $124,900 Stellar MLS as Distributed by MLS Grid
- 2024-06-07 Listed $1,214,900 Stellar MLS as Distributed by MLS Grid
- 2024-04-03 Sold (Public Records) $108,000 Public Records
- 2024-03-25 Sold (MLS) $108,000 Stellar MLS as Distributed by MLS Grid
- 2024-03-19 Pending — Stellar MLS as Distributed by MLS Grid
- 2024-03-14 Listed $109,900 Stellar MLS as Distributed by MLS Grid
- 2022-01-03 Sold (Public Records) $79,000 Public Records
- 2021-12-21 Sold (MLS) $79,000 Stellar MLS as Distributed by MLS Grid
- 2021-11-05 Pending — Stellar MLS as Distributed by MLS Grid
- 2021-10-25 Listed $84,000 Stellar MLS as Distributed by MLS Grid
- 2021-07-21 Sold (Public Records) $75,000 Public Records
- 2021-07-21 Sold (MLS) $75,000 Stellar MLS as Distributed by MLS Grid
- 2021-06-18 Pending — Stellar MLS as Distributed by MLS Grid
- 2021-06-01 Listed $78,000 Stellar MLS as Distributed by MLS Grid
- 2019-08-09 Sold (Public Records) $57,000 Public Records
- 2019-08-09 Sold (MLS) $57,000 Stellar MLS as Distributed by MLS Grid
- 2019-06-25 Pending — Stellar MLS as Distributed by MLS Grid
- 2019-05-18 Relisted — Stellar MLS as Distributed by MLS Grid
- 2019-04-18 Pending — Stellar MLS as Distributed by MLS Grid
- 2019-02-04 Listed $59,900 Stellar MLS as Distributed by MLS Grid
- 2007-02-28 Sold (Public Records) $45,000 Public Records
- 2007-02-27 Sold (MLS) $45,000 Stellar MLS as Distributed by MLS Grid
- 2007-02-26 Sold (MLS) $45,000 Stellar MLS as Distributed by MLS Grid
- 2007-01-13 Listed $52,400 Stellar MLS as Distributed by MLS Grid
- 2007-01-04 Listed $52,400 Stellar MLS as Distributed by MLS Grid
- 2004-10-13 Sold (Public Records) $40,000 Public Records
- 2004-09-29 Sold (MLS) $40,000 Stellar MLS as Distributed by MLS Grid
- 2004-04-23 Listed $41,500 Stellar MLS as Distributed by MLS Grid
- 2001-07-11 Sold (Public Records) $18,500 Public Records
Property tax history
+9.9%/yrLatest (2025): $1,422 · +110.2% YoY. Source: county tax records.
Cash-flow waterfall
monthlySold comps — $/sqft
last 12 mo · ≤1 miLoading sold comps…