 Multi-family
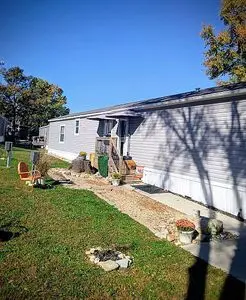
640 State Highway 248 · Branson, MO
Flood risk 1/10 · Minimal
- FEMA flood zone
- X (unshaded)
- Chance of flooding over 30 yrs
- 0.0%
- Est. flood insurance / yr
- $473 – $860
Fire risk 3/10 · Minor
- Est. fire insurance / yr
- $1,054 – $1,958
Heat risk 5/10 · Moderate
- Hot days now (above 106°F)
- 7 days/yr
- Hot days in 30 yrs
- 19 days/yr
Wind risk 2/10 · Minimal
- Chance of severe wind over 30 yrs
- 1.0%
Air-quality risk 2/10 · Minimal
- Unhealthy air days now
- 0 days/yr
- Unhealthy air days in 30 yrs
- 1 days/yr
Risk factors via First Street. Map © Google.
Why this score? — see what drove the B grade
The composite is a weighted blend of 9 inputs, each scored 0–100. Each bar is that input's sub-score; the figure is the points it added to the 100-point composite (weight × sub-score).
- Cash flow +30.0/30.0
- 1% rule +10.0/10.0
- DSCR +10.0/10.0
- ARV discount +7.5/15.0
- Schools +4.2/10.0
- Livability +3.9/5.0
- Rent growth +3.2/5.0
- Condition / age +2.5/5.0
- Appreciation +0.0/10.0
$97,000
🖨 Deal sheet 📄 Offer letter ✓ Due diligence
Multi-family units
County records classify this as Multi-Family (5+ Unit). Listing-text estimate: 1 unit. estimate disagrees with records
5+ unit building — per-unit beds/baths from public records are typically unavailable; the breakdown below (if shown) is an estimate from the listing text.
Listing remarks
Home located in a 55+ excellently cared for Northwoods Community Park and within 10 minutes of most Branson activities and only 1 to 2 minutes from both Hospitals and medical services. Home located less than 2 miles from fabulous Branson Landing and downtown. This home is kept immaculate and has many interior upgrades with all appliances included as well as washer dryer units. This home boasts one of the largest treed lots in the park and with the covered large deck gives you privacy and views you will enjoy. This property comes with a 8X10 shed and an additional storage bin. Also, lawncare and snow removal included in the lot rent. This is a safe well maintained community park just off of
Key facts
- Interior upgrades
- Largest treed lots
- Lawncare included
Tags
Neighborhood map
What this means for you Summary
Snapshot
- This is a 3-bed/2.0-bath multifamily listed at $97k.
Deal economics
- At list price, monthly cash flow is $548 ($7k/yr) — positive.
- The deal already cash-flows at list — no discount required.
- Meets the 1% rule at list price ($2k rent vs $97k).
- Recommended offer: $96k (1.5% below list) — sets the bar for market timing.
- Cap rate 13.1% vs local median 2.5% in Branson — top-decile yield for the area; either an underpriced asset or a hidden risk that comps aren't pricing in. Stress-test before assuming the spread holds.
Location & tenants
- Location reads 77/100 on livability (#32 in MO, #2,940 nationally) — a middle-class / working-renter tenant base. Strengths: commute A+, cost of living A+, health & safety A+; Watch: employment C-, crime F.
- Branson R-IV (rural): math 48% / reading 52% proficiency, ranked #44 of 324 in MO (top 14%) — acceptable for families but not a draw, mixed tenant base, ~2y average lease.
- Market conditions: Rents rising (+2.9%/yr); 1048 active listings in the ZIP; 8 comparable units currently listed for rent nearby; rentals lingering (median 44d on market — plan ~5-8 weeks vacancy on turnover, expect pricing pressure); 88% of comp listings sitting > 30 days — soft ceiling on asking rent; 331 units permitted in Taney County in 2024 (50 in 5+ unit buildings).
- This rent runs 31% of the median local income ($60k/yr) — at the standard rent-burdened threshold; future hikes will face affordability resistance.
Forward outlook
- Local home prices are declining (-3.0%/yr); year-one equity from $671 of loan paydown is wiped out by about $3k of value loss. Plan a longer hold.
- Taney County population projected at +17% by 2050 — long-run rental-demand tailwind backs the buy-and-hold thesis.
- At projected returns (-3.0% appreciation + 2.9% rent growth), your $27k cash investment doubles in ~6 years — after that, you're playing with house money.
Negotiation context
- It's been on market 27 days — a 2% lower offer ($96k) is reasonable based on typical stale-listing flexibility.
Risks & watch-outs
- Climate carrying-cost: extreme-heat days projected 7→19/yr by 2055 (HVAC capex compounding) — expect insurance premiums to compound above CPI over the hold.
Questions for the listing agent
- Is there a deadline driving the sale (1031 exchange, divorce, estate, relocation)? That informs how much negotiation room exists.
- Crime grade is F in this area — have there been break-ins, vandalism, or insurance claims at this property in the last 3 years? What carrier currently insures it and at what premium?
- What's the average days-on-market for RENTAL listings here right now (not sales)? A rising rental-DOM trend means longer vacancies and softer asking-rent achievability than the comps imply.
- What's the recent tenant-quality profile in this submarket — average credit score on applications, eviction rate, late-payment / NSF rate, and stable-employment percentage? A property-management company in the area should have these aggregated.
- How much new apartment / multifamily construction is in the pipeline within 1–3 miles? Heavy new supply (>2% of stock underway) typically softens rents 12–24 months out; light construction supports rent growth.
Investment metrics
- 1% rule
- 1.59% ✓
- Cap rate
- 13.07%
- Cash-on-cash
- 24.22%
- DSCR
- 2.08
- GRM
- 5.2
CMA / ARV
No comps found within radius.
Show comp detail 1 sale within ~0.75 mi
| Address | Dist | Beds/Ba | Sqft | Sold | Price | $/sf | Match |
|---|---|---|---|---|---|---|---|
| 1066 Bird Rd | 0.62mi | 3/3.0 | 1,842 | 9mo | $145,000 | $79 | 47 |
Match score weights: distance 35% · size 25% · config 20% · recency 20%. Top-matched comps best support the ARV.
Projected returns pro-forma
-3.0% appreciation · 2.9% rent growth · sell at horizon
- IRR
- 17.4%
- Equity multiple
- 1.70×
- Total profit
- $19,060
- Equity at exit
- $14,463
- IRR
- 25.8%
- Equity multiple
- 3.25×
- Total profit
- $61,008
- Equity at exit
- $8,387
Cash invested: $27,160 (down + closing). Projections, not guarantees.
Landlord ↔ Tenant lean methodology
- Overall (STATE)
- 81 Strongly Landlord-Friendly
- State Missouri
- 81 Strongly Landlord-Friendly · R+10
- County
- — inherits STATE
- City
- — inherits STATE
ZIP-level market 65616
- Home prices YoY
- -24.3%
- Rents YoY
- 2.9%
- Active inventory
- 1048
- Price-to-rent
- 5.2×
Monthly cashflow live
- Estimated rent
- $1,542 high interval (Pro) →
- Mortgage (P&I)
- −$509
- Tax est. 1.5%
- −$121 /mo · $1,455/yr
- Insurance
- −$40
- HOA
- −$0
- Vacancy / Maint / Mgmt
- −$324
- Net cashflow
- $548
Break-even live
UW: 25.0% down · 7.5% · 30yr · 1.5% tax · 5.0% vac · 8.0% maint · 8.0% mgmt
Financing live
Cash to close
- Down payment
- $24,250
- Closing costs
- $2,910
- Reserves months
- —
- Total cash needed
- —
Loan-product check · same deal, 3 products live
Conventional
25% down · 7.5% · 30yr
- Down + closing
- —
- Monthly P&I
- —
- Monthly cashflow
- —
- DSCR
- —
- Eligible?
- —
Personal DTI + credit; lowest rate.
DSCR
20% down · 8.5% · 30yr
- Down + closing
- —
- Monthly P&I
- —
- Monthly cashflow
- —
- DSCR
- —
- Eligible?
- —
No personal income docs; deal must DSCR.
Hard money
10% down · 12.0% · 12mo
- Down + closing
- —
- Monthly P&I
- —
- Monthly cashflow
- —
- DSCR
- —
- Eligible?
- —
Short-term bridge; refi at stabilization.
Rent comps 8 comps
| Address | Beds | Baths | Sqft | Rent | $/sqft | DOM | Units | Dist |
|---|---|---|---|---|---|---|---|---|
| 151 Vixen Cir Unit D Branson, MO | 2.0 | 2.0 | 1300 | $1,150 | $0.88 | 43d | 1 | 0.51mi |
| 1103 Bird Rd Unit OK 1103-8 Branson, MO | 2.0 | 1.0 | 960 | $850 | $0.89 | 43d | 1 | 0.61mi |
| 1105 Bird Rd Unit OK 1105-1 Branson, MO | 2.0 | 1.0 | 960 | $850 | $0.89 | 43d | 1 | 0.63mi |
| 133 Sapling Dr Branson, MO | 3.0 | 2.0 | — | $2,150 | — | 43d | 1 | 0.95mi |
| 127 Rock Ridge Rd Branson, MO | 3.0 | 2.5 | 1952 | $2,300 | $1.18 | 43d | 1 | 1.02mi |
| 185 Siena Blvd Branson, MO | 2.0 | 2.0 | 1862 | $2,300 | $1.24 | 43d | 1 | 1.16mi |
| 195 Cannon Ball Loop Branson, MO | 1.0–2.0 | 1.0 | — | $800 | — | 13d | 1 | 1.24mi |
| 613 W Pacific St Branson, MO | 2.0 | 1.0 | 1122 | $1,495 | $1.33 | 43d | 1 | 1.42mi |
Listing history 20 events
-
2026-06-19days on market $97,000 Active 27 DOM
-
2026-06-18days on market $97,000 Active 26 DOM
-
2026-06-17days on market $97,000 Active 25 DOM
-
2026-06-16days on market $97,000 Active 24 DOM
-
2026-06-15days on market $97,000 Active 23 DOM
-
2026-06-14days on market $97,000 Active 21 DOM
-
2026-06-12days on market $97,000 Active 20 DOM
-
2026-06-09days on market $97,000 Active 17 DOM
-
2026-06-08days on market $97,000 Active 16 DOM
-
2026-06-07days on market $97,000 Active 15 DOM
-
2026-06-03days on market $97,000 Active 11 DOM
-
2026-06-02days on market $97,000 Active 10 DOM
-
2026-06-01days on market $97,000 Active 9 DOM
-
2026-05-31days on market $97,000 Active 8 DOM
-
2026-05-30days on market $97,000 Active 7 DOM
-
2026-05-24$97,000 Active
-
2024-06-28soldstatus
-
2022-04-04soldstatus
-
2021-06-01soldstatus
-
2020-06-15soldstatus
ⓘ Source: listings_history table (triggers on properties + properties_extension) + one-shot
backfill from property_details.listing_events for pre-trigger history.
Climate risk First Street
- Flood 1/10 Low FEMA zone X (unshaded) · 0% chance over 30 yrs
- Wildfire 3/10 Moderate
- Heat 5/10 Major 7 d/yr ≥106°F today · 19 d/yr by 30 yrs out
- Wind 2/10 Low 100% chance of damaging wind over 30 yrs
- Air quality 2/10 Low 0 unhealthy d/yr today · 1 by 30 yrs out
Nearby sold comps map
Loading sold comps map…
Walkable amenities ~0.75 mi
Loading nearby amenities…
Taxation est. · year 1
- Rental income
- $18,508
- − Mortgage interest
- −$5,434
- − Property taxes
- −$1,455
- − Insurance
- −$485
- − Repairs & maintenance
- −$1,481
- − Management
- −$1,481
- − Depreciation
- −$2,822
- Taxable income
- $5,352
- Est. tax owed @ 24.0%
- −$1,284
- After-tax cash flow
- $5,293/yr
For passive investors: Depreciation is non-cash, so a rental often shows a tax loss while cash-flowing — sheltering income. Rental losses are passive: they offset passive income freely, and up to $25,000/yr can offset ordinary (W-2) income if you actively participate and your MAGI is under $100k (phasing out to $0 by $150k); unused losses carry forward. On sale, claimed depreciation is recaptured at up to 25%, and gains may owe capital-gains tax (a 1031 exchange can defer both). Figures are a year-1 estimate at your 24.0% rate — not tax advice; consult a CPA.
Schools (NCES district)
- District
- Branson R-IV
- NCES district ID
- 2905760
- Math proficiency
- 48% ▼ -6.00%
- Reading proficiency
- 52% ▼ -3.00%
- Median HH income
- $41,473
- Composite
- 41.96/100
- National rank
- #3347
- State rank
- #44 of 324 in MO
Livability — Branson
- Score
- 77/100
- State rank
- #32
- US rank
- #2940
Category grades
Schools grade is shown separately in the Schools card above.
Census & demographics
- Census place
- Branson, MO
- County
- Taney County · 28,460 people
- City population
- 28,460
- Metro
- Branson, MO
- Population (ZIP)
- 28,460
- Household income
- $60,489
- Rent vs Own
- Severe rent burden
- 1065.0
Population outlook (Taney County) Hauer SSP2
- Today (2025)
- 59,017 people
- By 2030
- 61,235 · +3.8%
- By 2040
- 65,225 · +10.5%
- By 2050
- 68,842 · +16.6%
- By 2075
- 77,705 · +31.7%
- By 2100
- 82,002 · +38.9%
Race, ethnicity, and origin ACS 2023
- Neighborhood character
- Predominantly White (82%)
- Race & ethnicity
- White 82% Two or more races 10% Hispanic / Latino 10% Black 2% Asian 2%
- Hispanic origin (detail)
- Mexican 6% Puerto Rican 2%
- Common ancestry
- Italian 4% Lithuanian 3% Slovak 2%
- Foreign-born
- 5% · Canada
- Languages at home
- 89% English-only · Spanish 7% Other Indo-European 1% Russian/Polish/Slavic 1%
Political lean MEDSL · Taney
- 2024 margin
- Solid R (+59.3) · D 19.9% · R 79.2%
- 2008→2024 swing
- -22.2pp toward R · 2008: -37.2pp · 2024: -59.3pp
- All cycles
- 2024: R+59.3 2020: R+57.7 2016: R+59.3 2012: R+47.4 2008: R+37.2
Not yet ingested
- Civics
- —
Market trends
- HPI YoY
- ▼ -64.45%
- Current HPI
- 200.8392
- Rent YoY
- ▲ 2.90%
- Metro
- Branson, MO
- State GDP YoY
- ▲ 1.84%
- F500 in state
- 20
Industry mix (Fortune 500 HQ in MO)
| Industry | F500 HQs | Revenue |
|---|---|---|
| Healthcare | 1 | $163B |
|
||
| Insurance | 1 | $21B |
|
||
| Industrial Technology | 1 | $17B |
|
||
| Retail | 1 | $16B |
|
||
| Industrial Distribution | 1 | $10B |
|
||
| Utilities | 1 | $9B |
|
||
Price history
5 events — show timeline
- 2026-05-24 Listed $97,000 FSBO.com
- 2024-06-28 Sold (Public Records) — Public Records
- 2022-04-04 Sold (Public Records) — Public Records
- 2021-06-01 Sold (Public Records) — Public Records
- 2020-06-15 Sold (Public Records) — Public Records
Property tax history
+6.8%/yrLatest (2025): $6,939 · +0.2% YoY. Source: county tax records.
Cash-flow waterfall
monthlySold comps — $/sqft
last 12 mo · ≤1 miLoading sold comps…