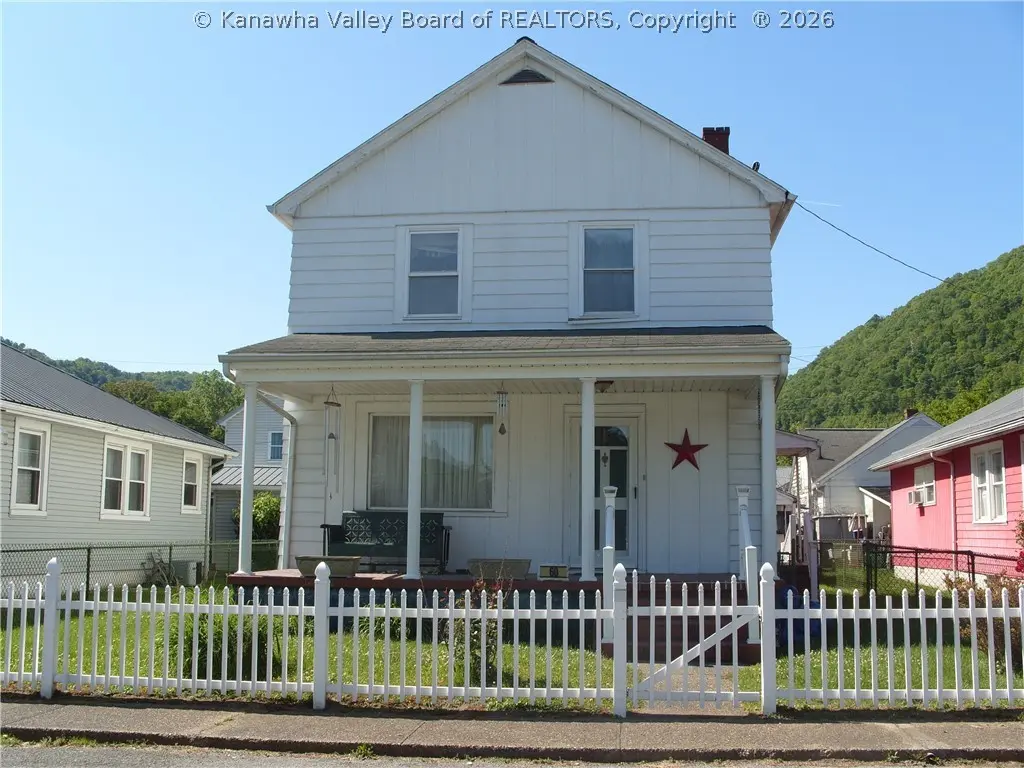
60 C St · Boomer, WV
Flood risk 10/10 · Severe
- FEMA flood zone
- X (shaded)
- Chance of flooding over 30 yrs
- 0.99%
- Est. flood insurance / yr
- $473 – $860
Fire risk 5/10 · Moderate
- Est. fire insurance / yr
- $787 – $1,461
Heat risk 5/10 · Moderate
- Hot days now (above 97°F)
- 8 days/yr
- Hot days in 30 yrs
- 21 days/yr
Wind risk 1/10 · Minimal
- Chance of severe wind over 30 yrs
- 1.0%
Air-quality risk 1/10 · Minimal
- Unhealthy air days now
- 0 days/yr
- Unhealthy air days in 30 yrs
- 0 days/yr
Risk factors via First Street. Map © Google.
Why this score? — see what drove the B grade
The composite is a weighted blend of 9 inputs, each scored 0–100. Each bar is that input's sub-score; the figure is the points it added to the 100-point composite (weight × sub-score).
- Cash flow +28.7/30.0
- ARV discount +11.1/15.0
- DSCR +10.0/10.0
- 1% rule +8.0/10.0
- Appreciation +5.0/10.0
- Condition / age +3.8/5.0
- Livability +3.2/5.0
- Rent growth +2.5/5.0
- Schools +2.0/10.0
$99,900
🖨 Deal sheet (PDF) 📄 Offer letter ✓ Due diligence
Listing remarks
NEAT, CLEAN AND MOVE-IN READY! THIS WELL-MAINTAINED HOME HAS A CONVENIENT FIRST-FLOOR BEDROOM AND BATH WITH A BEAUTIFUL STAIRCASE LEADING TO THREE ADDITIONAL BEDROOMS AND BATHROOM ON SECOND FLOOR. A "MUST SEE" TO APPRECIATE ALL IT HAS TO OFFER. CALL FOR AN APPOINTMENT TO SEE IT TODAY!
Key facts
- 3,119 sq ft lot
- Built 1938
- Listed 22 days
Property features AI
Exterior
- Security: Smoke detectors
- Utilities: Public water; Public sewer
- Home design: Single-family residence; Two stories
- Construction: Vinyl siding; Composition/Shingle roof
- Exterior features: Porch; Fenced yard; Storage
Interior
- Kitchen: Gas range; Microwave; Refrigerator
- Flooring: Carpet; Vinyl
- Bathrooms: 2 full bathrooms
- Heating & cooling: Forced air heating; Central air conditioning
- Interior features: Eat-in kitchen; Insulated windows; Full basement; 8 total rooms
Neighborhood map
What this means for you Summary
Snapshot
- This is a 4-bed/2.0-bath single-family listed at $100k. Condition is rated good.
Deal economics
- At list price, monthly cash flow is $277 ($3k/yr) — positive.
- The deal already cash-flows at list — no discount required.
- Meets the 1% rule at list price ($1k rent vs $100k).
- Recommended offer: $98k (1.5% below list) — sets the bar for market timing.
Location & tenants
- Location reads 65/100 on livability (#130 in WV) — a middle-class / working-renter tenant base. Strengths: cost of living A+, housing A+; Watch: employment C-, amenities F, commute F.
- Fayette County Schools (suburban): math 17% / reading 31% proficiency, ranked #51 of 55 in WV (top 93%) — low school quality limits family demand, transient renter base, plan for 1-2y turnover.
- Zoned schools: Valley Pk-8 (math 13%, 530 students, 0% FRL); Midland Trail High (math 15% / reading 38%, grade F, #87 of 110 statewide, top 79%, 623 students, 0% FRL) — zoned schools average 0% FRL vs 54% district-wide (54 pts lower); this property's tenant base skews higher-income than the district average.
- Market conditions: 1 active listings in the ZIP; 26 units permitted in Fayette County in 2024 (0 in 5+ unit buildings).
Forward outlook
- In year one you build about $4k of equity ($691 loan paydown + $3k appreciation (3.0% local appreciation)).
- Fayette County population projected at -23% by 2050 — secular population decline; favor cash flow + early exit over multi-decade hold.
- At projected returns (3.0% appreciation + 3.0% rent growth), your $28k cash investment doubles in ~4 years — after that, you're playing with house money.
- By year 9, paydown + projected appreciation supports a ~$31k cash-out refi (75% LTV) — recoverable capital for the next deal without selling this one.
Negotiation context
- It's been on market 23 days — a 2% lower offer ($98k) is reasonable based on typical stale-listing flexibility.
Risks & watch-outs
- Watch-outs: flood insurance adds $56/mo; built in 1938 — expect roof / HVAC / electrical / plumbing capex.
- Climate carrying-cost: severe flood risk; moderate wildfire risk; extreme-heat days projected 8→21/yr by 2055 (HVAC capex compounding) — expect insurance premiums to compound above CPI over the hold.
Questions for the listing agent
- Built in 1938 — when were the roof, HVAC, electrical panel, plumbing, and water heater last replaced?
- What's the actual annual flood-insurance premium (NFIP or private), and is the property in a SFHA with mandatory coverage?
- Is there a deadline driving the sale (1031 exchange, divorce, estate, relocation)? That informs how much negotiation room exists.
- Schools are F-rated, which usually means shorter tenancies and higher turnover. Who's the typical renter profile here, and what's been the actual vacancy rate?
- What's the average days-on-market for RENTAL listings here right now (not sales)? A rising rental-DOM trend means longer vacancies and softer asking-rent achievability than the comps imply.
- What's the recent tenant-quality profile in this submarket — average credit score on applications, eviction rate, late-payment / NSF rate, and stable-employment percentage? A property-management company in the area should have these aggregated.
- How much new for-sale + rental construction is in the pipeline within 1–3 miles? Heavy new supply typically softens prices + rents 12–24 months out; constrained supply supports both.
Investment metrics
- 1% rule
- 1.30% ✓
- Cap rate
- 10.28%
- Cash-on-cash
- 14.25%
- DSCR
- 1.63
- GRM
- 6.4
CMA / ARV
- ARV (on-the-fly)
- $108,576
- Comps found
- 2
Show comp detail 2 sales within ~0.75 mi
| Address | Dist | Beds/Ba | Sqft | Sold | Price | $/sf | Match |
|---|---|---|---|---|---|---|---|
| 171 Boomer Hill Rd | 0.17mi | 3/2.0 (-1) | 1,240 (-11%) | 3mo | $89,500 | $72 | 66 |
| 159 Carmen Dr | 0.25mi | 3/2.0 (-1) | 1,598 (+15%) | 3mo | $125,000 | $78 | 56 |
Match score weights: distance 35% · size 25% · config 20% · recency 20%. Top-matched comps best support the ARV.
Projected returns pro-forma
3.0% appreciation · 3.0% rent growth · sell at horizon
- IRR
- 18.6%
- Equity multiple
- 2.06×
- Total profit
- $29,708
- Equity at exit
- $44,919
- IRR
- 20.0%
- Equity multiple
- 3.90×
- Total profit
- $81,153
- Equity at exit
- $69,226
Cash invested: $27,972 (down + closing). Projections, not guarantees.
Landlord ↔ Tenant lean methodology
- Overall (STATE)
- 83 Strongly Landlord-Friendly
- State West Virginia
- 83 Strongly Landlord-Friendly · R+22
- County
- — inherits STATE
- City
- — inherits STATE
ZIP-level market 25031
- Active inventory
- 1
- Price-to-rent
- 6.4×
Monthly cashflow live
- Estimated rent
- $1,294 medium interval (Pro) →
- Mortgage (P&I)
- −$524
- Tax est. 1.5%
- −$125 /mo · $1,498/yr
- Insurance
- −$42
- Flood insurance flood zone
- −$56 /mo · $666/yr
- HOA
- −$0
- Vacancy / Maint / Mgmt
- −$272
- Net cashflow
- $277
Break-even live
Sensitivity live
| Price | -10% $346 | -5% $311 | +0% $277 | +5% $242 | +10% $208 |
|---|---|---|---|---|---|
| Rent | -10% $174 | -5% $226 | +0% $277 | +5% $328 | +10% $379 |
| Rate | -1.0pp $327 | -0.5pp $302 | base $277 | +0.5pp $251 | +1.0pp $224 |
UW: 25.0% down · 7.5% · 30yr · 1.5% tax · 5.0% vac · 8.0% maint · 8.0% mgmt
Financing live
Cash to close
- Down payment
- $24,975
- Closing costs
- $2,997
- Reserves months
- —
- Total cash needed
- —
Loan-product check · same deal, 3 products live
Conventional
25% down · 7.5% · 30yr
- Down + closing
- —
- Monthly P&I
- —
- Monthly cashflow
- —
- DSCR
- —
- Eligible?
- —
Personal DTI + credit; lowest rate.
DSCR
20% down · 8.5% · 30yr
- Down + closing
- —
- Monthly P&I
- —
- Monthly cashflow
- —
- DSCR
- —
- Eligible?
- —
No personal income docs; deal must DSCR.
Hard money
10% down · 12.0% · 12mo
- Down + closing
- —
- Monthly P&I
- —
- Monthly cashflow
- —
- DSCR
- —
- Eligible?
- —
Short-term bridge; refi at stabilization.
Listing history 16 events
-
2026-06-19days on market $99,900 Active 23 DOM
-
2026-06-18days on market $99,900 Active 22 DOM
-
2026-06-17days on market $99,900 Active 21 DOM
-
2026-06-16days on market $99,900 Active 20 DOM
-
2026-06-15days on market $99,900 Active 19 DOM
-
2026-06-14days on market $99,900 Active 17 DOM
-
2026-06-12days on market $99,900 Active 16 DOM
-
2026-06-09days on market $99,900 Active 13 DOM
-
2026-06-08days on market $99,900 Active 12 DOM
-
2026-06-07days on market $99,900 Active 11 DOM
-
2026-06-05days on market $99,900 Active 8 DOM
-
2026-06-03days on market $99,900 Active 7 DOM
-
2026-06-02days on market $99,900 Active 6 DOM
-
2026-06-01status $99,900 Active 5 DOM
-
2026-05-11status Pending
-
2026-05-06$99,900 Active
ⓘ Source: listings_history table (triggers on properties + properties_extension) + one-shot
backfill from property_details.listing_events for pre-trigger history.
Climate risk First Street
- Flood 10/10 Extreme FEMA zone X (shaded) · 99% chance over 30 yrs
- Wildfire 5/10 Major
- Heat 5/10 Major 8 d/yr ≥97°F today · 21 d/yr by 30 yrs out
- Wind 1/10 Low 100% chance of damaging wind over 30 yrs
- Air quality 1/10 Low 0 unhealthy d/yr today · 0 by 30 yrs out
Nearby sold comps map
Loading sold comps map…
Walkable amenities ~0.75 mi
Loading nearby amenities…
Taxation est. · year 1
- Rental income
- $15,533
- − Mortgage interest
- −$5,596
- − Property taxes
- −$1,498
- − Insurance
- −$1,166
- − Repairs & maintenance
- −$1,243
- − Management
- −$1,243
- − Depreciation
- −$2,906
- Taxable income
- $1,881
- Est. tax owed @ 24.0%
- −$451
- After-tax cash flow
- $2,868/yr
For passive investors: Depreciation is non-cash, so a rental often shows a tax loss while cash-flowing — sheltering income. Rental losses are passive: they offset passive income freely, and up to $25,000/yr can offset ordinary (W-2) income if you actively participate and your MAGI is under $100k (phasing out to $0 by $150k); unused losses carry forward. On sale, claimed depreciation is recaptured at up to 25%, and gains may owe capital-gains tax (a 1031 exchange can defer both). Figures are a year-1 estimate at your 24.0% rate — not tax advice; consult a CPA.
Condition & rehab AI · 13 photos
This well-maintained home is in good condition with minor repairs needed. It is move-in ready and has the potential to be improved with some cosmetic updates to increase its value.
Repairs flagged
- Minor Living room carpet — The carpet in the living room appears to be slightly worn.
- Minor Kitchen flooring — The kitchen flooring appears to be slightly worn.
Value-add opportunities
- Resale Paint the interior walls — Painting the interior walls can make the home look fresh and new, which can appeal to potential buyers.
- Rental Replace the kitchen flooring — Replacing the worn kitchen flooring with a more durable and attractive option can increase the rental value.
Renovation cost estimate screening
| Repair item | Severity | Est. cost |
|---|---|---|
| Living room carpet · The carpet in the living room appears to be slightly worn. | Minor | $500–3,000 |
| Kitchen flooring · The kitchen flooring appears to be slightly worn. | Minor | $500–3,000 |
| Total estimated repair cost · 2 items | $1,000–6,000 |
Value-add ROI direction
- Resale Paint the interior walls — Painting the interior walls can make the home look fresh and new, which can appeal to potential buyers. ↑
- Rental Replace the kitchen flooring — Replacing the worn kitchen flooring with a more durable and attractive option can increase the rental value. ↑
ⓘ Cost ranges are severity-bucket heuristics (US national rule-of-thumb). Get contractor quotes + a written scope before underwriting a rehab budget.
Schools (NCES district)
- District
- Fayette County Schools
- NCES district ID
- 5400300
- Math proficiency
- 17% ▼ -12.00%
- Reading proficiency
- 31% ▼ -4.00%
- Median HH income
- $35,293
- Composite
- 19.77/100
- National rank
- #8706
- State rank
- #51 of 55 in WV
Livability — Boomer
- Score
- 65/100
- State rank
- #130
- US rank
- #13528
Category grades
Schools grade is shown separately in the Schools card above.
Census & demographics
- Census place
- Boomer, WV
- City population
- 622
- Population (ZIP)
- 622
Population outlook (Fayette County) Hauer SSP2
- Today (2025)
- 41,745 people
- By 2030
- 39,758 · -4.8%
- By 2040
- 35,751 · -14.4%
- By 2050
- 32,223 · -22.8%
- By 2075
- 24,307 · -41.8%
- By 2100
- 16,671 · -60.1%
Race, ethnicity, and origin ACS 2023
- Neighborhood character
- Predominantly White (69%)
- Race & ethnicity
- White 69% Black 27% Hispanic / Latino 3% Two or more races 3% Native American 2%
- Common ancestry
- Slovak 9% Italian 4% Lithuanian 3%
Political lean MEDSL · Fayette
- 2024 margin
- Solid R (+41.8) · D 28.1% · R 69.8% · Other 2.1%
- 2008→2024 swing
- -39.0pp toward R · 2008: -2.7pp · 2024: -41.8pp
- All cycles
- 2024: R+41.8 2020: R+38.6 2016: R+39.6 2012: R+21.0 2008: R+2.7
Not yet ingested
- Civics
- —
Market trends
- HPI YoY
- —
- Current HPI
- —
- Rent YoY
- —
- Metro
- —
- State GDP YoY
- —
- F500 in state
- 0
Price history
2 events — show timeline
- 2026-05-11 Pending — KVBOR
- 2026-05-06 Listed $99,900 KVBOR
Cash-flow waterfall
monthlySold comps — $/sqft
last 12 mo · ≤1 miLoading sold comps…