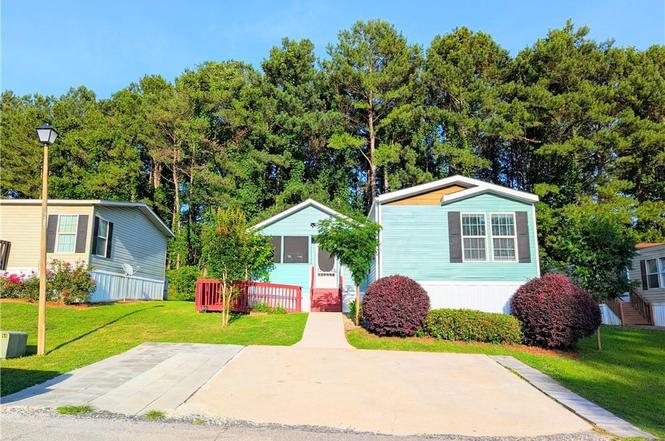
4255 Smoke Creek 37b Pkwy · Stonecrest, GA
Flood risk 5/10 · Moderate
- FEMA flood zone
- X (unshaded)
- Chance of flooding over 30 yrs
- 0.24%
- Est. flood insurance / yr
- $507 – $1,088
Fire risk 2/10 · Minimal
- Est. fire insurance / yr
- $963 – $1,789
Heat risk 6/10 · Moderate
- Hot days now (above 104°F)
- 7 days/yr
- Hot days in 30 yrs
- 19 days/yr
Wind risk 5/10 · Moderate
- Chance of severe wind over 30 yrs
- 25.0%
Air-quality risk 5/10 · Moderate
- Unhealthy air days now
- 7 days/yr
- Unhealthy air days in 30 yrs
- 10 days/yr
Risk factors via First Street. Map © Google.
Why this score? — see what drove the C+ grade
The composite is a weighted blend of 9 inputs, each scored 0–100. Each bar is that input's sub-score; the figure is the points it added to the 100-point composite (weight × sub-score).
- Cash flow +26.6/30.0
- DSCR +9.1/10.0
- ARV discount +7.5/15.0
- 1% rule +7.1/10.0
- Schools +3.7/10.0
- Rent growth +3.1/5.0
- Livability +2.5/5.0
- Condition / age +2.5/5.0
- Appreciation +0.0/10.0
$125,000
🖨 Deal sheet (PDF) 📄 Offer letter ✓ Due diligence
Listing remarks
If you’re looking for more home for your buck, this home is for you! Don’t miss this opportunity! Freshly painted, 3-bedroom, 2-bath residence features approximately 1,487 square feet of living space, plus two detached bonus rooms, each with its own private bathroom. These bonus spaces provide exceptional flexibility for guest suites, a home office, fitness room, art studio, game room, hobby space, or additional sleeping accommodations. Whether for work, recreation, or hosting visitors, this property adapts effortlessly to your lifestyle and evolving needs. Inside, you’ll find a functional floor plan, inviting living areas, and a screened-in porch perfect for year-round re
Key facts
- Screened-in porch
- Community amenities
- Fishing pond
Tags
Property features AI
Finance
- HOA & community: Clubhouse in the community
Exterior
- Parking: Attached parking
- Utilities: Public water; Septic tank sewer; 220V electric; Cable available; Electricity available; Phone available; Water available
- Home design: Single-wide mobile home; One level; Resale
- Construction: Vinyl siding; Shingle roof; Block, combination, and pillar/post/pier foundation; Built 2015 (manufacturer: SCHULT 16X76 ROC729106NC)
- Exterior features: Lighting; Rain gutters; Breezeway; Covered porch; Enclosed porch; Screened porch; Guest house; Shed(s); Storage
Interior
- Kitchen: Breakfast bar; Eat-in kitchen; Dishwasher; Electric oven
- Bedrooms: Three main-level bedrooms; In-law floorplan
- Flooring: Luxury vinyl
- Bathrooms: Four full bathrooms; Master bathroom with separate tub and shower and soaking tub
- Heating & cooling: Electric heating; Ceiling fans for cooling
- Interior features: Accessible approach with ramp; Double pane windows; Window treatments; No common walls; Other interior features
- Laundry & utility: Laundry located in kitchen on main level; Electric dryer hookup; Electric water heater
Neighborhood map
What this means for you Summary
Snapshot
- This is a 3-bed/4.0-bath manufactured listed at $125k.
Deal economics
- At list price, monthly cash flow is $334 ($4k/yr) — positive.
- The deal already cash-flows at list — no discount required.
- Meets the 1% rule at list price ($2k rent vs $125k).
- Cap rate 9.5% vs local median 5.1% in Stonecrest — top-decile yield for the area; either an underpriced asset or a hidden risk that comps aren't pricing in. Stress-test before assuming the spread holds.
Location & tenants
- Location reads: area grade C — affects rentability + tenant quality, not the cash-flow math above.
- Gwinnett County (suburban): math 39% / reading 43% proficiency, ranked #32 of 174 in GA (top 18%) — families likely to look elsewhere, expect single-tenant / working-renter base with shorter leases.
- Zoned schools: Anderson-Livsey Elementary School (math 23% / reading 28%, grade F, #736 of 1,228 statewide, top 61%, 648 students, 80% FRL); Snellville Middle School (math 19% / reading 29%, grade F, #311 of 470 statewide, top 68%, 882 students, 75% FRL); Shiloh High School (math 22% / reading 8%, grade F, #297 of 424 statewide, top 74%, 2,203 students, 65% FRL) — zoned schools average 73% FRL vs 47% district-wide (26 pts higher); higher-poverty schools than district average — tighter screening recommended.
- Zoned-school proficiency averages 21% at this address vs 41% district-wide (-20 pts) — the specific schools serving this property underperform the Gwinnett County average; the district grade overstates school quality for this exact location.
- Market conditions: Rents rising (+2.3%/yr); 358 active listings in the ZIP; 18 comparable units currently listed for rent nearby; rentals at typical pace (median 27d on market — plan ~3-4 weeks tenant-placement turnaround); 44% of comp listings sitting > 30 days — soft ceiling on asking rent; solid renter incomes; 5,607 units permitted in Gwinnett County in 2024 (1,277 in 5+ unit buildings).
Forward outlook
- Local home prices are declining (-3.0%/yr); year-one equity from $864 of loan paydown is wiped out by about $4k of value loss. Plan a longer hold.
- Gwinnett County population projected at +47% by 2050 — long-run rental-demand tailwind backs the buy-and-hold thesis.
Negotiation context
- Only 8 days on market — expect competitive offers; lowballing is unlikely to land.
- 8 sale attempts since 5y ago with the ask held roughly flat each time — persistent listings suggest the price (not the market) is what's stuck; bring a comps-based counter.
Risks & watch-outs
- Climate carrying-cost: moderate flood risk; moderate wind risk, 25% chance of damaging wind over 30y; extreme-heat days projected 7→19/yr by 2055 (HVAC capex compounding) — expect insurance premiums to compound above CPI over the hold.
Questions for the listing agent
- Is there a deadline driving the sale (1031 exchange, divorce, estate, relocation)? That informs how much negotiation room exists.
- What's the average days-on-market for RENTAL listings here right now (not sales)? A rising rental-DOM trend means longer vacancies and softer asking-rent achievability than the comps imply.
- What's the recent tenant-quality profile in this submarket — average credit score on applications, eviction rate, late-payment / NSF rate, and stable-employment percentage? A property-management company in the area should have these aggregated.
- How much new for-sale + rental construction is in the pipeline within 1–3 miles? Heavy new supply typically softens prices + rents 12–24 months out; constrained supply supports both.
Investment metrics
- 1% rule
- 1.21% ✓
- Cap rate
- 9.50%
- Cash-on-cash
- 11.46%
- DSCR
- 1.51
- GRM
- 6.9
CMA / ARV
No comps found within radius.
Projected returns pro-forma
-3.0% appreciation · 2.31% rent growth · sell at horizon
- IRR
- 0.0%
- Equity multiple
- 1.00×
- Total profit
- $19
- Equity at exit
- $18,638
- IRR
- 9.0%
- Equity multiple
- 1.67×
- Total profit
- $23,301
- Equity at exit
- $10,808
Cash invested: $35,000 (down + closing). Projections, not guarantees.
Landlord ↔ Tenant lean methodology
- Overall (STATE)
- 90 Strongly Landlord-Friendly
- State Georgia
- 90 Strongly Landlord-Friendly · R+3
- County
- — inherits STATE
- City
- — inherits STATE
ZIP-level market 30039
- Rents YoY
- 2.3%
- Active inventory
- 358
- Price-to-rent
- 6.9×
Monthly cashflow live
- Estimated rent
- $1,517 high interval (Pro) →
- Mortgage (P&I)
- −$656
- Tax est. 1.5%
- −$156 /mo · $1,875/yr
- Insurance
- −$52
- HOA
- −$0
- Lot rent leased land?
- −$0
- Vacancy / Maint / Mgmt
- −$319
- Net cashflow
- $334
Break-even live
Sensitivity live
| Price | -10% $421 | -5% $378 | +0% $334 | +5% $291 | +10% $248 |
|---|---|---|---|---|---|
| Rent | -10% $215 | -5% $274 | +0% $334 | +5% $394 | +10% $454 |
| Rate | -1.0pp $397 | -0.5pp $366 | base $334 | +0.5pp $302 | +1.0pp $269 |
UW: 25.0% down · 7.5% · 30yr · 1.5% tax · 5.0% vac · 8.0% maint · 8.0% mgmt
Financing live
Cash to close
- Down payment
- $31,250
- Closing costs
- $3,750
- Reserves months
- —
- Total cash needed
- —
Loan-product check · same deal, 3 products live
Conventional
25% down · 7.5% · 30yr
- Down + closing
- —
- Monthly P&I
- —
- Monthly cashflow
- —
- DSCR
- —
- Eligible?
- —
Personal DTI + credit; lowest rate.
DSCR
20% down · 8.5% · 30yr
- Down + closing
- —
- Monthly P&I
- —
- Monthly cashflow
- —
- DSCR
- —
- Eligible?
- —
No personal income docs; deal must DSCR.
Hard money
10% down · 12.0% · 12mo
- Down + closing
- —
- Monthly P&I
- —
- Monthly cashflow
- —
- DSCR
- —
- Eligible?
- —
Short-term bridge; refi at stabilization.
Rent comps 18 comps
| Address | Beds | Baths | Sqft | Rent | $/sqft | DOM | Units | Dist |
|---|---|---|---|---|---|---|---|---|
| 4255 Smokecreek Pkwy Snellville, GA | 3.0 | 2.0 | 1216 | $1,499 | $1.23 | 46d | 1 | 0.02mi |
| 4270 Riverlake Way Snellville, GA | 3.0 | 2.0 | 2021 | $2,099 | $1.04 | 4d | 1 | 0.25mi |
| 4434 Janice Dr Snellville, GA | 3.0 | 2.0 | 1257 | $1,795 | $1.43 | 46d | 1 | 0.44mi |
| 4255 Smoke Creek Pkwy Unit 30A Snellville, GA | 3.0 | 2.0 | 1198 | $1,632 | $1.36 | 46d | 1 | 0.47mi |
| 4382 Raptor Pl Snellville, GA | 3.0 | 2.5 | 1547 | $2,140 | $1.38 | 0d | 1 | 0.82mi |
| 4246 Gray Raptor Ct Snellville, GA | 3.0 | 2.0 | 1541 | $1,875 | $1.22 | 23d | 1 | 0.91mi |
| 4302 Marci St Snellville, GA | 3.0 | 2.0 | 1290 | $1,895 | $1.47 | 0d | 1 | 0.95mi |
| 712 Pembelton Ct Lithonia, GA | 3.0 | 2.0 | 1200 | $1,665 | $1.39 | 46d | 1 | 0.98mi |
| 4091 S Fork Dr Snellville, GA | 3.0 | 2.0 | 1412 | $1,855 | $1.31 | 0d | 1 | 1.05mi |
| 4251 Cary Dr Snellville, GA | 3.0 | 2.0 | 1780 | $1,829 | $1.03 | 1d | 1 | 1.13mi |
| 4284 Wood Cove Dr Snellville, GA | 3.0 | 3.5 | 2180 | $1,499 | $0.69 | 15d | 1 | 1.19mi |
| 4190 Crestside Rdg Snellville, GA | 4.0 | 2.0 | 1997 | $1,989 | $1.00 | 46d | 1 | 1.23mi |
| 4580 Woodcroft Cv Snellville, GA | 4.0 | 2.0 | 1688 | $1,989 | $1.18 | 26d | 1 | 1.29mi |
| 4460 Marjorie Rd Snellville, GA | 3.0 | 2.0 | 1448 | $1,999 | $1.38 | 46d | 1 | 1.34mi |
| 4275 Bradley Dr Snellville, GA | 3.0 | 2.0 | 1200 | $1,595 | $1.33 | 46d | 1 | 1.36mi |
| 4063 Percheron Ln Snellville, GA | 3.0 | 2.5 | 1768 | $2,055 | $1.16 | 4d | 1 | 1.40mi |
| 4445 Scotland Ct Snellville, GA | 3.0 | 2.0 | 1606 | $2,095 | $1.30 | 46d | 1 | 1.45mi |
| 738 Stonebridge Way Lithonia, GA | 3.0 | 2.0 | 1352 | $1,875 | $1.39 | 1d | 1 | 1.47mi |
Listing history 7 events
-
2026-06-22days on market $125,000 Active 8 DOM
-
2026-06-21days on market $125,000 Active 7 DOM
-
2026-06-18days on market $125,000 Active 4 DOM
-
2026-06-17days on market $125,000 Active 3 DOM
-
2026-06-16days on market $125,000 Active 2 DOM
-
2026-06-15remarks 681-char remark
-
2026-06-15$125,000 Active 1 DOM
ⓘ Source: listings_history table (triggers on properties + properties_extension) + one-shot
backfill from property_details.listing_events for pre-trigger history.
Climate risk First Street
- Flood 5/10 Major FEMA zone X (unshaded) · 24% chance over 30 yrs
- Wildfire 2/10 Low
- Heat 6/10 Major 7 d/yr ≥104°F today · 19 d/yr by 30 yrs out
- Wind 5/10 Major 25% chance of damaging wind over 30 yrs
- Air quality 5/10 Major 7 unhealthy d/yr today · 10 by 30 yrs out
Nearby sold comps map
Loading sold comps map…
Walkable amenities ~0.75 mi
Loading nearby amenities…
Taxation est. · year 1
- Rental income
- $18,201
- − Mortgage interest
- −$7,002
- − Property taxes
- −$1,875
- − Insurance
- −$625
- − Repairs & maintenance
- −$1,456
- − Management
- −$1,456
- − Depreciation
- −$3,636
- Taxable income
- $2,151
- Est. tax owed @ 24.0%
- −$516
- After-tax cash flow
- $3,496/yr
For passive investors: Depreciation is non-cash, so a rental often shows a tax loss while cash-flowing — sheltering income. Rental losses are passive: they offset passive income freely, and up to $25,000/yr can offset ordinary (W-2) income if you actively participate and your MAGI is under $100k (phasing out to $0 by $150k); unused losses carry forward. On sale, claimed depreciation is recaptured at up to 25%, and gains may owe capital-gains tax (a 1031 exchange can defer both). Figures are a year-1 estimate at your 24.0% rate — not tax advice; consult a CPA.
Schools (NCES district)
- District
- Gwinnett County
- NCES district ID
- 1302550
- Math proficiency
- 39% ▼ -15.00%
- Reading proficiency
- 43% ▼ -10.00%
- Median HH income
- $62,416
- Composite
- 36.5/100
- National rank
- #4648
- State rank
- #32 of 174 in GA
Livability — Stonecrest
No livability data for this city. (Only ~50 U.S. cities are tracked.)
Census & demographics
- County
- Gwinnett County · 952,346 people
- City population
- 106,165
- Metro
- Atlanta-Sandy Springs-Alpharetta, GA
- Population (ZIP)
- 52,783
- Household income
- $93,701
- Rent vs Own
- Severe rent burden
- 906.0
Population outlook (Gwinnett County) Hauer SSP2
- Today (2025)
- 1,106,028 people
- By 2030
- 1,211,414 · +9.5%
- By 2040
- 1,422,277 · +28.6%
- By 2050
- 1,623,204 · +46.8%
- By 2075
- 2,105,240 · +90.3%
- By 2100
- 2,443,321 · +120.9%
Race, ethnicity, and origin ACS 2023
- Neighborhood character
- Diverse neighborhood (Simpson 0.60)
- Race & ethnicity
- Black 58% White 21% Hispanic / Latino 14% Two or more races 9% Asian 2%
- Hispanic origin (detail)
- Mexican 4% Puerto Rican 3% Dominican 1%
- Common ancestry
- Hispanic 1% American 1% Italian 1%
- Foreign-born
- 20% · Canada
- Languages at home
- 79% English-only · Spanish 10% Russian/Polish/Slavic 2% Other Indo-European 2%
Political lean MEDSL · Gwinnett
- 2024 margin
- D (+16.5) · D 57.6% · R 41.1% · Other 1.2%
- 2008→2024 swing
- +26.8pp toward D · 2008: -10.2pp · 2024: 16.5pp
- All cycles
- 2024: D+16.5 2020: D+18.3 2016: D+5.8 2012: R+9.4 2008: R+10.2
Not yet ingested
- Civics
- —
Market trends
- HPI YoY
- ▼ -165.06%
- Current HPI
- 233.5335
- Rent YoY
- ▲ 2.31%
- Metro
- Atlanta-Sandy Springs-Alpharetta, GA
- State GDP YoY
- ▲ 2.66%
- F500 in state
- 28
Industry mix (Fortune 500 HQ in GA)
| Industry | F500 HQs | Revenue |
|---|---|---|
| Paper / Packaging | 2 | $29B |
|
||
| Retail | 1 | $160B |
|
||
| Transportation / Logistics | 1 | $91B |
|
||
| Airlines | 1 | $62B |
|
||
| Consumer Goods | 1 | $47B |
|
||
| Utilities | 1 | $25B |
|
||
Price history
-98.0% since first listed19 events — show timeline
- 2026-06-14 Listed $125,000 FMLS
- 2025-03-31 Listing Removed — GAMLS
- 2025-02-05 Listed $69,500 GAMLS
- 2024-03-14 Rental Removed $1,930 APPFOLIO
- 2023-12-28 Listed for Rent $1,930 APPFOLIO
- 2022-03-11 Listing Removed — GAMLS
- 2022-03-04 Contingent — GAMLS
- 2022-02-22 Listed $65,000 GAMLS
- 2022-02-02 Listing Removed — GAMLS
- 2022-01-24 Listing Removed — GAMLS
- 2022-01-18 Listed $45,000 GAMLS
- 2022-01-11 Listed $65,000 GAMLS
- 2021-07-06 Listing Removed — GAMLS
- 2021-06-19 Price Changed $47,000 GAMLS
- 2021-06-09 Relisted — GAMLS
- 2021-05-27 Pending — GAMLS
- 2021-05-06 Listed $49,900 GAMLS
- 2013-05-02 Sold (Public Records) $5,245,500 Public Records
- 2001-02-07 Sold (Public Records) $6,231,300 Public Records
Property tax history
+104.8%/yrLatest (2025): $268,024 · -0.6% YoY. Source: county tax records.
Cash-flow waterfall
monthlySold comps — $/sqft
last 12 mo · ≤1 miLoading sold comps…