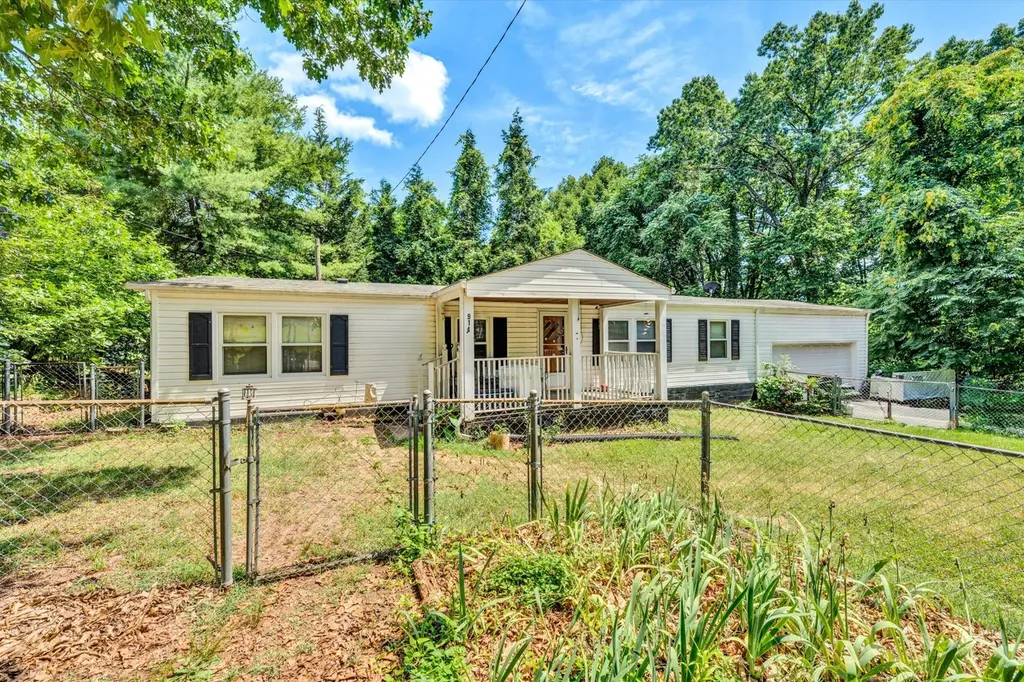
914 Givens Tyler Rd · Glenvar, VA
Flood risk 1/10 · Minimal
- FEMA flood zone
- X (unshaded)
- Chance of flooding over 30 yrs
- 0.0%
- Est. flood insurance / yr
- $507 – $1,088
Fire risk 5/10 · Moderate
- Est. fire insurance / yr
- $666 – $1,236
Heat risk 4/10 · Minor
- Hot days now (above 100°F)
- 7 days/yr
- Hot days in 30 yrs
- 19 days/yr
Wind risk 2/10 · Minimal
- Chance of severe wind over 30 yrs
- 1.0%
Air-quality risk 1/10 · Minimal
- Unhealthy air days now
- 0 days/yr
- Unhealthy air days in 30 yrs
- 0 days/yr
Risk factors via First Street. Map © Google.
Why this score? — see what drove the A- grade
The composite is a weighted blend of 9 inputs, each scored 0–100. Each bar is that input's sub-score; the figure is the points it added to the 100-point composite (weight × sub-score).
- Cash flow +30.0/30.0
- ARV discount +15.0/15.0
- 1% rule +10.0/10.0
- DSCR +10.0/10.0
- Schools +6.4/10.0
- Rent growth +4.0/5.0
- Livability +3.2/5.0
- Condition / age +2.5/5.0
- Appreciation +0.0/10.0
$130,000
🖨 Deal sheet (PDF) 📄 Offer letter ✓ Due diligence
Listing remarks MLS
This home offers 3 BR's, 2 Baths, Living Room, Eat-in-Kitchen, Dining Room, Den, Garage. Family is in the process of cleaning house out. No FHA, VA, USDA Loans. Sold ''AS IS''. Seller will not be responsible for any repairs or inspections. Subdivision Map- TR B D C Sheppard Map.
Key facts
- 0.97 acre lot
- Garage
- Built 1972
Property features AI
Exterior
- Parking: Covered parking for 2 vehicles; Off-street parking available
- Home design: Residential property built in 1972
- Construction: Built in 1972
- Exterior features: Front porch; Nearly 1-acre lot
Interior
- Bedrooms: 3 bedrooms, all on the main level
- Flooring: Carpet; Tile
- Bathrooms: 2 full bathrooms, both on the main level
- Heating & cooling: Heat pump (electric) for heating and cooling
- Interior features: 9 total rooms; Has one fireplace
Neighborhood map
What this means for you Summary
Snapshot
- This is a 3-bed/2.0-bath manufactured listed at $130k.
Deal economics
- At list price, monthly cash flow is $783 ($9k/yr) — positive.
- The deal already cash-flows at list — no discount required.
- Meets the 1% rule at list price ($2k rent vs $130k).
- Recommended offer: $126k (3.0% below list) — sets the bar for market timing.
- Cap rate 13.5% vs local median 2.7% in Glenvar — top-decile yield for the area; either an underpriced asset or a hidden risk that comps aren't pricing in. Stress-test before assuming the spread holds.
Location & tenants
- Location reads 63/100 on livability (#387 in VA) — a middle-class / working-renter tenant base. Strengths: health & safety A+, cost of living A, housing B; Watch: amenities F, commute F, employment D-.
- Roanoke County Public School District (suburban): math 71% / reading 78% proficiency, ranked #9 of 131 in VA (top 7%) — strong family-tenant draw, lease renewals of 3-5y typical.
- Zoned schools: Glenvar Elementary (math 47% / reading 67%, grade C+, #597 of 1,108 statewide, top 57%, 347 students, 41% FRL); Glenvar Middle (math 70% / reading 76%, grade A, #58 of 342 statewide, top 17%, 430 students, 35% FRL); Glenvar High (math 87% / reading 92%, grade A+, #8 of 319 statewide, top 3%, 627 students, 32% FRL).
- Market conditions: Rents rising fast (+6.0%/yr); 274 active listings in the ZIP; 2 comparable units currently listed for rent nearby; 360 units permitted in Roanoke County in 2024 (228 in 5+ unit buildings).
- This rent runs 33% of the median local income ($74k/yr) — at the standard rent-burdened threshold; future hikes will face affordability resistance.
Forward outlook
- Local home prices are declining (-3.0%/yr); year-one equity from $899 of loan paydown is wiped out by about $4k of value loss. Plan a longer hold.
- Roanoke County population projected at +5% by 2050 — modest demand growth; plan on rents tracking national, not racing it.
- At projected returns (-3.0% appreciation + 6.0% rent growth), your $36k cash investment doubles in ~5 years — after that, you're playing with house money.
Negotiation context
- It's been on market 53 days — a 3% lower offer ($126k) is reasonable based on typical stale-listing flexibility.
- 3 sale attempts since 6y ago; this cycle's ask has dropped $20k (13%) from the opening price — seller is motivated, your offer sets the floor, not the list.
- Current owner paid $70k; list at $130k implies a 86% gain — meaningful room to come down on a strong offer.
Risks & watch-outs
- Climate carrying-cost: moderate wildfire risk — expect insurance premiums to compound above CPI over the hold.
Questions for the listing agent
- It's been on market 53 days. Have you received any prior offers? Is the seller open to a 3% concession, seller financing, or rate buy-down credit?
- Built in 1972 — when were the roof, HVAC, electrical panel, plumbing, and water heater last replaced?
- Is there a deadline driving the sale (1031 exchange, divorce, estate, relocation)? That informs how much negotiation room exists.
- Schools are F-rated, which usually means shorter tenancies and higher turnover. Who's the typical renter profile here, and what's been the actual vacancy rate?
- What's the average days-on-market for RENTAL listings here right now (not sales)? A rising rental-DOM trend means longer vacancies and softer asking-rent achievability than the comps imply.
- What's the recent tenant-quality profile in this submarket — average credit score on applications, eviction rate, late-payment / NSF rate, and stable-employment percentage? A property-management company in the area should have these aggregated.
- How much new for-sale + rental construction is in the pipeline within 1–3 miles? Heavy new supply typically softens prices + rents 12–24 months out; constrained supply supports both.
Investment metrics
- 1% rule
- 1.57% ✓
- Cap rate
- 13.53%
- Cash-on-cash
- 25.83%
- DSCR
- 2.15
- GRM
- 5.3
CMA / ARV
- ARV (median comp)
- $211,740
- List price
- $130,000
- Delta
- -38.60%
- Verdict
- UNDERPRICED
- Comps
- 1 within 2.0 mi
Projected returns pro-forma
-3.0% appreciation · 5.98% rent growth · sell at horizon
- IRR
- 22.7%
- Equity multiple
- 1.96×
- Total profit
- $35,125
- Equity at exit
- $19,383
- IRR
- 32.5%
- Equity multiple
- 4.36×
- Total profit
- $122,283
- Equity at exit
- $11,240
Cash invested: $36,400 (down + closing). Projections, not guarantees.
Landlord ↔ Tenant lean methodology
- Overall (STATE)
- 55 Moderately Landlord-Leaning
- State Virginia
- 55 Moderately Landlord-Leaning · D+2
- County
- — inherits STATE
- City
- — inherits STATE
ZIP-level market 24153
- Rents YoY
- 6.0%
- Active inventory
- 274
- Price-to-rent
- 5.3×
Monthly cashflow live
- Estimated rent
- $2,041 medium interval (Pro) →
- Mortgage (P&I)
- −$682
- Tax from tax record
- −$93 /mo · $1,113/yr
- Insurance
- −$54
- HOA
- −$0
- Vacancy / Maint / Mgmt
- −$429
- Net cashflow
- $783
Break-even live
Sensitivity live
| Price | -10% $857 | -5% $820 | +0% $783 | +5% $747 | +10% $710 |
|---|---|---|---|---|---|
| Rent | -10% $622 | -5% $703 | +0% $783 | +5% $864 | +10% $945 |
| Rate | -1.0pp $849 | -0.5pp $817 | base $783 | +0.5pp $750 | +1.0pp $716 |
UW: 25.0% down · 7.5% · 30yr · 1.5% tax · 5.0% vac · 8.0% maint · 8.0% mgmt
Financing live
Cash to close
- Down payment
- $32,500
- Closing costs
- $3,900
- Reserves months
- —
- Total cash needed
- —
Loan-product check · same deal, 3 products live
Conventional
25% down · 7.5% · 30yr
- Down + closing
- —
- Monthly P&I
- —
- Monthly cashflow
- —
- DSCR
- —
- Eligible?
- —
Personal DTI + credit; lowest rate.
DSCR
20% down · 8.5% · 30yr
- Down + closing
- —
- Monthly P&I
- —
- Monthly cashflow
- —
- DSCR
- —
- Eligible?
- —
No personal income docs; deal must DSCR.
Hard money
10% down · 12.0% · 12mo
- Down + closing
- —
- Monthly P&I
- —
- Monthly cashflow
- —
- DSCR
- —
- Eligible?
- —
Short-term bridge; refi at stabilization.
Rent comps 2 comps
| Address | Beds | Baths | Sqft | Rent | $/sqft | DOM | Units | Dist |
|---|---|---|---|---|---|---|---|---|
| 2868 Silver Leaf Dr Salem, VA | 4.0 | 2.0 | 1710 | $2,220 | $1.30 | 15d | 1 | 0.99mi |
| 3615 Ellen Dr Salem, VA | 3.0 | 2.0 | 1196 | $2,000 | $1.67 | 46d | 1 | 1.23mi |
Listing history 25 events
-
2026-06-22days on market $130,000 Active 53 DOM
-
2026-06-18days on market $130,000 Active 50 DOM
-
2026-06-17days on market $130,000 Active 49 DOM
-
2026-06-16days on market $130,000 Active 48 DOM
-
2026-06-15days on market $130,000 Active 47 DOM
-
2026-06-14days on market $130,000 Active 45 DOM
-
2026-06-13days on market $130,000 Active 44 DOM
-
2026-06-10days on market $130,000 Active 42 DOM
-
2026-06-09days on market $130,000 Active 41 DOM
-
2026-06-08days on market $130,000 Active 40 DOM
-
2026-06-05days on market $130,000 Active 36 DOM
-
2026-06-03price $130,000 Active 34 DOM
-
2026-06-02days on market $145,000 Active 34 DOM
-
2026-06-01days on market $145,000 Active 33 DOM
-
2026-05-31days on market $145,000 Active 32 DOM
-
2026-05-30days on market $145,000 Active 31 DOM
-
2026-04-29$150,000 Active 785-char remark
-
2024-12-12historical
-
2024-09-06price $155,000
-
2024-08-07price $179,950
-
2024-07-01price $189,950
-
2024-06-19$199,950 Active
-
2021-05-27soldstatus $70,000
-
2021-05-26soldstatus $70,000
Show marketing remark (279 chars)
This home offers 3 BR's, 2 Baths, Living Room, Eat-in-Kitchen, Dining Room, Den, Garage. Family is in the process of cleaning house out. No FHA, VA, USDA Loans. Sold ''AS IS''. Seller will not be responsible for any repairs or inspections. Subdivision Map- TR B D C Sheppard Map.
-
2020-11-24$85,000
Show marketing remark (279 chars)
This home offers 3 BR's, 2 Baths, Living Room, Eat-in-Kitchen, Dining Room, Den, Garage. Family is in the process of cleaning house out. No FHA, VA, USDA Loans. Sold ''AS IS''. Seller will not be responsible for any repairs or inspections. Subdivision Map- TR B D C Sheppard Map.
ⓘ Source: listings_history table (triggers on properties + properties_extension) + one-shot
backfill from property_details.listing_events for pre-trigger history.
Tax reassessment forecast VA · Resets to sale price
- Current annual tax
- $1,113 · $93/mo
- Projected year-2 tax
- $1,113 · $93/mo
- Expected delta
- $0/yr ($0/mo · 0.0%)
ⓘ Screening estimate from a state-policy table — verify with the county assessor before closing.
Climate risk First Street
- Flood 1/10 Low FEMA zone X (unshaded) · 0% chance over 30 yrs
- Wildfire 5/10 Major
- Heat 4/10 Moderate 7 d/yr ≥100°F today · 19 d/yr by 30 yrs out
- Wind 2/10 Low 100% chance of damaging wind over 30 yrs
- Air quality 1/10 Low 0 unhealthy d/yr today · 0 by 30 yrs out
Nearby sold comps map
Loading sold comps map…
Walkable amenities ~0.75 mi
Loading nearby amenities…
Taxation est. · year 1
- Rental income
- $24,489
- − Mortgage interest
- −$7,282
- − Property taxes
- −$1,113
- − Insurance
- −$650
- − Repairs & maintenance
- −$1,959
- − Management
- −$1,959
- − Depreciation
- −$3,782
- Taxable income
- $7,743
- Est. tax owed @ 24.0%
- −$1,858
- After-tax cash flow
- $7,544/yr
For passive investors: Depreciation is non-cash, so a rental often shows a tax loss while cash-flowing — sheltering income. Rental losses are passive: they offset passive income freely, and up to $25,000/yr can offset ordinary (W-2) income if you actively participate and your MAGI is under $100k (phasing out to $0 by $150k); unused losses carry forward. On sale, claimed depreciation is recaptured at up to 25%, and gains may owe capital-gains tax (a 1031 exchange can defer both). Figures are a year-1 estimate at your 24.0% rate — not tax advice; consult a CPA.
Schools (NCES district)
- District
- Roanoke County Public School District
- NCES district ID
- 5103330
- Math proficiency
- 71% ▼ -19.00%
- Reading proficiency
- 78% ▼ -6.00%
- Median HH income
- $60,526
- Composite
- 64.08/100
- National rank
- #578
- State rank
- #9 of 131 in VA
Livability — Glenvar
- Score
- 63/100
- State rank
- #387
- US rank
- #15857
Category grades
Schools grade is shown separately in the Schools card above.
Census & demographics
- County
- Salem City · 38,914 people
- Metro
- Roanoke, VA
- Population (ZIP)
- 38,914
- Household income
- $74,260
- Rent vs Own
- Severe rent burden
- 1115.0
Population outlook (Roanoke County) Hauer SSP2
- Today (2025)
- 98,162 people
- By 2030
- 99,793 · +1.7%
- By 2040
- 101,965 · +3.9%
- By 2050
- 103,328 · +5.3%
- By 2075
- 108,641 · +10.7%
- By 2100
- 104,845 · +6.8%
Race, ethnicity, and origin ACS 2023
- Neighborhood character
- Predominantly White (84%)
- Race & ethnicity
- White 84% Black 6% Hispanic / Latino 4% Two or more races 4% Asian 2%
- Common ancestry
- Serbian 2% Slovak 2% Romanian 1%
- Foreign-born
- 4% · Canada, China
- Languages at home
- 96% English-only · Spanish 2% Other Indo-European 1%
Political lean MEDSL · Roanoke
- 2024 margin
- Strong R (+22.5) · D 38.2% · R 60.7% · Other 1.1%
- 2008→2024 swing
- -1.4pp toward R · 2008: -21.1pp · 2024: -22.5pp
- All cycles
- 2024: R+22.5 2020: R+21.8 2016: R+28.1 2012: R+25.6 2008: R+21.1
Not yet ingested
- Civics
- —
Market trends
- HPI YoY
- ▼ -259.46%
- Current HPI
- 170.8986
- Rent YoY
- ▲ 5.98%
- Metro
- Roanoke, VA
- State GDP YoY
- ▲ 2.40%
- F500 in state
- 50
Industry mix (Fortune 500 HQ in VA)
| Industry | F500 HQs | Revenue |
|---|---|---|
| Aerospace / Defense | 4 | $236B |
|
||
| Technology / Defense | 3 | $32B |
|
||
| Financial Services | 2 | $176B |
|
||
| Utilities | 2 | $27B |
|
||
| Insurance | 2 | $25B |
|
||
| Technology | 2 | $15B |
|
||
Price history
+52.9% since first listed11 events — show timeline
- 2026-06-02 Price Changed $130,000 MLSRV
- 2026-05-20 Price Changed $145,000 MLSRV
- 2026-04-29 Listed $150,000 MLSRV
- 2024-12-12 Listing Removed — MLSRV
- 2024-09-06 Price Changed $155,000 MLSRV
- 2024-08-07 Price Changed $179,950 MLSRV
- 2024-07-01 Price Changed $189,950 MLSRV
- 2024-06-19 Listed $199,950 MLSRV
- 2021-05-27 Sold (Public Records) $70,000 Public Records
- 2021-05-26 Sold (MLS) $70,000 MLSRV
- 2020-11-24 Listed $85,000 MLSRV
Property tax history
+0.2%/yrLatest (2025): $1,113 · +28.5% YoY. Source: county tax records.
Cash-flow waterfall
monthlySold comps — $/sqft
last 12 mo · ≤1 miLoading sold comps…