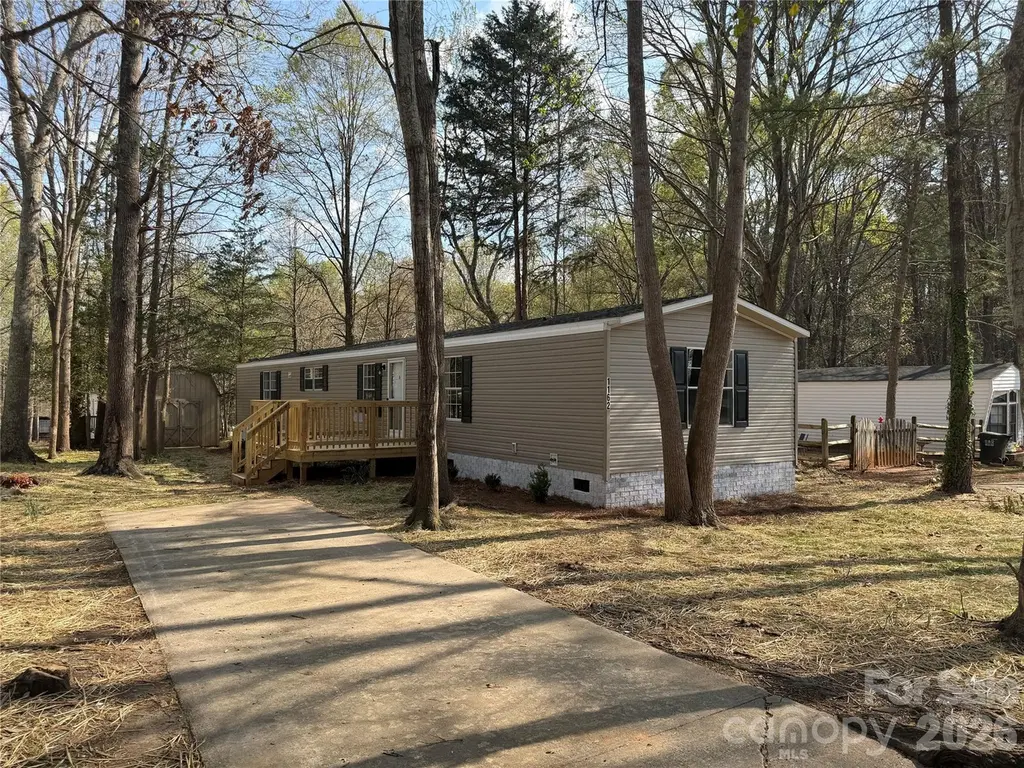
1162 State Line Rd · Lake Wylie, SC
Flood risk 1/10 · Minimal
- FEMA flood zone
- X (unshaded)
- Chance of flooding over 30 yrs
- 0.0%
- Est. flood insurance / yr
- $507 – $1,088
Fire risk 4/10 · Minor
- Est. fire insurance / yr
- $783 – $1,453
Heat risk 6/10 · Moderate
- Hot days now (above 104°F)
- 7 days/yr
- Hot days in 30 yrs
- 16 days/yr
Wind risk 5/10 · Moderate
- Chance of severe wind over 30 yrs
- 24.0%
Air-quality risk 3/10 · Minor
- Unhealthy air days now
- 3 days/yr
- Unhealthy air days in 30 yrs
- 3 days/yr
Risk factors via First Street. Map © Google.
Why this score? — see what drove the B- grade
The composite is a weighted blend of 9 inputs, each scored 0–100. Each bar is that input's sub-score; the figure is the points it added to the 100-point composite (weight × sub-score).
- Cash flow +25.9/30.0
- ARV discount +15.0/15.0
- DSCR +8.7/10.0
- 1% rule +5.5/10.0
- Schools +5.4/10.0
- Livability +3.4/5.0
- Rent growth +2.7/5.0
- Condition / age +2.5/5.0
- Appreciation +0.0/10.0
$189,900
🖨 Deal sheet (PDF) 📄 Offer letter ✓ Due diligence
Listing remarks
2010 Year Model Clayton Manufactured Home Approximately 1140 Sq Ft New Roof, New HVAC, New Hot Water Heater, New Floor Covering and Paint, New Stainless Side by Side Refrigerator with Water and Ice, Dishwasher and Smooth Top Range, Primary Bath with Dual Sinks Vanity, Dual Closets, Soaker Tub and Separate Shower, Central Heat and Air, Vinyl Tilt Windows, Permanent Foundation Brick Underpinned, Nice Front Deck, Concrete Drive, Conveniently Located, Nice Partially Wooded . 19 Acre Lot, Storage Shed, Public Water and Sewer. Really Nice almost Complete Remodel. Shows like New!
Key facts
- 8,276 sq ft lot
- Built 2010
- Listed 22 days
Neighborhood map
What this means for you Summary
Snapshot
- This is a 3-bed/2.0-bath single-family listed at $190k.
Deal economics
- At list price, monthly cash flow is $467 ($6k/yr) — positive.
- The deal already cash-flows at list — no discount required.
- Meets the 1% rule at list price ($2k rent vs $190k).
- Recommended offer: $187k (1.5% below list) — sets the bar for market timing.
- Cap rate 9.2% vs local median 2.5% in Lake Wylie — top-decile yield for the area; either an underpriced asset or a hidden risk that comps aren't pricing in. Stress-test before assuming the spread holds.
Location & tenants
- Location reads 68/100 on livability (#85 in SC) — a middle-class / working-renter tenant base. Strengths: employment A+, housing A+, crime A; Watch: cost of living D, amenities F, commute F.
- York 02 (rural): math 61% / reading 63% proficiency, ranked #2 of 80 in SC (top 2%) — acceptable for families but not a draw, mixed tenant base, ~2y average lease.
- Zoned schools: Oakridge Elementary (math 74% / reading 65%, grade A-, #38 of 597 statewide, top 7%, 838 students, 29% FRL) — zoned schools at 29% FRL track the district average.
- Market conditions: Rents flat; 356 active listings in the ZIP; 2 comparable units currently listed for rent nearby; solid renter incomes; 2,550 units permitted in York County in 2024 (350 in 5+ unit buildings).
Forward outlook
- Local home prices are declining (-3.0%/yr); year-one equity from $1k of loan paydown is wiped out by about $6k of value loss. Plan a longer hold.
- York County population projected at +44% by 2050 — long-run rental-demand tailwind backs the buy-and-hold thesis.
Negotiation context
- It's been on market 22 days — a 2% lower offer ($187k) is reasonable based on typical stale-listing flexibility.
- Current owner paid $29k; list at $190k implies a 555% gain — meaningful room to come down on a strong offer.
Risks & watch-outs
- Climate carrying-cost: moderate wind risk, 24% chance of damaging wind over 30y; extreme-heat days projected 7→16/yr by 2055 (HVAC capex compounding) — expect insurance premiums to compound above CPI over the hold.
Questions for the listing agent
- Is there a deadline driving the sale (1031 exchange, divorce, estate, relocation)? That informs how much negotiation room exists.
- What's the average days-on-market for RENTAL listings here right now (not sales)? A rising rental-DOM trend means longer vacancies and softer asking-rent achievability than the comps imply.
- What's the recent tenant-quality profile in this submarket — average credit score on applications, eviction rate, late-payment / NSF rate, and stable-employment percentage? A property-management company in the area should have these aggregated.
- How much new for-sale + rental construction is in the pipeline within 1–3 miles? Heavy new supply typically softens prices + rents 12–24 months out; constrained supply supports both.
Investment metrics
- 1% rule
- 1.05% ✓
- Cap rate
- 9.24%
- Cash-on-cash
- 10.54%
- DSCR
- 1.47
- GRM
- 7.9
CMA / ARV
- ARV (on-the-fly)
- $249,280
- Comps found
- 2
Show comp detail 2 sales within ~0.75 mi
| Address | Dist | Beds/Ba | Sqft | Sold | Price | $/sf | Match |
|---|---|---|---|---|---|---|---|
| 1162 State Line Rd | 0.00mi | 3/2.0 | 1,140 (-6%) | 1mo | $189,000 | $166 | 89 |
| 210 Valley View Dr | 0.73mi | 3/2.0 | 1,340 (+10%) | 8mo | $275,000 | $205 | 43 |
Match score weights: distance 35% · size 25% · config 20% · recency 20%. Top-matched comps best support the ARV.
Projected returns pro-forma
-3.0% appreciation · 0.88% rent growth · sell at horizon
- IRR
- -2.7%
- Equity multiple
- 0.90×
- Total profit
- $-5,296
- Equity at exit
- $28,315
- IRR
- 4.7%
- Equity multiple
- 1.32×
- Total profit
- $16,891
- Equity at exit
- $16,419
Cash invested: $53,172 (down + closing). Projections, not guarantees.
Landlord ↔ Tenant lean methodology
- Overall (STATE)
- 90 Strongly Landlord-Friendly
- State South Carolina
- 90 Strongly Landlord-Friendly · R+6
- County
- — inherits STATE
- City
- — inherits STATE
ZIP-level market 29710
- Rents YoY
- 0.9%
- Active inventory
- 356
- Price-to-rent
- 7.9×
Monthly cashflow live
- Estimated rent
- $1,999 medium interval (Pro) →
- Mortgage (P&I)
- −$996
- Tax from tax record
- −$37 /mo · $446/yr
- Insurance
- −$79
- HOA
- −$0
- Vacancy / Maint / Mgmt
- −$420
- Net cashflow
- $467
Break-even live
Sensitivity live
| Price | -10% $575 | -5% $521 | +0% $467 | +5% $413 | +10% $360 |
|---|---|---|---|---|---|
| Rent | -10% $309 | -5% $388 | +0% $467 | +5% $546 | +10% $625 |
| Rate | -1.0pp $563 | -0.5pp $515 | base $467 | +0.5pp $418 | +1.0pp $368 |
UW: 25.0% down · 7.5% · 30yr · 1.5% tax · 5.0% vac · 8.0% maint · 8.0% mgmt
Financing live
Cash to close
- Down payment
- $47,475
- Closing costs
- $5,697
- Reserves months
- —
- Total cash needed
- —
Loan-product check · same deal, 3 products live
Conventional
25% down · 7.5% · 30yr
- Down + closing
- —
- Monthly P&I
- —
- Monthly cashflow
- —
- DSCR
- —
- Eligible?
- —
Personal DTI + credit; lowest rate.
DSCR
20% down · 8.5% · 30yr
- Down + closing
- —
- Monthly P&I
- —
- Monthly cashflow
- —
- DSCR
- —
- Eligible?
- —
No personal income docs; deal must DSCR.
Hard money
10% down · 12.0% · 12mo
- Down + closing
- —
- Monthly P&I
- —
- Monthly cashflow
- —
- DSCR
- —
- Eligible?
- —
Short-term bridge; refi at stabilization.
Rent comps 2 comps
| Address | Beds | Baths | Sqft | Rent | $/sqft | DOM | Units | Dist |
|---|---|---|---|---|---|---|---|---|
| Main LN Lake Wylie, SC | 3.0 | 2.0 | 938 | $1,400 | $1.49 | 24d | 1 | 0.36mi |
| 128 Summerglen Dr Gastonia, NC | 3.0 | 2.0 | 1188 | $1,600 | $1.35 | 12d | 1 | 1.18mi |
Listing history 4 events
-
2026-04-17status Pending
-
2026-04-09price $189,900
-
2026-03-26$199,900 Active
-
1996-08-30soldstatus $29,000
ⓘ Source: listings_history table (triggers on properties + properties_extension) + one-shot
backfill from property_details.listing_events for pre-trigger history.
Tax reassessment forecast SC · Resets to sale price
- Current annual tax
- $446 · $37/mo
- Projected year-2 tax
- $1,082 · $90/mo
- Expected delta
- +$636/yr (+$53/mo · 142.5%)
ⓘ Screening estimate from a state-policy table — verify with the county assessor before closing.
Climate risk First Street
- Flood 1/10 Low FEMA zone X (unshaded) · 0% chance over 30 yrs
- Wildfire 4/10 Moderate
- Heat 6/10 Major 7 d/yr ≥104°F today · 16 d/yr by 30 yrs out
- Wind 5/10 Major 24% chance of damaging wind over 30 yrs
- Air quality 3/10 Moderate 3 unhealthy d/yr today · 3 by 30 yrs out
Nearby sold comps map
Loading sold comps map…
Walkable amenities ~0.75 mi
Loading nearby amenities…
Taxation est. · year 1
- Rental income
- $23,988
- − Mortgage interest
- −$10,637
- − Property taxes
- −$446
- − Insurance
- −$950
- − Repairs & maintenance
- −$1,919
- − Management
- −$1,919
- − Depreciation
- −$5,524
- Taxable income
- $2,592
- Est. tax owed @ 24.0%
- −$622
- After-tax cash flow
- $4,982/yr
For passive investors: Depreciation is non-cash, so a rental often shows a tax loss while cash-flowing — sheltering income. Rental losses are passive: they offset passive income freely, and up to $25,000/yr can offset ordinary (W-2) income if you actively participate and your MAGI is under $100k (phasing out to $0 by $150k); unused losses carry forward. On sale, claimed depreciation is recaptured at up to 25%, and gains may owe capital-gains tax (a 1031 exchange can defer both). Figures are a year-1 estimate at your 24.0% rate — not tax advice; consult a CPA.
Schools (NCES district)
- District
- York 02
- NCES district ID
- 4503840
- Math proficiency
- 61% ▼ -4.00%
- Reading proficiency
- 63% ▲ 3.00%
- Median HH income
- $60,598
- Composite
- 53.74/100
- National rank
- #1421
- State rank
- #2 of 80 in SC
Livability — Lake Wylie
- Score
- 68/100
- State rank
- #85
- US rank
- #9884
Category grades
Schools grade is shown separately in the Schools card above.
Census & demographics
- County
- York County · 281,758 people
- Metro
- Charlotte-Concord-Gastonia, NC-SC
- Population (ZIP)
- 40,595
- Household income
- $96,563
- Rent vs Own
- Severe rent burden
- 569.0
Population outlook (York County) Hauer SSP2
- Today (2025)
- 307,757 people
- By 2030
- 335,979 · +9.2%
- By 2040
- 391,378 · +27.2%
- By 2050
- 443,234 · +44.0%
- By 2075
- 557,102 · +81.0%
- By 2100
- 625,837 · +103.4%
Race, ethnicity, and origin ACS 2023
- Neighborhood character
- Predominantly White (77%)
- Race & ethnicity
- White 77% Black 10% Hispanic / Latino 8% Two or more races 7%
- Hispanic origin (detail)
- Mexican 2% Cuban 1%
- Common ancestry
- Serbian 4% Slovak 3% Romanian 2%
- Foreign-born
- 4% · Canada, Jamaica
- Languages at home
- 94% English-only · Spanish 4% Other Indo-European 1%
Political lean MEDSL · York
- 2024 margin
- R (+19.1) · D 39.7% · R 58.8% · Other 1.5%
- 2008→2024 swing
- -1.4pp toward R · 2008: -17.7pp · 2024: -19.1pp
- All cycles
- 2024: R+19.1 2020: R+16.5 2016: R+22.1 2012: R+20.5 2008: R+17.7
Not yet ingested
- Civics
- —
Market trends
- HPI YoY
- ▼ -194.83%
- Current HPI
- 252.3011
- Rent YoY
- ▲ 0.88%
- Metro
- Charlotte-Concord-Gastonia, NC-SC
- State GDP YoY
- ▲ 4.51%
- F500 in state
- 2
Industry mix (Fortune 500 HQ in SC)
| Industry | F500 HQs | Revenue |
|---|---|---|
| Packaging | 1 | $7B |
|
||
Price history
+554.8% since first listed4 events — show timeline
- 2026-04-17 Pending — CANOPYMLS as Distributed by MLS Grid
- 2026-04-09 Price Changed $189,900 CANOPYMLS as Distributed by MLS Grid
- 2026-03-26 Listed $199,900 CANOPYMLS as Distributed by MLS Grid
- 1996-08-30 Sold (Public Records) $29,000 Public Records
Property tax history
+2.1%/yrLatest (2025): $446 · -3.1% YoY. Source: county tax records.
Cash-flow waterfall
monthlySold comps — $/sqft
last 12 mo · ≤1 miLoading sold comps…