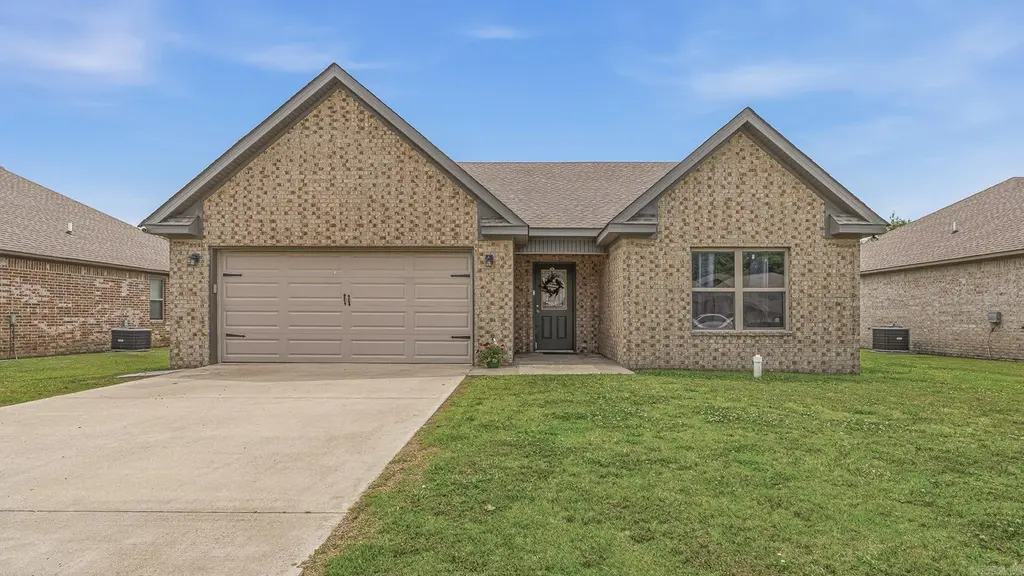
111 Cameron · Brookland, AR
Flood risk 1/10 · Minimal
- FEMA flood zone
- X
- Chance of flooding over 30 yrs
- 0.0%
- Est. flood insurance / yr
- $507 – $1,088
Fire risk 4/10 · Minor
- Est. fire insurance / yr
- $1,499 – $2,785
Heat risk 5/10 · Moderate
- Hot days now (above 110°F)
- 7 days/yr
- Hot days in 30 yrs
- 21 days/yr
Wind risk 4/10 · Minor
- Chance of severe wind over 30 yrs
- 8.0%
Air-quality risk 1/10 · Minimal
- Unhealthy air days now
- 0 days/yr
- Unhealthy air days in 30 yrs
- 0 days/yr
Risk factors via First Street. Map © Google.
Why this score? — see what drove the D- grade
The composite is a weighted blend of 9 inputs, each scored 0–100. Each bar is that input's sub-score; the figure is the points it added to the 100-point composite (weight × sub-score).
- Appreciation +10.0/10.0
- Cash flow +9.6/30.0
- Schools +3.6/10.0
- Livability +3.5/5.0
- DSCR +2.7/10.0
- Rent growth +2.5/5.0
- Condition / age +2.5/5.0
- ARV discount +2.2/15.0
- 1% rule +1.8/10.0
$210,000
🖨 Deal sheet 📄 Offer letter ✓ Due diligence
Listing remarks
The words Move-in ready get thrown around a lot. .. but THIS one actually means it! 3 bedrooms, 2 bathrooms, Split floor plan, Granite Countertops, Stainless Appliances, Oversized pantry, Huge fenced backyard, All brick exterior. From the acid-stained floors to the spacious primary suite and backyard made for summer nights, this home just feels GOOD the second you walk in. And lets be honest. .. finding a clean, stylish home in Brookland School District with this much charm? Is Hard to beat!!
Key facts
- Stainless appliances
- Split floor plan
- Granite countertops
Tags
Property features AI
Finance
- Financial info: Financing options may include VA, FHA, Conventional, Rural Development, cash, or in-house financing
Exterior
- Parking: Garage for 2 cars
- Utilities: Public sewer; Public water; Municipal electric service (Entergy available)
- Home design: Single-family property; Approximately 1,282 square feet
- Construction: Slab foundation; Architectural shingle roof
- Exterior features: Brick exterior; Porch; Fully fenced yard with wood fence; Paved road access; Level lot; Located inside city limits
Interior
- Kitchen: Free-standing stove; Microwave; Electric range; Dishwasher
- Flooring: Concrete floors
- Bathrooms: 2 full bathrooms
- Heating & cooling: Central electric heating; Central electric cooling
- Interior features: Walk-in closets; Ceiling fans; Kitchen counters with granite slab; Sheetrock walls and ceilings
- Laundry & utility: Laundry room
Neighborhood map
What this means for you Summary
Snapshot
- This is a 3-bed/2.0-bath single-family listed at $210k.
Deal economics
- At list price, monthly cash flow is $-141 ($-2k/yr) — negative.
- To cash-flow at today's rent, offer at most $185k (11.8% below list).
- To meet the 1% rule (rent ≥ 1% of price), the offer needs to be $143k (32.1% below list).
- Recommended offer: $143k (32.1% below list) — sets the bar for 1% rule.
- Cap rate 5.5% vs local median 4.1% in Brookland — top-decile yield for the area; either an underpriced asset or a hidden risk that comps aren't pricing in. Stress-test before assuming the spread holds.
Location & tenants
- Location reads 70/100 on livability (#57 in AR) — a middle-class / working-renter tenant base. Strengths: cost of living A+, housing A+, health & safety A; Watch: crime D, amenities F, commute F.
- Brookland School District (suburban): math 45% / reading 39% proficiency, ranked #47 of 238 in AR (top 20%) — families likely to look elsewhere, expect single-tenant / working-renter base with shorter leases.
- Market conditions: 117 active listings in the ZIP; 5 comparable units currently listed for rent nearby; rentals lingering (median 44d on market — plan ~5-8 weeks vacancy on turnover, expect pricing pressure); 100% of comp listings sitting > 30 days — soft ceiling on asking rent; 926 units permitted in Craighead County in 2024 (69 in 5+ unit buildings).
Forward outlook
- In year one you build about $22k of equity ($1k loan paydown + $21k appreciation (10.0% local appreciation)).
- Craighead County population projected at +38% by 2050 — long-run rental-demand tailwind backs the buy-and-hold thesis.
- By year 2, paydown + projected appreciation supports a ~$36k cash-out refi (75% LTV) — recoverable capital for the next deal without selling this one.
Negotiation context
- It's been on market 34 days — a 3% lower offer ($204k) is reasonable based on typical stale-listing flexibility.
- 8 sale attempts since 8y ago with the ask held roughly flat each time — persistent listings suggest the price (not the market) is what's stuck; bring a comps-based counter.
Risks & watch-outs
- Climate carrying-cost: extreme-heat days projected 7→21/yr by 2055 (HVAC capex compounding) — expect insurance premiums to compound above CPI over the hold.
Questions for the listing agent
- What do current leases actually rent for vs. the listed asking? Can we see a recent rent roll and the last 12 months of T-12 income?
- It's been on market 34 days. Have you received any prior offers? Is the seller open to a 32% concession, seller financing, or rate buy-down credit?
- Is there a deadline driving the sale (1031 exchange, divorce, estate, relocation)? That informs how much negotiation room exists.
- Crime grade is D in this area — have there been break-ins, vandalism, or insurance claims at this property in the last 3 years? What carrier currently insures it and at what premium?
- The area grade is low — what's the realistic commute time and amenity access for the typical tenant pool here? Any planned neighborhood developments (good or bad) we should know about?
- What's the average days-on-market for RENTAL listings here right now (not sales)? A rising rental-DOM trend means longer vacancies and softer asking-rent achievability than the comps imply.
- What's the recent tenant-quality profile in this submarket — average credit score on applications, eviction rate, late-payment / NSF rate, and stable-employment percentage? A property-management company in the area should have these aggregated.
- How much new for-sale + rental construction is in the pipeline within 1–3 miles? Heavy new supply typically softens prices + rents 12–24 months out; constrained supply supports both.
Investment metrics
- 1% rule
- 0.68% ✗
- Cap rate
- 5.49%
- Cash-on-cash
- -2.87%
- DSCR
- 0.87
- GRM
- 12.3
CMA / ARV
- ARV (median comp)
- $187,863
- List price
- $210,000
- Delta
- 11.78%
- Verdict
- OVERPRICED
- Comps
- 20 within 1.0 mi
Show comp detail 12 sales within ~0.75 mi
| Address | Dist | Beds/Ba | Sqft | Sold | Price | $/sf | Match |
|---|---|---|---|---|---|---|---|
| 626 N Holman St | 0.24mi | 3/2.0 | 1,272 (-1%) | 1mo | $133,900 | $105 | 87 |
| 105 Cameron Ave | 0.04mi | 3/2.0 | 1,356 (+6%) | 5mo | $218,000 | $161 | 85 |
| 114 Oak Meadow Cir | 0.27mi | 3/1.5 | 1,248 (-3%) | 3mo | $164,500 | $132 | 79 |
| 305 W School St | 0.51mi | 3/2.0 | 1,294 (+1%) | 1mo | $185,000 | $143 | 74 |
| 587 E Matthews St | 0.37mi | 4/2.0 (+1) | 1,320 (+3%) | 1mo | $188,000 | $142 | 72 |
| 125 Logan | 0.39mi | 3/2.0 | 1,200 (-6%) | 2mo | $182,000 | $152 | 70 |
| 314 W School | 0.59mi | 3/2.0 | 1,228 (-4%) | 7mo | $177,000 | $144 | 60 |
| 322 W School | 0.61mi | 3/2.0 | 1,209 (-6%) | 5mo | $179,900 | $149 | 58 |
| 104 Weston Cv | 0.57mi | 3/2.0 | 1,380 (+8%) | 4mo | $198,500 | $144 | 57 |
| 126 Ellis Dr | 0.60mi | 3/2.0 | 1,386 (+8%) | 2mo | $218,850 | $158 | 56 |
| 101 Ellis Dr | 0.60mi | 3/2.0 | 1,436 (+12%) | 2mo | $220,000 | $153 | 50 |
| 107 Ellis Dr | 0.75mi | 4/2.0 (+1) | 1,470 (+15%) | 3mo | $212,500 | $145 | 33 |
Match score weights: distance 35% · size 25% · config 20% · recency 20%. Top-matched comps best support the ARV.
Projected returns pro-forma
10.0% appreciation · 3.0% rent growth · sell at horizon
- IRR
- 22.2%
- Equity multiple
- 2.79×
- Total profit
- $105,311
- Equity at exit
- $189,185
- IRR
- 19.9%
- Equity multiple
- 6.39×
- Total profit
- $316,995
- Equity at exit
- $407,984
Cash invested: $58,800 (down + closing). Projections, not guarantees.
Landlord ↔ Tenant lean methodology
- Overall (STATE)
- 92 Strongly Landlord-Friendly
- State Arkansas
- 92 Strongly Landlord-Friendly · R+14
- County
- — inherits STATE
- City
- — inherits STATE
ZIP-level market 72417
- Home prices YoY
- 20.6%
- Active inventory
- 117
- Price-to-rent
- 12.3×
Monthly cashflow live
- Estimated rent
- $1,426 high interval (Pro) →
- Mortgage (P&I)
- −$1,101
- Tax from tax record
- −$79 /mo · $942/yr
- Insurance
- −$88
- HOA
- −$0
- Vacancy / Maint / Mgmt
- −$299
- Net cashflow
- $-141
Break-even live
UW: 25.0% down · 7.5% · 30yr · 1.5% tax · 5.0% vac · 8.0% maint · 8.0% mgmt
Financing live
Cash to close
- Down payment
- $52,500
- Closing costs
- $6,300
- Reserves months
- —
- Total cash needed
- —
Loan-product check · same deal, 3 products live
Conventional
25% down · 7.5% · 30yr
- Down + closing
- —
- Monthly P&I
- —
- Monthly cashflow
- —
- DSCR
- —
- Eligible?
- —
Personal DTI + credit; lowest rate.
DSCR
20% down · 8.5% · 30yr
- Down + closing
- —
- Monthly P&I
- —
- Monthly cashflow
- —
- DSCR
- —
- Eligible?
- —
No personal income docs; deal must DSCR.
Hard money
10% down · 12.0% · 12mo
- Down + closing
- —
- Monthly P&I
- —
- Monthly cashflow
- —
- DSCR
- —
- Eligible?
- —
Short-term bridge; refi at stabilization.
Rent comps 5 comps
| Address | Beds | Baths | Sqft | Rent | $/sqft | DOM | Units | Dist |
|---|---|---|---|---|---|---|---|---|
| 300 Story St Brookland, AR | 3.0 | 2.0 | 1200 | $1,270 | $1.06 | 43d | 1 | 0.17mi |
| 338 Story St Brookland, AR | 3.0 | 2.0 | 1250 | $1,270 | $1.02 | 43d | 1 | 0.17mi |
| 315 Story St Brookland, AR | 3.0 | 2.0 | 1250 | $1,270 | $1.02 | 43d | 1 | 0.21mi |
| 203 N Bernis St Brookland, AR | 3.0 | 2.0 | 1328 | $1,550 | $1.17 | 43d | 1 | 0.35mi |
| 105 Cherry St Brookland, AR | 3.0 | 2.0 | 1170 | $1,575 | $1.35 | 43d | 1 | 0.39mi |
Listing history 31 events
-
2026-06-16status $210,000 Under Contract 34 DOM
-
2026-06-15days on market $210,000 Active 34 DOM
-
2026-06-14days on market $210,000 Active 32 DOM
-
2026-06-13statusdays on market $210,000 Active 31 DOM
-
2026-06-10days on market $210,000 Price Change 29 DOM
-
2026-06-09days on market $210,000 Price Change 28 DOM
-
2026-06-08days on market $210,000 Price Change 27 DOM
-
2026-06-07pricestatusdays on market $210,000 Price Change 26 DOM
-
2026-06-05days on market $214,900 Active 23 DOM
-
2026-06-02days on market $214,900 Active 21 DOM
-
2026-06-01days on market $214,900 Active 20 DOM
-
2026-05-31days on market $214,900 Active 19 DOM
-
2026-05-30days on market $214,900 Active 18 DOM
-
2026-05-12$214,900 Active 497-char remark
-
2026-05-12$214,900 New Listing 497-char remark
-
2026-03-01price $216,900
-
2026-02-10$221,000 Active
-
2024-08-05soldstatus $209,900
-
2024-07-22soldstatus $209,900 Closed
-
2024-07-22soldstatus $209,900 Sold
-
2024-06-26historical
-
2024-06-25historical Take Backups
-
2024-06-20$209,900 New Listing
-
2024-06-14$209,900 Active
-
2020-06-02historical
-
2020-06-01soldstatus $158,000
-
2019-12-03$160,000
-
2019-12-02$160,000
-
2019-05-07historical
-
2018-11-08$144,425
-
2018-11-08$144,425
ⓘ Source: listings_history table (triggers on properties + properties_extension) + one-shot
backfill from property_details.listing_events for pre-trigger history.
Tax reassessment forecast AR · Resets to sale price
- Current annual tax
- $942 · $79/mo
- Projected year-2 tax
- $1,344 · $112/mo
- Expected delta
- +$402/yr (+$33/mo · 42.6%)
ⓘ Screening estimate from a state-policy table — verify with the county assessor before closing.
Climate risk First Street
- Flood 1/10 Low FEMA zone X · 0% chance over 30 yrs
- Wildfire 4/10 Moderate
- Heat 5/10 Major 7 d/yr ≥110°F today · 21 d/yr by 30 yrs out
- Wind 4/10 Moderate 8% chance of damaging wind over 30 yrs
- Air quality 1/10 Low 0 unhealthy d/yr today · 0 by 30 yrs out
Nearby sold comps map
Loading sold comps map…
Walkable amenities ~0.75 mi
Loading nearby amenities…
Taxation est. · year 1
- Rental income
- $17,111
- − Mortgage interest
- −$11,763
- − Property taxes
- −$942
- − Insurance
- −$1,050
- − Repairs & maintenance
- −$1,369
- − Management
- −$1,369
- − Depreciation
- −$6,109
- Taxable loss
- −$5,491
- Est. tax savings @ 24.0%
- +$1,318
- After-tax cash flow
- $-372/yr
For passive investors: Depreciation is non-cash, so a rental often shows a tax loss while cash-flowing — sheltering income. Rental losses are passive: they offset passive income freely, and up to $25,000/yr can offset ordinary (W-2) income if you actively participate and your MAGI is under $100k (phasing out to $0 by $150k); unused losses carry forward. On sale, claimed depreciation is recaptured at up to 25%, and gains may owe capital-gains tax (a 1031 exchange can defer both). Figures are a year-1 estimate at your 24.0% rate — not tax advice; consult a CPA.
Schools (NCES district)
- District
- Brookland School District
- NCES district ID
- 0503640
- Math proficiency
- 45% ▼ -15.00%
- Reading proficiency
- 39% ▼ -16.00%
- Median HH income
- $52,226
- Composite
- 36.4/100
- National rank
- #4678
- State rank
- #47 of 238 in AR
Livability — Brookland
- Score
- 70/100
- State rank
- #57
- US rank
- #7817
Category grades
Schools grade is shown separately in the Schools card above.
Census & demographics
- Census place
- Brookland, AR
- County
- Craighead County · 97,185 people
- City population
- 5,940
- Metro
- Jonesboro, AR
- Population (ZIP)
- 5,940
- Household income
- $61,964
- Rent vs Own
- Severe rent burden
- 152.0
Population outlook (Craighead County) Hauer SSP2
- Today (2025)
- 122,235 people
- By 2030
- 131,338 · +7.4%
- By 2040
- 149,862 · +22.6%
- By 2050
- 168,034 · +37.5%
- By 2075
- 208,094 · +70.2%
- By 2100
- 233,251 · +90.8%
Race, ethnicity, and origin ACS 2023
- Neighborhood character
- Predominantly White (91%)
- Race & ethnicity
- White 91% Two or more races 5% Black 2% Hispanic / Latino 2%
- Common ancestry
- Slovak 3% Italian 3%
- Foreign-born
- 1% · Canada, South Korea
Political lean MEDSL · Craighead
- 2024 margin
- Solid R (+37.4) · D 30.1% · R 67.5% · Other 2.4%
- 2008→2024 swing
- -12.9pp toward R · 2008: -24.5pp · 2024: -37.4pp
- All cycles
- 2024: R+37.4 2020: R+35.4 2016: R+35.2 2012: R+31.1 2008: R+24.5
Not yet ingested
- Civics
- —
Market trends
- HPI YoY
- ▲ 56.75%
- Current HPI
- 331.5025
- Rent YoY
- —
- Metro
- Jonesboro, AR
- State GDP YoY
- ▲ 3.80%
- F500 in state
- 10
Industry mix (Fortune 500 HQ in AR)
| Industry | F500 HQs | Revenue |
|---|---|---|
| Retail | 1 | $681B |
|
||
| Food / Agriculture | 1 | $53B |
|
||
| Retail / Energy | 1 | $22B |
|
||
| Transportation / Logistics | 1 | $12B |
|
||
| Energy | 1 | $4B |
|
||
Price history
+45.4% since first listed20 events — show timeline
- 2026-06-16 Pending — CARMLS
- 2026-06-06 Price Changed $210,000 CARMLS
- 2026-06-05 Price Changed $210,000 NEABOR MLS
- 2026-05-12 Listed $214,900 CARMLS
- 2026-03-01 Price Changed $216,900 NEABOR MLS
- 2026-02-10 Listed $221,000 NEABOR MLS
- 2024-08-05 Sold (Public Records) $209,900 Public Records
- 2024-07-22 Sold (MLS) $209,900 NEABOR MLS
- 2024-07-22 Sold (MLS) $209,900 CARMLS
- 2024-06-26 Delisted — NEABOR MLS
- 2024-06-25 Contingent — CARMLS
- 2024-06-20 Listed $209,900 CARMLS
- 2024-06-14 Listed $209,900 NEABOR MLS
- 2020-06-02 Listing Removed — CARMLS
- 2020-06-01 Sold (MLS) $158,000 NEABOR MLS
- 2019-12-03 Listed $160,000 CARMLS
- 2019-12-02 Listed $160,000 NEABOR MLS
- 2019-05-07 Listing Removed — CARMLS
- 2018-11-08 Listed $144,425 NEABOR MLS
- 2018-11-08 Listed $144,425 CARMLS
Property tax history
+18.6%/yrLatest (2025): $942 · +6.7% YoY. Source: county tax records.
Cash-flow waterfall
monthlySold comps — $/sqft
last 12 mo · ≤1 miLoading sold comps…