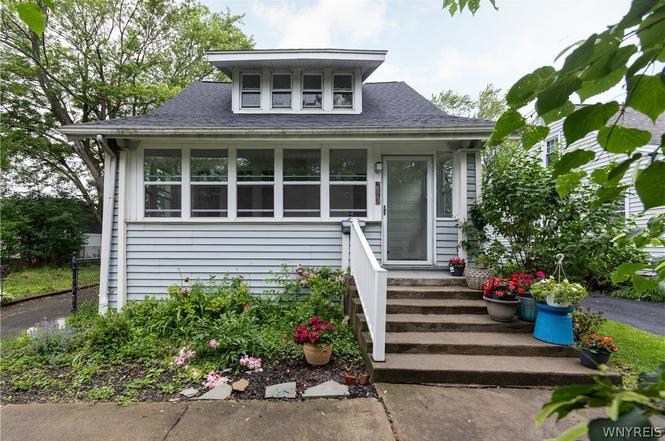
167 Royal Pkwy W · Cheektowaga, NY
Flood risk 1/10 · Minimal
- FEMA flood zone
- X (unshaded)
- Chance of flooding over 30 yrs
- 0.0%
- Est. flood insurance / yr
- $473 – $860
Fire risk 1/10 · Minimal
- Est. fire insurance / yr
- $691 – $1,283
Heat risk 2/10 · Minimal
- Hot days now (above 92°F)
- 7 days/yr
- Hot days in 30 yrs
- 14 days/yr
Wind risk 1/10 · Minimal
- Chance of severe wind over 30 yrs
- —
Air-quality risk 3/10 · Minor
- Unhealthy air days now
- 2 days/yr
- Unhealthy air days in 30 yrs
- 3 days/yr
Risk factors via First Street. Map © Google.
Why this score? — see what drove the D+ grade
The composite is a weighted blend of 9 inputs, each scored 0–100. Each bar is that input's sub-score; the figure is the points it added to the 100-point composite (weight × sub-score).
- ARV discount +15.0/15.0
- Cash flow +10.9/30.0
- Schools +6.3/10.0
- Livability +4.2/5.0
- Rent growth +3.8/5.0
- 1% rule +3.7/10.0
- DSCR +3.2/10.0
- Condition / age +2.5/5.0
- Appreciation +0.0/10.0
$325,000
🖨 Deal sheet (PDF) 📄 Offer letter ✓ Due diligence
Listing remarks MLS
VR pricing. Seller will accept offers between 235,000 to 245,000. Completely remodeled 4 Bedroom 2 full bathroom home in Williamsville School District. NEW BOILER JUST INSTALLED!! Enclosed front porch area with new windows and new flooring welcome you home. Large dining room/living room combo. Relax on the cozy window seat in the living room. Newly tiled wood burning fireplace and beautiful new flooring throughout. Huge, completely renovated kitchen with custom cabinets, tile flooring, tile backsplash, and granite countertop. Pantry area. Appliances are negotiable. Newer windows, 2 bedrooms and 1 full bathroom on first floor and 2 large bedrooms and 1 full bath on second floor. Tons of closet space. Double closets in master bedroom. All brand new carpeting. Second floor has a sitting area that could be used as a retreat for reading that great book or could be an office area. Fully fenced in yard. Concrete patio in backyard. HWT 2017. Make an appointment today. You don't want to miss out on this beautiful home.
Key facts
- Second floor loft
- Granite countertops
- Two full bathrooms
Tags
Property features AI
Exterior
- Parking: No garage
- Utilities: Electricity connected with circuit breakers; Public water connected; Sewer connected; High-speed internet available
- Home design: Two-story house; Existing construction
- Construction: Vinyl siding; Copper plumbing; Asphalt roof; Block and stone foundation; Built previously (existing)
- Exterior features: Blacktop driveway; Fully fenced yard; Private yard; Patio; Shed(s) / exterior storage; See remarks
Interior
- Kitchen: Granite counters; Gas oven and gas range; Dishwasher; Refrigerator; Eat-in kitchen
- Bedrooms: Two main-level bedrooms
- Flooring: Ceramic tile; Laminate; Tile; Varies
- Bathrooms: Two full bathrooms total, one on the main level
- Heating & cooling: Gas heating with radiators; Zoned heating; Zoned cooling; Window unit(s)
- Interior features: Ceiling fans; Separate/formal dining room; Eat-in kitchen; Separate/formal living room; Granite counters; Living/dining room; Natural woodwork; Sunroom / Florida room; Full basement with sump pump
- Laundry & utility: Washer and dryer in basement
Neighborhood map
What this means for you Summary
Snapshot
- This is a 4-bed/2.0-bath single-family listed at $325k.
Deal economics
- At list price, monthly cash flow is $-143 ($-2k/yr) — negative.
- To cash-flow at today's rent, offer at most $300k (7.8% below list).
- To meet the 1% rule (rent ≥ 1% of price), the offer needs to be $282k (13.3% below list).
- Recommended offer: $282k (13.3% below list) — sets the bar for 1% rule.
- Cap rate 5.8% vs local median 3.8% in Cheektowaga — top-decile yield for the area; either an underpriced asset or a hidden risk that comps aren't pricing in. Stress-test before assuming the spread holds.
Location & tenants
- Location reads 84/100 on livability (#54 in NY, #811 nationally) — a professional / high-income tenant draw. Strengths: commute A+, housing A+, health & safety A+; Watch: crime C-.
- Williamsville Central School District (suburban): math 64% / reading 77% proficiency, ranked #114 of 590 in NY (top 19%) — strong family-tenant draw, lease renewals of 3-5y typical; only 10% free/reduced lunch — higher-income household profile.
- Market conditions: Rents rising fast (+5.0%/yr); 334 active listings in the ZIP; 5 comparable units currently listed for rent nearby; rentals leasing fast (median 3d on market — plan ~1-2 weeks tenant-placement turnaround); solid renter incomes; 1,244 units permitted in Erie County in 2024 (563 in 5+ unit buildings).
- This rent runs 33% of the median local income ($102k/yr) — at the standard rent-burdened threshold; future hikes will face affordability resistance.
Forward outlook
- Local home prices are declining (-3.0%/yr); year-one equity from $2k of loan paydown is wiped out by about $10k of value loss. Plan a longer hold.
Negotiation context
- Only 9 days on market — expect competitive offers; lowballing is unlikely to land.
- 5 sale attempts since 9y ago with the ask held roughly flat each time — persistent listings suggest the price (not the market) is what's stuck; bring a comps-based counter.
- Current owner paid $236k; 38% above their basis — modest negotiation headroom, anchor on the comps not their cost.
Risks & watch-outs
- Watch-outs: built in 1902 — expect roof / HVAC / electrical / plumbing capex.
Questions for the listing agent
- What do current leases actually rent for vs. the listed asking? Can we see a recent rent roll and the last 12 months of T-12 income?
- Built in 1902 — when were the roof, HVAC, electrical panel, plumbing, and water heater last replaced?
- Is there a deadline driving the sale (1031 exchange, divorce, estate, relocation)? That informs how much negotiation room exists.
- Schools are B-rated — typically a magnet for longer-tenancy family renters. What's the average tenant stay here, and is there a school-zone premium baked into asking?
- The area grade is low — what's the realistic commute time and amenity access for the typical tenant pool here? Any planned neighborhood developments (good or bad) we should know about?
- What's the average days-on-market for RENTAL listings here right now (not sales)? A rising rental-DOM trend means longer vacancies and softer asking-rent achievability than the comps imply.
- What's the recent tenant-quality profile in this submarket — average credit score on applications, eviction rate, late-payment / NSF rate, and stable-employment percentage? A property-management company in the area should have these aggregated.
- How much new for-sale + rental construction is in the pipeline within 1–3 miles? Heavy new supply typically softens prices + rents 12–24 months out; constrained supply supports both.
Investment metrics
- 1% rule
- 0.87% ✗
- Cap rate
- 5.76%
- Cash-on-cash
- -1.89%
- DSCR
- 0.92
- GRM
- 9.6
CMA / ARV
- ARV (on-the-fly)
- $409,962
- Comps found
- 12
Show comp detail 12 sales within ~0.75 mi
| Address | Dist | Beds/Ba | Sqft | Sold | Price | $/sf | Match |
|---|---|---|---|---|---|---|---|
| 274 Royal Pkwy W | 0.21mi | 4/2.0 | 1,742 (-4%) | 2mo | $395,000 | $227 | 83 |
| 135 Avalon Dr | 0.29mi | 3/2.0 (-1) | 1,812 (+0%) | 1mo | $325,000 | $179 | 80 |
| 132 Royal Pkwy E | 0.12mi | 3/1.5 (-1) | 1,742 (-4%) | 6mo | $395,000 | $227 | 77 |
| 37 Linwood Ave | 0.43mi | 4/1.5 | 1,795 (-1%) | 2mo | $295,000 | $164 | 75 |
| 207 N Harvest St | 0.67mi | 3/2.0 (-1) | 1,767 (-2%) | 2mo | $460,000 | $260 | 59 |
| 216 N Linden St | 0.71mi | 4/3.5 | 1,836 (+2%) | 1mo | $652,500 | $355 | 57 |
| 228 S Forest Rd | 0.27mi | 3/1.5 (-1) | 2,013 (+12%) | 6mo | $345,000 | $171 | 56 |
| 289 Huxley Dr | 0.69mi | 4/2.0 | 1,979 (+10%) | 3mo | $355,000 | $179 | 49 |
| 193 Huxley Dr | 0.64mi | 3/1.5 (-1) | 1,641 (-9%) | 2mo | $387,500 | $236 | 46 |
| 172 Lorfield Dr | 0.43mi | 3/1.0 (-1) | 1,603 (-11%) | 8mo | $285,000 | $178 | 46 |
| 111 Scamridge Curv | 0.71mi | 3/2.0 (-1) | 1,932 (+7%) | 7mo | $333,000 | $172 | 44 |
| 94 Walton Dr | 0.68mi | 3/2.5 (-1) | 1,994 (+10%) | 5mo | $497,000 | $249 | 39 |
Match score weights: distance 35% · size 25% · config 20% · recency 20%. Top-matched comps best support the ARV.
Projected returns pro-forma
-3.0% appreciation · 5.01% rent growth · sell at horizon
- IRR
- -17.0%
- Equity multiple
- 0.39×
- Total profit
- $-55,840
- Equity at exit
- $48,459
- IRR
- -5.4%
- Equity multiple
- 0.62×
- Total profit
- $-35,020
- Equity at exit
- $28,100
Cash invested: $91,000 (down + closing). Projections, not guarantees.
Landlord ↔ Tenant lean methodology
- Overall (STATE)
- 15 Strongly Tenant-Friendly
- State New York
- 15 Strongly Tenant-Friendly · D+10
- County
- — inherits STATE
- City
- — inherits STATE
ZIP-level market 14221
- Rents YoY
- 5.0%
- Active inventory
- 334
- Price-to-rent
- 9.6×
Monthly cashflow live
- Estimated rent
- $2,818 high interval (Pro) →
- Mortgage (P&I)
- −$1,704
- Tax from tax record
- −$529 /mo · $6,349/yr
- Insurance
- −$135
- HOA
- −$0
- Vacancy / Maint / Mgmt
- −$592
- Net cashflow
- $-143
Break-even live
Sensitivity live
| Price | -10% $41 | -5% $-51 | +0% $-143 | +5% $-235 | +10% $-327 |
|---|---|---|---|---|---|
| Rent | -10% $-366 | -5% $-254 | +0% $-143 | +5% $-32 | +10% $80 |
| Rate | -1.0pp $21 | -0.5pp $-60 | base $-143 | +0.5pp $-227 | +1.0pp $-313 |
UW: 25.0% down · 7.5% · 30yr · 1.5% tax · 5.0% vac · 8.0% maint · 8.0% mgmt
Financing live
Cash to close
- Down payment
- $81,250
- Closing costs
- $9,750
- Reserves months
- —
- Total cash needed
- —
Loan-product check · same deal, 3 products live
Conventional
25% down · 7.5% · 30yr
- Down + closing
- —
- Monthly P&I
- —
- Monthly cashflow
- —
- DSCR
- —
- Eligible?
- —
Personal DTI + credit; lowest rate.
DSCR
20% down · 8.5% · 30yr
- Down + closing
- —
- Monthly P&I
- —
- Monthly cashflow
- —
- DSCR
- —
- Eligible?
- —
No personal income docs; deal must DSCR.
Hard money
10% down · 12.0% · 12mo
- Down + closing
- —
- Monthly P&I
- —
- Monthly cashflow
- —
- DSCR
- —
- Eligible?
- —
Short-term bridge; refi at stabilization.
Rent comps 5 comps
| Address | Beds | Baths | Sqft | Rent | $/sqft | DOM | Units | Dist |
|---|---|---|---|---|---|---|---|---|
| 758 S Huth Rd Buffalo, NY | 5.0 | 2.0 | 2235 | $2,800 | $1.25 | 44d | 1 | 1.20mi |
| 512 Cayuga Rd Buffalo, NY | 3.0 | 1.0 | 1944 | $1,795 | $0.92 | 2d | 1 | 1.23mi |
| 239 Lehn Springs Dr Buffalo, NY | 3.0 | 1.0 | 1700 | $3,200 | $1.88 | 4d | 1 | 1.24mi |
| 44 Aurora Dr Buffalo, NY | 3.0 | 1.0 | 1272 | $3,300 | $2.59 | 2d | 1 | 1.40mi |
| 69 Berryman Dr Buffalo, NY | 4.0 | 1.5 | 2056 | $2,950 | $1.43 | 2d | 1 | 1.50mi |
Listing history 7 events
-
2026-06-21days on market $325,000 Active 9 DOM
-
2026-06-18days on market $325,000 Active 6 DOM
-
2026-06-17days on market $325,000 Active 5 DOM
-
2026-06-16days on market $325,000 Active 4 DOM
-
2026-06-15days on market $325,000 Active 3 DOM
-
2026-06-13remarks 699-char remark
-
2026-06-13$325,000 Active 1 DOM
ⓘ Source: listings_history table (triggers on properties + properties_extension) + one-shot
backfill from property_details.listing_events for pre-trigger history.
Tax reassessment forecast NY · Partial reset (capped growth)
- Current annual tax
- $6,349 · $529/mo
- Projected year-2 tax
- $6,349 · $529/mo
- Expected delta
- $0/yr ($0/mo · 0.0%)
ⓘ Screening estimate from a state-policy table — verify with the county assessor before closing.
Climate risk First Street
- Flood 1/10 Low FEMA zone X (unshaded) · 0% chance over 30 yrs
- Wildfire 1/10 Low
- Heat 2/10 Low 7 d/yr ≥92°F today · 14 d/yr by 30 yrs out
- Wind 1/10 Low
- Air quality 3/10 Moderate 2 unhealthy d/yr today · 3 by 30 yrs out
Nearby sold comps map
Loading sold comps map…
Walkable amenities ~0.75 mi
Loading nearby amenities…
Taxation est. · year 1
- Rental income
- $33,810
- − Mortgage interest
- −$18,205
- − Property taxes
- −$6,349
- − Insurance
- −$1,625
- − Repairs & maintenance
- −$2,705
- − Management
- −$2,705
- − Depreciation
- −$9,455
- Taxable loss
- −$7,233
- Est. tax savings @ 24.0%
- +$1,736
- After-tax cash flow
- $20/yr
For passive investors: Depreciation is non-cash, so a rental often shows a tax loss while cash-flowing — sheltering income. Rental losses are passive: they offset passive income freely, and up to $25,000/yr can offset ordinary (W-2) income if you actively participate and your MAGI is under $100k (phasing out to $0 by $150k); unused losses carry forward. On sale, claimed depreciation is recaptured at up to 25%, and gains may owe capital-gains tax (a 1031 exchange can defer both). Figures are a year-1 estimate at your 24.0% rate — not tax advice; consult a CPA.
Schools (NCES district)
- District
- Williamsville Central School District
- NCES district ID
- 3631470
- Math proficiency
- 64% ▼ -14.00%
- Reading proficiency
- 77% ▲ 6.00%
- Median HH income
- $79,907
- Composite
- 62.59/100
- National rank
- #678
- State rank
- #114 of 590 in NY
Livability — Cheektowaga
- Score
- 84/100
- State rank
- #54
- US rank
- #811
Category grades
Schools grade is shown separately in the Schools card above.
Census & demographics
- County
- Erie County · 714,559 people
- City population
- 55,470
- Metro
- Buffalo-Cheektowaga, NY
- Population (ZIP)
- 55,255
- Household income
- $101,615
- Rent vs Own
- Severe rent burden
- 1956.0
Population outlook (Erie County) Hauer SSP2
- Today (2025)
- 933,037 people
- By 2030
- 935,181 · +0.2%
- By 2040
- 928,531 · -0.5%
- By 2050
- 905,725 · -2.9%
- By 2075
- 834,037 · -10.6%
- By 2100
- 708,033 · -24.1%
Race, ethnicity, and origin ACS 2023
- Neighborhood character
- Predominantly White (84%)
- Race & ethnicity
- White 84% Asian 8% Two or more races 4% Hispanic / Latino 3% Black 2%
- Common ancestry
- Romanian 15% Lithuanian 2% Slovak 2%
- Foreign-born
- 10% · Canada, China, South Korea
- Languages at home
- 88% English-only · Other Indo-European 3% Other Asian/Pacific 2% Spanish 2%
Political lean MEDSL · Erie
- 2024 margin
- Lean D (+9.7) · D 54.8% · R 45.2%
- 2008→2024 swing
- -7.9pp toward R · 2008: 17.5pp · 2024: 9.7pp
- All cycles
- 2024: D+9.7 2020: D+14.7 2016: D+4.8 2012: D+15.6 2008: D+17.5
Not yet ingested
- Civics
- —
Market trends
- HPI YoY
- ▼ -301.37%
- Current HPI
- 322.6947
- Rent YoY
- ▲ 5.01%
- Metro
- Buffalo-Cheektowaga, NY
- State GDP YoY
- ▲ 2.60%
- F500 in state
- 92
Industry mix (Fortune 500 HQ in NY)
| Industry | F500 HQs | Revenue |
|---|---|---|
| Financial Services | 10 | $950B |
|
||
| Consumer Goods | 9 | $162B |
|
||
| Insurance | 4 | $225B |
|
||
| Telecommunications | 2 | $144B |
|
||
| Pharmaceuticals | 2 | $112B |
|
||
| Media / Entertainment | 2 | $69B |
|
||
Price history
+75.8% since first listed16 events — show timeline
- 2026-06-12 Listed $325,000 WNYREIS
- 2021-03-02 Sold (MLS) $236,000 WNYREIS
- 2020-12-17 Pending — WNYREIS
- 2020-12-14 Relisted — WNYREIS
- 2020-12-12 Pending — WNYREIS
- 2020-12-04 Price Changed $235,000 WNYREIS
- 2020-11-20 Price Changed $240,000 WNYREIS
- 2020-10-29 Price Changed $250,000 WNYREIS
- 2020-09-05 Listed $260,000 WNYREIS
- 2018-08-31 Sold (MLS) $96,000 WNYREIS
- 2018-07-31 Pending — WNYREIS
- 2018-07-20 Pending — WNYREIS
- 2018-05-24 Price Changed $134,900 WNYREIS
- 2018-04-26 Listed $149,900 WNYREIS
- 2017-09-26 Listing Removed — WNYREIS
- 2017-09-12 Listed $184,900 WNYREIS
Property tax history
+4.4%/yrLatest (2025): $6,349 · +1.9% YoY. Source: county tax records.
Cash-flow waterfall
monthlySold comps — $/sqft
last 12 mo · ≤1 miLoading sold comps…