5400 34th St W Unit 16B · South Bradenton, FL
Flood risk 1/10 · Minimal
- FEMA flood zone
- X (unshaded)
- Chance of flooding over 30 yrs
- 0.0%
- Est. flood insurance / yr
- $507 – $1,088
Fire risk 2/10 · Minimal
- Est. fire insurance / yr
- $947 – $1,759
Heat risk 10/10 · Severe
- Hot days now (above 107°F)
- 7 days/yr
- Hot days in 30 yrs
- 31 days/yr
Wind risk 10/10 · Severe
- Chance of severe wind over 30 yrs
- 99.0%
Air-quality risk 2/10 · Minimal
- Unhealthy air days now
- 1 days/yr
- Unhealthy air days in 30 yrs
- 2 days/yr
Risk factors via First Street. Map © Google.
Why this score? — see what drove the C+ grade
The composite is a weighted blend of 9 inputs, each scored 0–100. Each bar is that input's sub-score; the figure is the points it added to the 100-point composite (weight × sub-score).
- Cash flow +25.7/30.0
- 1% rule +10.0/10.0
- DSCR +8.5/10.0
- ARV discount +7.5/15.0
- Schools +4.4/10.0
- Livability +3.9/5.0
- Condition / age +2.5/5.0
- Rent growth +1.0/5.0
- Appreciation +0.0/10.0
$185,000
🖨 Deal sheet 📄 Offer letter ✓ Due diligence
Listing remarks MLS
First floor unit in Phase 3. Large 2 bedroom 2 Bath
Key facts
- Large lanai
- Large kitchen
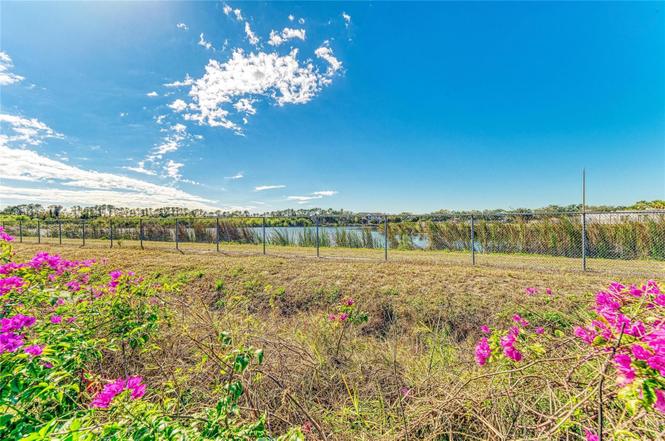
- View over a pond
Tags
Property features AI
Finance
- Financial info: Lease restrictions apply; Total annual association fees $6,984
- HOA & community: Monthly condo fee of $582 (includes cable TV, internet, building and grounds maintenance, management, pool and recreational facilities); Association: C&S Management; Community clubhouse and pool; No truck/RV/motorcycle parking; Senior community; Pets not allowed
Exterior
- Utilities: Public water; Public sewer; Cable connected; Electricity connected; Sewer connected; Water connected
- Home design: Residential condominium; One level; Faces west
- Construction: Block construction; Shingle roof; Slab foundation; Built as part of a multi-unit building (building number 16)
- Exterior features: Rain gutters; Sidewalk; Landscaped lot; Level lot; Asphalt road access; Pond view
Interior
- Kitchen: Cooktop; Range; Refrigerator; Electric water heater
- Bedrooms: 2 bedrooms
- Flooring: Carpet; Laminate; Tile
- Bathrooms: 2 full bathrooms
- Heating & cooling: Electric heating; Central air conditioning
- Interior features: Living room/dining room combo; 6 total rooms
- Laundry & utility: Laundry room
Neighborhood map
What this means for you Summary
Snapshot
- This is a 2-bed/2.0-bath condo listed at $185k.
Deal economics
- At list price, monthly cash flow is $441 ($5k/yr) — positive.
- The deal already cash-flows at list — no discount required.
- Meets the 1% rule at list price ($3k rent vs $185k).
- Recommended offer: $163k (12.0% below list) — sets the bar for market timing.
- Cap rate 9.2% vs local median 4.1% in South Bradenton — top-decile yield for the area; either an underpriced asset or a hidden risk that comps aren't pricing in. Stress-test before assuming the spread holds.
Location & tenants
- Location reads 77/100 on livability (#195 in FL, #3,092 nationally) — a middle-class / working-renter tenant base. Strengths: cost of living A+, housing A+, health & safety A+; Watch: amenities C-, crime D+, commute F.
- Manatee (suburban): math 54% / reading 50% proficiency, ranked #26 of 73 in FL (top 36%) — acceptable for families but not a draw, mixed tenant base, ~2y average lease.
- Market conditions: Rents falling (-6.1%/yr); 549 active listings in the ZIP; 40 comparable units currently listed for rent nearby; rentals at typical pace (median 16d on market — plan ~3-4 weeks tenant-placement turnaround); 7,472 units permitted in Manatee County in 2024 (1,782 in 5+ unit buildings).
- At $2,913/mo this rent would consume 54% of the median local household income ($64k/yr) (locally 895% of renters already pay >50% of income on rent) — very limited rent-growth headroom before tenants either downsize or default.
Forward outlook
- Local home prices are declining (-3.0%/yr); year-one equity from $1k of loan paydown is wiped out by about $6k of value loss. Plan a longer hold.
- Manatee County population projected at +43% by 2050 — long-run rental-demand tailwind backs the buy-and-hold thesis.
Negotiation context
- It's been on market 138 days — a 12% lower offer ($163k) is reasonable based on typical stale-listing flexibility.
- 2 sale attempts since 12y ago with the ask held roughly flat each time — persistent listings suggest the price (not the market) is what's stuck; bring a comps-based counter.
- Current owner paid $81k; list at $185k implies a 128% gain — meaningful room to come down on a strong offer.
Risks & watch-outs
- Climate carrying-cost: severe wind risk, 99% chance of damaging wind over 30y; extreme-heat days projected 7→31/yr by 2055 (HVAC capex compounding) — expect insurance premiums to compound above CPI over the hold.
Questions for the listing agent
- It's been on market 138 days. Have you received any prior offers? Is the seller open to a 12% concession, seller financing, or rate buy-down credit?
- Built in 1979 — when were the roof, HVAC, electrical panel, plumbing, and water heater last replaced?
- What does the HOA fee cover, when was the last increase, and are there any pending special assessments or reserve-fund shortfalls?
- Any open or pending special assessments — roof, HVAC, plumbing, elevator, façade? What's the per-unit balance and payoff schedule, and is the seller paying it off at close or rolling it to the buyer?
- Why hasn't it sold? Are there any deal-killer items the seller is aware of (foundation, flood, title, zoning, code violations)?
- Is there a deadline driving the sale (1031 exchange, divorce, estate, relocation)? That informs how much negotiation room exists.
- Schools are B-rated — typically a magnet for longer-tenancy family renters. What's the average tenant stay here, and is there a school-zone premium baked into asking?
- Crime grade is D in this area — have there been break-ins, vandalism, or insurance claims at this property in the last 3 years? What carrier currently insures it and at what premium?
- What's the average days-on-market for RENTAL listings here right now (not sales)? A rising rental-DOM trend means longer vacancies and softer asking-rent achievability than the comps imply.
- What's the recent tenant-quality profile in this submarket — average credit score on applications, eviction rate, late-payment / NSF rate, and stable-employment percentage? A property-management company in the area should have these aggregated.
- How much new apartment / multifamily construction is in the pipeline within 1–3 miles? Heavy new supply (>2% of stock underway) typically softens rents 12–24 months out; light construction supports rent growth.
Investment metrics
- 1% rule
- 1.57% ✓
- Cap rate
- 9.15%
- Cash-on-cash
- 10.22%
- DSCR
- 1.45
- GRM
- 5.3
CMA / ARV
No comps found within radius.
Projected returns pro-forma
-3.0% appreciation · 0.0% rent growth · sell at horizon
- IRR
- -5.4%
- Equity multiple
- 0.81×
- Total profit
- $-10,026
- Equity at exit
- $27,584
- IRR
- -1.4%
- Equity multiple
- 0.92×
- Total profit
- $-3,925
- Equity at exit
- $15,995
Cash invested: $51,800 (down + closing). Projections, not guarantees.
Landlord ↔ Tenant lean methodology
- Overall (STATE)
- 87 Strongly Landlord-Friendly
- State Florida
- 87 Strongly Landlord-Friendly · R+3
- County
- — inherits STATE
- City
- — inherits STATE
ZIP-level market 34210
- Rents YoY
- -6.1%
- Active inventory
- 549
- Price-to-rent
- 5.3×
Monthly cashflow live
- Estimated rent
- $2,913 high interval (Pro) →
- Mortgage (P&I)
- −$970
- Tax est. 1.5%
- −$231 /mo · $2,775/yr
- Insurance
- −$77
- HOA
- −$582
- Vacancy / Maint / Mgmt
- −$612
- Net cashflow
- $441
Break-even live
UW: 25.0% down · 7.5% · 30yr · 1.5% tax · 5.0% vac · 8.0% maint · 8.0% mgmt
Financing live
Cash to close
- Down payment
- $46,250
- Closing costs
- $5,550
- Reserves months
- —
- Total cash needed
- —
Loan-product check · same deal, 3 products live
Conventional
25% down · 7.5% · 30yr
- Down + closing
- —
- Monthly P&I
- —
- Monthly cashflow
- —
- DSCR
- —
- Eligible?
- —
Personal DTI + credit; lowest rate.
DSCR
20% down · 8.5% · 30yr
- Down + closing
- —
- Monthly P&I
- —
- Monthly cashflow
- —
- DSCR
- —
- Eligible?
- —
No personal income docs; deal must DSCR.
Hard money
10% down · 12.0% · 12mo
- Down + closing
- —
- Monthly P&I
- —
- Monthly cashflow
- —
- DSCR
- —
- Eligible?
- —
Short-term bridge; refi at stabilization.
Rent comps 40 comps
| Address | Beds | Baths | Sqft | Rent | $/sqft | DOM | Units | Dist |
|---|---|---|---|---|---|---|---|---|
| 3605 54th Dr W Bradenton, FL | 2.0 | 2.0 | 1166 | $3,738 | $3.21 | 3d | 2 | 0.06mi |
| 3701 54th Dr W Bradenton, FL | 2.0 | 2.0 | 1215 | $3,500 | $2.88 | 3d | 2 | 0.06mi |
| 3705 54th Dr W #201 Bradenton, FL | 3.0 | 3.0 | 1650 | $5,500 | $3.33 | 16d | 1 | 0.07mi |
| 3705 54th Dr W #103 Bradenton, FL | 3.0 | 3.0 | 1650 | $4,700 | $2.85 | 16d | 1 | 0.07mi |
| 3604 54th Dr W Bradenton, FL | 2.0 | 2.0 | 1114 | $4,050 | $3.64 | 3d | 3 | 0.08mi |
| 3803 54th Dr W Bradenton, FL | 2.0 | 2.0 | 1215 | $3,600 | $2.96 | 1d | 1 | 0.09mi |
| 3702 54th Dr W Bradenton, FL | 2.0–3.0 | 2.0–3.0 | 1327 | $3,300 | $2.49 | 3d | 2 | 0.10mi |
| 3510 54th Dr W #101 Bradenton, FL | 3.0 | 3.0 | 1795 | $5,000 | $2.79 | 3d | 1 | 0.11mi |
| 3510 54th Dr W #103 Bradenton, FL | 3.0 | 3.0 | 1795 | $5,500 | $3.06 | 3d | 1 | 0.11mi |
| 3506 54th Dr W Bradenton, FL | 1.0–2.0 | 1.0–2.0 | 953 | $2,800 | $2.94 | 3d | 2 | 0.14mi |
| 5400 34th St W Bradenton, FL | 2.0 | 2.0 | 1404 | $2,500 | $1.78 | 23d | 3 | 0.17mi |
| 5400 34th St W Bradenton, FL | 2.0 | 2.0 | 1244 | $2,675 | $2.15 | 2d | 2 | 0.17mi |
| 3401 54th Dr W Bradenton, FL | 2.0–3.0 | 2.0–3.0 | 1293 | $3,300 | $2.55 | 3d | 3 | 0.18mi |
| 3605 57th Avenue Dr W Bradenton, FL | 2.0 | 2.0 | 1454 | $2,100 | $1.44 | 3d | 1 | 0.26mi |
| 4148 53rd Ave W Unit 0314 Bradenton, FL | 2.0 | 2.0 | 1071 | $1,967 | $1.84 | 23d | 1 | 0.31mi |
| 4148 53rd Ave W Bradenton, FL | 1.0–2.0 | 1.0–2.0 | 899 | $2,412 | $2.68 | 21d | 10 | 0.31mi |
| 4148 53rd Ave W Unit 1210 Bradenton, FL | 2.0 | 2.0 | 1071 | $1,932 | $1.80 | 3d | 1 | 0.31mi |
| 4148 53rd Ave W Bradenton, FL | 1.0–3.0 | 1.0–2.0 | 989 | $2,550 | $2.58 | 1d | 1 | 0.31mi |
| 3411 57th Avenue Dr W Bradenton, FL | 3.0 | 2.0 | 1326 | $2,100 | $1.58 | 23d | 1 | 0.33mi |
| 5125 39th St W Unit 1545695P Bradenton, FL | 3.0 | 2.0 | 1593 | $4,526 | $2.84 | 14d | 1 | 0.35mi |
| 3774 59th Ave W Unit 3774 Bradenton, FL | 2.0 | 2.0 | 912 | $1,350 | $1.48 | 23d | 1 | 0.41mi |
| 3848 59th Ave W Bradenton, FL | 2.0 | 2.0 | 912 | $1,395 | $1.53 | 23d | 1 | 0.43mi |
| 3424 51st Avenue Cir W Bradenton, FL | 2.0 | 2.0 | 1538 | $2,100 | $1.37 | 3d | 1 | 0.43mi |
| 3775 59th Ave W Unit 3775 Bradenton, FL | 2.0 | 2.0 | 912 | $3,500 | $3.84 | 23d | 1 | 0.43mi |
| 3773 59th Ave W Bradenton, FL | 2.0 | 2.0 | 912 | $1,595 | $1.75 | 23d | 1 | 0.44mi |
| 3441 51st Avenue Cir W Unit 213 Bradenton, FL | 3.0 | 2.0 | 1823 | $3,900 | $2.14 | 23d | 1 | 0.44mi |
| 3739 59th Ave W Unit 3739 Bradenton, FL | 2.0 | 2.0 | 912 | $1,575 | $1.73 | 16d | 1 | 0.45mi |
| 3646 59th Ave W Unit 3646 Bradenton, FL | 2.0 | 2.0 | 912 | $1,400 | $1.54 | 3d | 1 | 0.45mi |
| 3843 59th Ave W Bradenton, FL | 2.0 | 2.0 | 912 | $1,200 | $1.32 | 23d | 1 | 0.45mi |
| 3851 59th Ave W Unit 3851 Bradenton, FL | 2.0 | 2.0 | 912 | $1,500 | $1.64 | 23d | 1 | 0.46mi |
| 3545 59th Ave W #3545 Bradenton, FL | 3.0 | 2.0 | 1037 | $1,600 | $1.54 | 16d | 1 | 0.47mi |
| 3527 59th Ave W Unit 3527 Bradenton, FL | 2.0 | 2.0 | 912 | $1,400 | $1.54 | 23d | 1 | 0.47mi |
| 3533 59th Ave W Unit 3533 Bradenton, FL | 2.0 | 2.0 | 912 | $1,500 | $1.64 | 16d | 1 | 0.48mi |
| 3277 51st Avenue Dr W Bradenton, FL | 3.0 | 2.0 | 995 | $1,760 | $1.77 | 3d | 1 | 0.49mi |
| 3427 59th Ave W Bradenton, FL | 2.0 | 2.5 | 1330 | $2,150 | $1.62 | 16d | 1 | 0.49mi |
| 184 Pineneedle Dr Bradenton, FL | 2.0 | 2.0 | 940 | $2,100 | $2.23 | 23d | 1 | 0.51mi |
| 183 Pineneedle Dr Bradenton, FL | 2.0 | 2.0 | 1304 | $1,800 | $1.38 | 23d | 1 | 0.51mi |
| 142 Pineneedle Dr Unit 142U Bradenton, FL | 2.0 | 2.0 | 1408 | $2,395 | $1.70 | 23d | 1 | 0.51mi |
| 146 Wild Palm Dr #146 Bradenton, FL | 2.0 | 2.0 | 1500 | $2,500 | $1.67 | 23d | 1 | 0.52mi |
| 133 Wild Palm Dr #133 Bradenton, FL | 2.0 | 2.0 | 1408 | $2,350 | $1.67 | 23d | 1 | 0.52mi |
HOA detail condo
- Monthly dues
- $582 · $6,984/yr
- Assessments
- None detected in remarks — confirm with the listing agent.
Listing history 21 events
-
2026-06-18days on market $185,000 Active 138 DOM
-
2026-06-17days on market $185,000 Active 137 DOM
-
2026-06-16days on market $185,000 Active 136 DOM
-
2026-06-15days on market $185,000 Active 135 DOM
-
2026-06-13days on market $185,000 Active 133 DOM
-
2026-06-13days on market $185,000 Active 132 DOM
-
2026-06-10days on market $185,000 Active 130 DOM
-
2026-06-09days on market $185,000 Active 129 DOM
-
2026-06-08days on market $185,000 Active 128 DOM
-
2026-06-08days on market $185,000 Active 127 DOM
-
2026-06-03days on market $185,000 Active 123 DOM
-
2026-06-02days on market $185,000 Active 122 DOM
-
2026-06-01days on market $185,000 Active 121 DOM
-
2026-05-31days on market $185,000 Active 120 DOM
-
2026-03-14price $185,000
-
2026-03-14price $169,900
-
2026-03-14price $175,000
-
2026-01-31$185,000 Active
-
2014-12-19soldstatus $81,000 Sold 51-char remark
Show marketing remark (51 chars)
First floor unit in Phase 3. Large 2 bedroom 2 Bath
-
2014-10-11historical 51-char remark
Show marketing remark (51 chars)
First floor unit in Phase 3. Large 2 bedroom 2 Bath
-
2014-10-10$81,000 51-char remark
Show marketing remark (51 chars)
First floor unit in Phase 3. Large 2 bedroom 2 Bath
ⓘ Source: listings_history table (triggers on properties + properties_extension) + one-shot
backfill from property_details.listing_events for pre-trigger history.
Climate risk First Street
- Flood 1/10 Low FEMA zone X (unshaded) · 0% chance over 30 yrs
- Wildfire 2/10 Low
- Heat 10/10 Extreme 7 d/yr ≥107°F today · 31 d/yr by 30 yrs out
- Wind 10/10 Extreme 99% chance of damaging wind over 30 yrs
- Air quality 2/10 Low 1 unhealthy d/yr today · 2 by 30 yrs out
Nearby sold comps map
Loading sold comps map…
Walkable amenities ~0.75 mi
Loading nearby amenities…
Taxation est. · year 1
- Rental income
- $34,960
- − Mortgage interest
- −$10,363
- − Property taxes
- −$2,775
- − Insurance
- −$925
- − Repairs & maintenance
- −$2,797
- − Management
- −$2,797
- − HOA
- −$6,984
- − Depreciation
- −$5,382
- Taxable income
- $2,937
- Est. tax owed @ 24.0%
- −$705
- After-tax cash flow
- $4,587/yr
For passive investors: Depreciation is non-cash, so a rental often shows a tax loss while cash-flowing — sheltering income. Rental losses are passive: they offset passive income freely, and up to $25,000/yr can offset ordinary (W-2) income if you actively participate and your MAGI is under $100k (phasing out to $0 by $150k); unused losses carry forward. On sale, claimed depreciation is recaptured at up to 25%, and gains may owe capital-gains tax (a 1031 exchange can defer both). Figures are a year-1 estimate at your 24.0% rate — not tax advice; consult a CPA.
Schools (NCES district)
- District
- Manatee
- NCES district ID
- 1201230
- Math proficiency
- 54% ▼ -6.00%
- Reading proficiency
- 50% ▼ -2.00%
- Median HH income
- $49,607
- Composite
- 44.43/100
- National rank
- #2806
- State rank
- #26 of 73 in FL
Livability — South Bradenton
- Score
- 77/100
- State rank
- #195
- US rank
- #3092
Category grades
Schools grade is shown separately in the Schools card above.
Census & demographics
- County
- Manatee County · 416,364 people
- Metro
- North Port-Sarasota-Bradenton, FL
- Population (ZIP)
- 17,682
- Household income
- $64,244
- Rent vs Own
- Severe rent burden
- 895.0
Population outlook (Manatee County) Hauer SSP2
- Today (2025)
- 447,342 people
- By 2030
- 488,911 · +9.3%
- By 2040
- 567,934 · +27.0%
- By 2050
- 637,995 · +42.6%
- By 2075
- 781,970 · +74.8%
- By 2100
- 848,272 · +89.6%
Race, ethnicity, and origin ACS 2023
- Neighborhood character
- Predominantly White (68%)
- Race & ethnicity
- White 68% Hispanic / Latino 20% Black 8% Two or more races 7% Asian 2%
- Hispanic origin (detail)
- Mexican 4% Puerto Rican 3% Cuban 7%
- Common ancestry
- Hispanic 4% Romanian 3% Lithuanian 3%
- Foreign-born
- 17% · Canada, China, Jamaica
- Languages at home
- 76% English-only · Spanish 15% French/Haitian/Cajun 4% Other Indo-European 1%
Political lean MEDSL · Manatee
- 2024 margin
- Strong R (+23.5) · D 37.9% · R 61.4%
- 2008→2024 swing
- -16.5pp toward R · 2008: -7.0pp · 2024: -23.5pp
- All cycles
- 2024: R+23.5 2020: R+16.1 2016: R+17.1 2012: R+12.5 2008: R+7.0
Not yet ingested
- Civics
- —
Market trends
- HPI YoY
- ▼ -162.68%
- Current HPI
- 246.9247
- Rent YoY
- ▼ -6.08%
- Metro
- North Port-Sarasota-Bradenton, FL
- State GDP YoY
- ▲ 3.28%
- F500 in state
- 36
Industry mix (Fortune 500 HQ in FL)
| Industry | F500 HQs | Revenue |
|---|---|---|
| Industrial Technology | 2 | $29B |
|
||
| Insurance | 2 | $17B |
|
||
| Retail | 1 | $60B |
|
||
| Technology Distribution | 1 | $58B |
|
||
| Homebuilding | 1 | $35B |
|
||
| Technology Manufacturing | 1 | $35B |
|
||
Price history
+128.4% since first listed7 events — show timeline
- 2026-03-14 Price Changed $185,000 Stellar MLS as Distributed by MLS Grid
- 2026-03-14 Price Changed $169,900 Stellar MLS as Distributed by MLS Grid
- 2026-03-14 Price Changed $175,000 Stellar MLS as Distributed by MLS Grid
- 2026-01-31 Listed $185,000 Stellar MLS as Distributed by MLS Grid
- 2014-12-19 Sold (MLS) $81,000 Stellar MLS as Distributed by MLS Grid
- 2014-10-11 Listing Removed — Stellar MLS as Distributed by MLS Grid
- 2014-10-10 Listed $81,000 Stellar MLS as Distributed by MLS Grid
Cash-flow waterfall
monthlySold comps — $/sqft
last 12 mo · ≤1 miLoading sold comps…