417 N 6th Ave · Butler, PA
Flood risk 1/10 · Minimal
- FEMA flood zone
- X (unshaded)
- Chance of flooding over 30 yrs
- 0.0%
- Est. flood insurance / yr
- $473 – $860
Fire risk 1/10 · Minimal
- Est. fire insurance / yr
- $511 – $949
Heat risk 3/10 · Minor
- Hot days now (above 95°F)
- 7 days/yr
- Hot days in 30 yrs
- 17 days/yr
Wind risk 1/10 · Minimal
- Chance of severe wind over 30 yrs
- 0.0%
Air-quality risk 3/10 · Minor
- Unhealthy air days now
- 2 days/yr
- Unhealthy air days in 30 yrs
- 4 days/yr
Risk factors via First Street. Map © Google.
Why this score? — see what drove the B+ grade
The composite is a weighted blend of 9 inputs, each scored 0–100. Each bar is that input's sub-score; the figure is the points it added to the 100-point composite (weight × sub-score).
- Cash flow +28.2/30.0
- ARV discount +15.0/15.0
- DSCR +10.0/10.0
- 1% rule +7.6/10.0
- Rent growth +5.0/5.0
- Schools +4.3/10.0
- Livability +3.6/5.0
- Condition / age +2.5/5.0
- Appreciation +0.0/10.0
$109,000
🖨 Deal sheet (PDF) 📄 Offer letter ✓ Due diligence
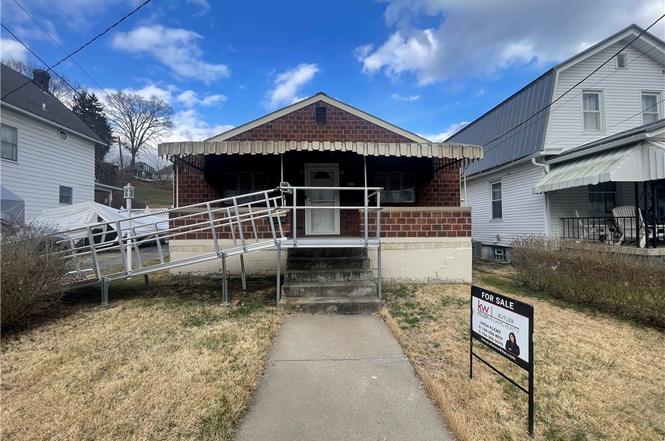
Listing remarks
If you’re needing a handicap accessible home, wanting to downsize, prefer one level living, or just looking for a starter home: this home is the perfect home for you. It offers a large eat in kitchen, a welcoming covered front porch, fenced in back yard, off street parking, as well as a basement that can be finished to add living space. The bathroom has been converted into a handicap shower and some doorways have been widened to accommodate a wheelchair. There is an additional toilet in the basement with newer plumbing. It is also close to public transportation and shopping.
Key facts
- Covered front porch
- Large eat in kitchen
- Off street parking
Tags
Property features AI
Exterior
- Parking: Off-street parking for 2 vehicles
- Utilities: Public water and sewer (standard utilities indicated); Electric service available
- Home design: Single-story; Resale property
- Construction: Brick construction; Asphalt roof
- Exterior features: Public transportation nearby
Interior
- Kitchen: Kitchen on main level (12 x 14)
- Bedrooms: Main level bedroom (13 x 9); Main level bedroom (12 x 8); Main level bedroom (12 x 10)
- Flooring: Carpet; Hardwood; Laminate
- Bathrooms: 1 full bathroom
- Heating & cooling: Gas heating; Central air conditioning
- Interior features: Carpet flooring; Hardwood flooring; Laminate flooring
Neighborhood map
What this means for you Summary
Snapshot
- This is a 3-bed/1.0-bath single-family listed at $109k.
Deal economics
- At list price, monthly cash flow is $347 ($4k/yr) — positive.
- The deal already cash-flows at list — no discount required.
- Meets the 1% rule at list price ($1k rent vs $109k).
- Recommended offer: $99k (9.0% below list) — sets the bar for market timing.
- Cap rate 10.1% vs local median 3.8% in Butler — top-decile yield for the area; either an underpriced asset or a hidden risk that comps aren't pricing in. Stress-test before assuming the spread holds.
Location & tenants
- Location reads 71/100 on livability (#705 in PA) — a middle-class / working-renter tenant base. Strengths: cost of living A+, health & safety A+, schools A-; Watch: crime D-, amenities F, commute F.
- Butler Area SD (town): math 41% / reading 59% proficiency, ranked #181 of 539 in PA (top 34%) — acceptable for families but not a draw, mixed tenant base, ~2y average lease.
- Market conditions: Rents rising fast (+20.4%/yr); 206 active listings in the ZIP; 1 comparable units currently listed for rent nearby; 987 units permitted in Butler County in 2024 (0 in 5+ unit buildings).
Forward outlook
- Local home prices are declining (-3.0%/yr); year-one equity from $754 of loan paydown is wiped out by about $3k of value loss. Plan a longer hold.
- Butler County population projected to shrink 5% by 2050 — rents likely to lag national; underwrite the cash flow, not the appreciation.
- At projected returns (-3.0% appreciation + 8.0% rent growth), your $31k cash investment doubles in ~7 years — after that, you're playing with house money.
Negotiation context
- It's been on market 101 days — a 9% lower offer ($99k) is reasonable based on typical stale-listing flexibility.
Risks & watch-outs
- Watch-outs: built in 1912 — expect roof / HVAC / electrical / plumbing capex.
Questions for the listing agent
- It's been on market 101 days. Have you received any prior offers? Is the seller open to a 9% concession, seller financing, or rate buy-down credit?
- Built in 1912 — when were the roof, HVAC, electrical panel, plumbing, and water heater last replaced?
- Why hasn't it sold? Are there any deal-killer items the seller is aware of (foundation, flood, title, zoning, code violations)?
- Is there a deadline driving the sale (1031 exchange, divorce, estate, relocation)? That informs how much negotiation room exists.
- Schools are A-rated — typically a magnet for longer-tenancy family renters. What's the average tenant stay here, and is there a school-zone premium baked into asking?
- Crime grade is D in this area — have there been break-ins, vandalism, or insurance claims at this property in the last 3 years? What carrier currently insures it and at what premium?
- What's the average days-on-market for RENTAL listings here right now (not sales)? A rising rental-DOM trend means longer vacancies and softer asking-rent achievability than the comps imply.
- What's the recent tenant-quality profile in this submarket — average credit score on applications, eviction rate, late-payment / NSF rate, and stable-employment percentage? A property-management company in the area should have these aggregated.
- How much new for-sale + rental construction is in the pipeline within 1–3 miles? Heavy new supply typically softens prices + rents 12–24 months out; constrained supply supports both.
Investment metrics
- 1% rule
- 1.26% ✓
- Cap rate
- 10.11%
- Cash-on-cash
- 13.64%
- DSCR
- 1.61
- GRM
- 6.6
CMA / ARV
- ARV (on-the-fly)
- $161,616
- Comps found
- 6
Show comp detail 6 sales within ~0.75 mi
| Address | Dist | Beds/Ba | Sqft | Sold | Price | $/sf | Match |
|---|---|---|---|---|---|---|---|
| 406 Mercer St | 0.04mi | 3/1.5 | 2,496 (+14%) | 15mo | $185,000 | $74 | 60 |
| 222 5th Ave | 0.42mi | 4/1.0 (+1) | 2,039 (-7%) | 6mo | $38,600 | $19 | 59 |
| 445 Miller Ave | 0.17mi | 3/2.0 | 1,872 (-14%) | 7mo | $174,000 | $93 | 58 |
| 321 W Fulton St | 0.50mi | 3/1.0 | 2,392 (+10%) | 14mo | $110,000 | $46 | 49 |
| 224 W Pearl St | 0.62mi | 3/2.5 | 1,872 (-14%) | 1mo | $225,000 | $120 | 40 |
| 424 W Cunningham St | 0.64mi | 4/1.0 (+1) | 1,980 (-9%) | 19mo | $78,000 | $39 | 34 |
Match score weights: distance 35% · size 25% · config 20% · recency 20%. Top-matched comps best support the ARV.
Projected returns pro-forma
-3.0% appreciation · 8.0% rent growth · sell at horizon
- IRR
- 9.2%
- Equity multiple
- 1.38×
- Total profit
- $11,706
- Equity at exit
- $16,252
- IRR
- 22.2%
- Equity multiple
- 3.35×
- Total profit
- $71,741
- Equity at exit
- $9,424
Cash invested: $30,520 (down + closing). Projections, not guarantees.
Landlord ↔ Tenant lean methodology
- Overall (STATE)
- 62 Landlord-Friendly
- State Pennsylvania
- 62 Landlord-Friendly · EVEN
- County
- — inherits STATE
- City
- — inherits STATE
ZIP-level market 16001
- Home prices YoY
- -31.7%
- Rents YoY
- 20.4%
- Active inventory
- 206
- Price-to-rent
- 6.6×
Monthly cashflow live
- Estimated rent
- $1,374 medium interval (Pro) →
- Mortgage (P&I)
- −$572
- Tax from tax record
- −$121 /mo · $1,457/yr
- Insurance
- −$45
- HOA
- −$0
- Vacancy / Maint / Mgmt
- −$289
- Net cashflow
- $347
Break-even live
Sensitivity live
| Price | -10% $409 | -5% $378 | +0% $347 | +5% $316 | +10% $285 |
|---|---|---|---|---|---|
| Rent | -10% $238 | -5% $293 | +0% $347 | +5% $401 | +10% $455 |
| Rate | -1.0pp $402 | -0.5pp $375 | base $347 | +0.5pp $319 | +1.0pp $290 |
UW: 25.0% down · 7.5% · 30yr · 1.5% tax · 5.0% vac · 8.0% maint · 8.0% mgmt
Financing live
Cash to close
- Down payment
- $27,250
- Closing costs
- $3,270
- Reserves months
- —
- Total cash needed
- —
Loan-product check · same deal, 3 products live
Conventional
25% down · 7.5% · 30yr
- Down + closing
- —
- Monthly P&I
- —
- Monthly cashflow
- —
- DSCR
- —
- Eligible?
- —
Personal DTI + credit; lowest rate.
DSCR
20% down · 8.5% · 30yr
- Down + closing
- —
- Monthly P&I
- —
- Monthly cashflow
- —
- DSCR
- —
- Eligible?
- —
No personal income docs; deal must DSCR.
Hard money
10% down · 12.0% · 12mo
- Down + closing
- —
- Monthly P&I
- —
- Monthly cashflow
- —
- DSCR
- —
- Eligible?
- —
Short-term bridge; refi at stabilization.
Rent comps 1 comps
| Address | Beds | Baths | Sqft | Rent | $/sqft | DOM | Units | Dist |
|---|---|---|---|---|---|---|---|---|
| 414 S Washington St Butler, PA | 3.0 | 1.0 | 3000 | $1,672 | $0.56 | 13d | 1 | 0.98mi |
Listing history 12 events
-
2026-06-13statusdays on market $109,000 Pending 101 DOM
-
2026-06-09days on market $109,000 Contingent 98 DOM
-
2026-06-08days on market $109,000 Contingent 97 DOM
-
2026-06-07days on market $109,000 Contingent 96 DOM
-
2026-06-03days on market $109,000 Contingent 92 DOM
-
2026-06-02days on market $109,000 Contingent 91 DOM
-
2026-06-01days on market $109,000 Contingent 90 DOM
-
2026-05-31days on market $109,000 Contingent 89 DOM
-
2026-04-26historical Contingent
-
2026-04-06price $109,000
-
2026-03-16price $119,000
-
2026-03-03$126,000 Active
ⓘ Source: listings_history table (triggers on properties + properties_extension) + one-shot
backfill from property_details.listing_events for pre-trigger history.
Tax reassessment forecast PA · Partial reset (capped growth)
- Current annual tax
- $1,457 · $121/mo
- Projected year-2 tax
- $1,590 · $132/mo
- Expected delta
- +$132/yr (+$11/mo · 9.1%)
ⓘ Screening estimate from a state-policy table — verify with the county assessor before closing.
Climate risk First Street
- Flood 1/10 Low FEMA zone X (unshaded) · 0% chance over 30 yrs
- Wildfire 1/10 Low
- Heat 3/10 Moderate 7 d/yr ≥95°F today · 17 d/yr by 30 yrs out
- Wind 1/10 Low 0% chance of damaging wind over 30 yrs
- Air quality 3/10 Moderate 2 unhealthy d/yr today · 4 by 30 yrs out
Nearby sold comps map
Loading sold comps map…
Walkable amenities ~0.75 mi
Loading nearby amenities…
Taxation est. · year 1
- Rental income
- $16,487
- − Mortgage interest
- −$6,106
- − Property taxes
- −$1,457
- − Insurance
- −$545
- − Repairs & maintenance
- −$1,319
- − Management
- −$1,319
- − Depreciation
- −$3,171
- Taxable income
- $2,570
- Est. tax owed @ 24.0%
- −$617
- After-tax cash flow
- $3,546/yr
For passive investors: Depreciation is non-cash, so a rental often shows a tax loss while cash-flowing — sheltering income. Rental losses are passive: they offset passive income freely, and up to $25,000/yr can offset ordinary (W-2) income if you actively participate and your MAGI is under $100k (phasing out to $0 by $150k); unused losses carry forward. On sale, claimed depreciation is recaptured at up to 25%, and gains may owe capital-gains tax (a 1031 exchange can defer both). Figures are a year-1 estimate at your 24.0% rate — not tax advice; consult a CPA.
Schools (NCES district)
- District
- Butler Area SD
- NCES district ID
- 4204590
- Math proficiency
- 41% ▼ -11.00%
- Reading proficiency
- 59% ▼ -10.00%
- Median HH income
- $49,348
- Composite
- 42.65/100
- National rank
- #3180
- State rank
- #181 of 539 in PA
Livability — Butler
- Score
- 71/100
- State rank
- #705
- US rank
- #6951
Category grades
Schools grade is shown separately in the Schools card above.
Census & demographics
- Census place
- Butler, PA
- County
- Butler County · 73,107 people
- City population
- 39,234
- Metro
- Pittsburgh, PA
- Population (ZIP)
- 39,234
- Household income
- $63,635
- Rent vs Own
- Severe rent burden
- 1441.0
Population outlook (Butler County) Hauer SSP2
- Today (2025)
- 190,777 people
- By 2030
- 191,476 · +0.4%
- By 2040
- 189,474 · -0.7%
- By 2050
- 182,050 · -4.6%
- By 2075
- 159,526 · -16.4%
- By 2100
- 129,028 · -32.4%
Race, ethnicity, and origin ACS 2023
- Neighborhood character
- Predominantly White (92%)
- Race & ethnicity
- White 92% Two or more races 4% Hispanic / Latino 2% Black 1%
- Common ancestry
- Romanian 8% Serbian 4% Slovak 2%
- Foreign-born
- 1% · Canada
- Languages at home
- 98% English-only · Spanish 1%
Political lean MEDSL · Butler
- 2024 margin
- Solid R (+32.2) · D 33.5% · R 65.7%
- 2008→2024 swing
- -4.8pp toward R · 2008: -27.4pp · 2024: -32.2pp
- All cycles
- 2024: R+32.2 2020: R+32.5 2016: R+37.5 2012: R+34.9 2008: R+27.4
Not yet ingested
- Civics
- —
Market trends
- HPI YoY
- ▼ -103.40%
- Current HPI
- 222.4445
- Rent YoY
- ▲ 20.36%
- Metro
- Pittsburgh, PA
- State GDP YoY
- ▲ 1.68%
- F500 in state
- 34
Industry mix (Fortune 500 HQ in PA)
| Industry | F500 HQs | Revenue |
|---|---|---|
| Healthcare | 2 | $309B |
|
||
| Insurance | 2 | $27B |
|
||
| Telecommunications / Media | 1 | $124B |
|
||
| Industrial Distribution | 1 | $22B |
|
||
| Financial Services | 1 | $20B |
|
||
| Chemicals / Materials | 1 | $18B |
|
||
Price history
-13.5% since first listed4 events — show timeline
- 2026-04-26 Contingent — West Penn MLS
- 2026-04-06 Price Changed $109,000 West Penn MLS
- 2026-03-16 Price Changed $119,000 West Penn MLS
- 2026-03-03 Listed $126,000 West Penn MLS
Property tax history
+0.8%/yrLatest (2026): $1,457 · -6.3% YoY. Source: county tax records.
Cash-flow waterfall
monthlySold comps — $/sqft
last 12 mo · ≤1 miLoading sold comps…