 🏷️ Likely Rental
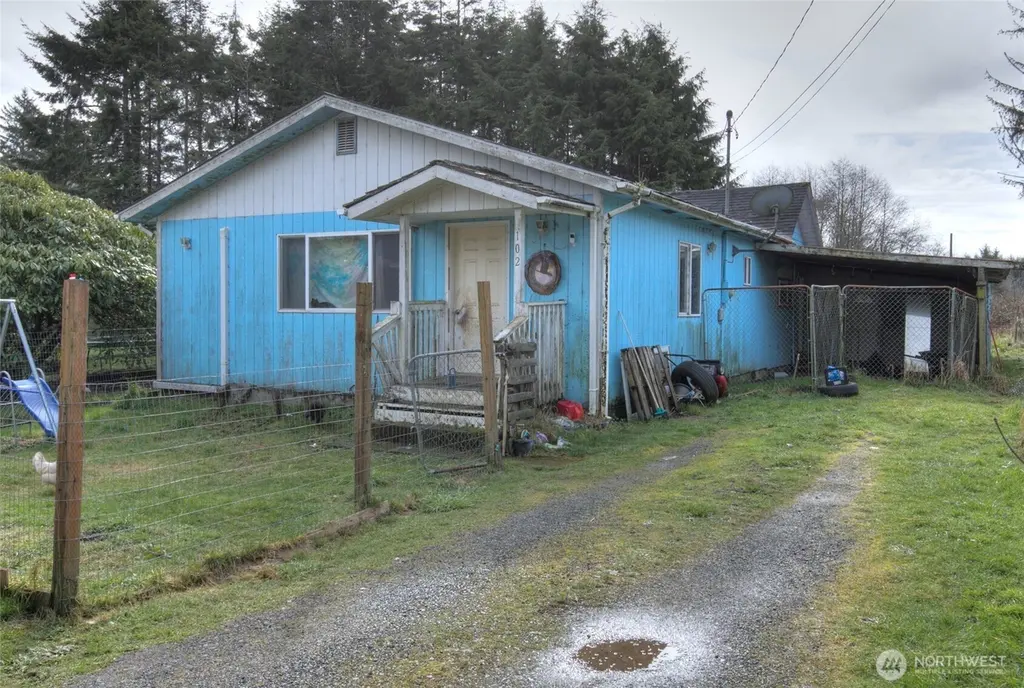
102 Elma St · Copalis Beach, WA
Flood risk 1/10 · Minimal
- FEMA flood zone
- X (unshaded)
- Chance of flooding over 30 yrs
- 0.0%
- Est. flood insurance / yr
- $507 – $1,088
Fire risk 1/10 · Minimal
- Est. fire insurance / yr
- $604 – $1,122
Heat risk 1/10 · Minimal
- Hot days now (above 73°F)
- 7 days/yr
- Hot days in 30 yrs
- 14 days/yr
Wind risk 1/10 · Minimal
- Chance of severe wind over 30 yrs
- —
Air-quality risk 5/10 · Moderate
- Unhealthy air days now
- 6 days/yr
- Unhealthy air days in 30 yrs
- 6 days/yr
Risk factors via First Street. Map © Google.
Why this score? — see what drove the D grade
The composite is a weighted blend of 9 inputs, each scored 0–100. Each bar is that input's sub-score; the figure is the points it added to the 100-point composite (weight × sub-score).
- ARV discount +15.0/15.0
- Appreciation +7.5/10.0
- Cash flow +6.4/30.0
- Schools +3.4/10.0
- Rent growth +2.5/5.0
- Livability +2.5/5.0
- Condition / age +2.5/5.0
- 1% rule +0.7/10.0
- DSCR +0.7/10.0
$225,000
🖨 Deal sheet (PDF) 📄 Offer letter ✓ Due diligence
Listing remarks
Looking for affordable housing or a good investment property? Look no further! This two-bedroom, one bathroom home is in a great location just minutes from a beach access, the Copalis River, and an ocean front state park! With such a fantastic location, the benefits of fishing, clam digging, or traveling to the rain forest are all easily accessible for your enjoyment. Sitting on a large, half acre lot with a big yard, this home needs a little TLC. Whether you want to live here, clean it up a bit and flip it, or use it as a rental, it is ideal for any of those situations. Currently in use as a rental, the tenant is month-to-month and would be willing to stay if you so desired! With so ma
Key facts
- Copalis river
- Beach access
- Large half acre lot
Tags
Neighborhood map
What this means for you Summary
Snapshot
- This is a 2-bed/1.0-bath single-family listed at $225k.
Deal economics
- At list price, monthly cash flow is $-393 ($-5k/yr) — negative.
- To cash-flow at today's rent, offer at most $156k (30.8% below list).
- To meet the 1% rule (rent ≥ 1% of price), the offer needs to be $129k (42.7% below list).
- Recommended offer: $129k (42.7% below list) — sets the bar for 1% rule.
Location & tenants
- Location reads 49/100 on livability (#581 in WA) — a working-class tenant base; expect higher turnover. Strengths: cost of living A+, crime A; Watch: health & safety C-, amenities F, commute F.
- North Beach School District (rural): math 32% / reading 44% proficiency, ranked #236 of 291 in WA (top 81%) — families likely to look elsewhere, expect single-tenant / working-renter base with shorter leases; 63% free/reduced lunch — lower-income household profile, screen leases tightly.
- Zoned schools: Pacific Beach Elementary School (110 students, 84% FRL); North Beach Junior High School (162 students, 78% FRL); North Beach Senior High School (177 students, 63% FRL).
- Market conditions: 27 active listings in the ZIP; 297 units permitted in Grays Harbor County in 2024 (17 in 5+ unit buildings).
Forward outlook
- In year one you build about $13k of equity ($2k loan paydown + $11k appreciation (5.1% local appreciation)).
- Grays Harbor County population projected at -24% by 2050 — secular population decline; favor cash flow + early exit over multi-decade hold.
- By year 3, paydown + projected appreciation supports a ~$32k cash-out refi (75% LTV) — recoverable capital for the next deal without selling this one.
Negotiation context
- It's been on market 105 days — a 9% lower offer ($205k) is reasonable based on typical stale-listing flexibility.
Risks & watch-outs
- Watch-outs: built in 1937 — expect roof / HVAC / electrical / plumbing capex.
Questions for the listing agent
- What do current leases actually rent for vs. the listed asking? Can we see a recent rent roll and the last 12 months of T-12 income?
- It's been on market 105 days. Have you received any prior offers? Is the seller open to a 43% concession, seller financing, or rate buy-down credit?
- Built in 1937 — when were the roof, HVAC, electrical panel, plumbing, and water heater last replaced?
- Why hasn't it sold? Are there any deal-killer items the seller is aware of (foundation, flood, title, zoning, code violations)?
- Is there a deadline driving the sale (1031 exchange, divorce, estate, relocation)? That informs how much negotiation room exists.
- Schools are F-rated, which usually means shorter tenancies and higher turnover. Who's the typical renter profile here, and what's been the actual vacancy rate?
- The area grade is low — what's the realistic commute time and amenity access for the typical tenant pool here? Any planned neighborhood developments (good or bad) we should know about?
- What's the average days-on-market for RENTAL listings here right now (not sales)? A rising rental-DOM trend means longer vacancies and softer asking-rent achievability than the comps imply.
- What's the recent tenant-quality profile in this submarket — average credit score on applications, eviction rate, late-payment / NSF rate, and stable-employment percentage? A property-management company in the area should have these aggregated.
- How much new for-sale + rental construction is in the pipeline within 1–3 miles? Heavy new supply typically softens prices + rents 12–24 months out; constrained supply supports both.
Investment metrics
- 1% rule
- 0.57% ✗
- Cap rate
- 4.20%
- Cash-on-cash
- -7.48%
- DSCR
- 0.67
- GRM
- 14.5
CMA / ARV
- ARV (median comp)
- $309,608
- List price
- $225,000
- Delta
- -27.33%
- Verdict
- UNDERPRICED
- Comps
- 13 within 1.0 mi
Show comp detail 3 sales within ~0.75 mi
| Address | Dist | Beds/Ba | Sqft | Sold | Price | $/sf | Match |
|---|---|---|---|---|---|---|---|
| 40 Elma St | 0.21mi | 2/1.0 | 1,312 (-2%) | 14mo | $275,000 | $210 | 74 |
| 11 Benner Rd | 0.43mi | 3/2.0 (+1) | 1,352 (+1%) | 19mo | $382,000 | $283 | 54 |
| 7 Griffard St | 0.48mi | 3/2.0 (+1) | 1,392 (+4%) | 20mo | $366,000 | $263 | 45 |
Match score weights: distance 35% · size 25% · config 20% · recency 20%. Top-matched comps best support the ARV.
Projected returns pro-forma
5.07% appreciation · 3.0% rent growth · sell at horizon
- IRR
- 6.8%
- Equity multiple
- 1.44×
- Total profit
- $27,727
- Equity at exit
- $128,503
- IRR
- 8.9%
- Equity multiple
- 2.67×
- Total profit
- $104,912
- Equity at exit
- $222,608
Cash invested: $63,000 (down + closing). Projections, not guarantees.
Landlord ↔ Tenant lean methodology
- Overall (STATE)
- 28 Tenant-Leaning
- State Washington
- 28 Tenant-Leaning · D+8
- County
- — inherits STATE
- City
- — inherits STATE
ZIP-level market 98535
- Home prices YoY
- 2.9%
- Active inventory
- 27
- Price-to-rent
- 14.5×
Monthly cashflow live
- Estimated rent
- $1,290 medium interval (Pro) →
- Mortgage (P&I)
- −$1,180
- Tax from tax record
- −$138 /mo · $1,655/yr
- Insurance
- −$94
- HOA
- −$0
- Vacancy / Maint / Mgmt
- −$271
- Net cashflow
- $-393
Break-even live
Sensitivity live
| Price | -10% $-265 | -5% $-329 | +0% $-393 | +5% $-456 | +10% $-520 |
|---|---|---|---|---|---|
| Rent | -10% $-494 | -5% $-444 | +0% $-393 | +5% $-342 | +10% $-291 |
| Rate | -1.0pp $-279 | -0.5pp $-335 | base $-393 | +0.5pp $-451 | +1.0pp $-510 |
UW: 25.0% down · 7.5% · 30yr · 1.5% tax · 5.0% vac · 8.0% maint · 8.0% mgmt
Financing live
Cash to close
- Down payment
- $56,250
- Closing costs
- $6,750
- Reserves months
- —
- Total cash needed
- —
Loan-product check · same deal, 3 products live
Conventional
25% down · 7.5% · 30yr
- Down + closing
- —
- Monthly P&I
- —
- Monthly cashflow
- —
- DSCR
- —
- Eligible?
- —
Personal DTI + credit; lowest rate.
DSCR
20% down · 8.5% · 30yr
- Down + closing
- —
- Monthly P&I
- —
- Monthly cashflow
- —
- DSCR
- —
- Eligible?
- —
No personal income docs; deal must DSCR.
Hard money
10% down · 12.0% · 12mo
- Down + closing
- —
- Monthly P&I
- —
- Monthly cashflow
- —
- DSCR
- —
- Eligible?
- —
Short-term bridge; refi at stabilization.
Listing history 17 events
-
2026-06-19days on market $225,000 Active 105 DOM
-
2026-06-18days on market $225,000 Active 104 DOM
-
2026-06-17days on market $225,000 Active 103 DOM
-
2026-06-16days on market $225,000 Active 102 DOM
-
2026-06-15days on market $225,000 Active 101 DOM
-
2026-06-14days on market $225,000 Active 99 DOM
-
2026-06-12days on market $225,000 Active 98 DOM
-
2026-06-09days on market $225,000 Active 95 DOM
-
2026-06-08days on market $225,000 Active 94 DOM
-
2026-06-07days on market $225,000 Active 93 DOM
-
2026-06-05days on market $225,000 Active 90 DOM
-
2026-06-03days on market $225,000 Active 89 DOM
-
2026-06-02days on market $225,000 Active 88 DOM
-
2026-06-01days on market $225,000 Active 87 DOM
-
2026-05-31days on market $225,000 Active 86 DOM
-
2026-05-30days on market $225,000 Active 85 DOM
-
2026-03-06$225,000 Active
ⓘ Source: listings_history table (triggers on properties + properties_extension) + one-shot
backfill from property_details.listing_events for pre-trigger history.
Tax reassessment forecast WA · Resets to sale price
- Current annual tax
- $1,655 · $138/mo
- Projected year-2 tax
- $2,205 · $184/mo
- Expected delta
- +$550/yr (+$46/mo · 33.3%)
ⓘ Screening estimate from a state-policy table — verify with the county assessor before closing.
Climate risk First Street
- Flood 1/10 Low FEMA zone X (unshaded) · 0% chance over 30 yrs
- Wildfire 1/10 Low
- Heat 1/10 Low 7 d/yr ≥73°F today · 14 d/yr by 30 yrs out
- Wind 1/10 Low
- Air quality 5/10 Major 6 unhealthy d/yr today · 6 by 30 yrs out
Nearby sold comps map
Loading sold comps map…
Walkable amenities ~0.75 mi
Loading nearby amenities…
Taxation est. · year 1
- Rental income
- $15,479
- − Mortgage interest
- −$12,603
- − Property taxes
- −$1,655
- − Insurance
- −$1,125
- − Repairs & maintenance
- −$1,238
- − Management
- −$1,238
- − Depreciation
- −$6,545
- Taxable loss
- −$8,927
- Est. tax savings @ 24.0%
- +$2,142
- After-tax cash flow
- $-2,568/yr
For passive investors: Depreciation is non-cash, so a rental often shows a tax loss while cash-flowing — sheltering income. Rental losses are passive: they offset passive income freely, and up to $25,000/yr can offset ordinary (W-2) income if you actively participate and your MAGI is under $100k (phasing out to $0 by $150k); unused losses carry forward. On sale, claimed depreciation is recaptured at up to 25%, and gains may owe capital-gains tax (a 1031 exchange can defer both). Figures are a year-1 estimate at your 24.0% rate — not tax advice; consult a CPA.
Schools (NCES district)
- District
- North Beach School District
- NCES district ID
- 5305700
- Math proficiency
- 32% ▼ -4.00%
- Reading proficiency
- 44% ▬ 0.00%
- Median HH income
- $40,966
- Composite
- 34.46/100
- National rank
- #10153
- State rank
- #236 of 291 in WA
Livability — Copalis Beach
- Score
- 49/100
- State rank
- #581
- US rank
- #25857
Category grades
Schools grade is shown separately in the Schools card above.
Census & demographics
- Census place
- Copalis Beach, WA
- Population (ZIP)
- 598
Population outlook (Grays Harbor County) Hauer SSP2
- Today (2025)
- 66,443 people
- By 2030
- 63,255 · -4.8%
- By 2040
- 56,466 · -15.0%
- By 2050
- 50,516 · -24.0%
- By 2075
- 39,296 · -40.9%
- By 2100
- 31,142 · -53.1%
Race, ethnicity, and origin ACS 2023
- Neighborhood character
- Predominantly White (95%)
- Race & ethnicity
- White 95% Two or more races 5%
- Common ancestry
- Italian 29% Slovak 4% Serbian 1%
- Foreign-born
- 1%
Political lean MEDSL · Grays Harbor
- 2024 margin
- Lean R (+6.0) · D 45.6% · R 51.6% · Other 2.8%
- 2008→2024 swing
- -20.6pp toward R · 2008: 14.6pp · 2024: -6.0pp
- All cycles
- 2024: R+6.0 2020: R+6.6 2016: R+7.1 2012: D+14.0 2008: D+14.6
Not yet ingested
- Civics
- —
Market trends
- HPI YoY
- ▲ 5.07%
- Current HPI
- 181.7725
- Rent YoY
- —
- Metro
- —
- State GDP YoY
- ▲ 4.65%
- F500 in state
- 22
Industry mix (Fortune 500 HQ in WA)
| Industry | F500 HQs | Revenue |
|---|---|---|
| Retail | 2 | $269B |
|
||
| Technology / Retail | 1 | $638B |
|
||
| Technology | 1 | $245B |
|
||
| Telecommunications | 1 | $38B |
|
||
| Food / Beverage | 1 | $36B |
|
||
| Automotive / Trucks | 1 | $34B |
|
||
Price history
1 event — show timeline
- 2026-03-06 Listed $225,000 NWMLS as Distributed by MLS Grid
Property tax history
+6.8%/yrLatest (2026): $1,655 · -3.0% YoY. Source: county tax records.
Cash-flow waterfall
monthlySold comps — $/sqft
last 12 mo · ≤1 miLoading sold comps…