 🏷️ Likely Rental
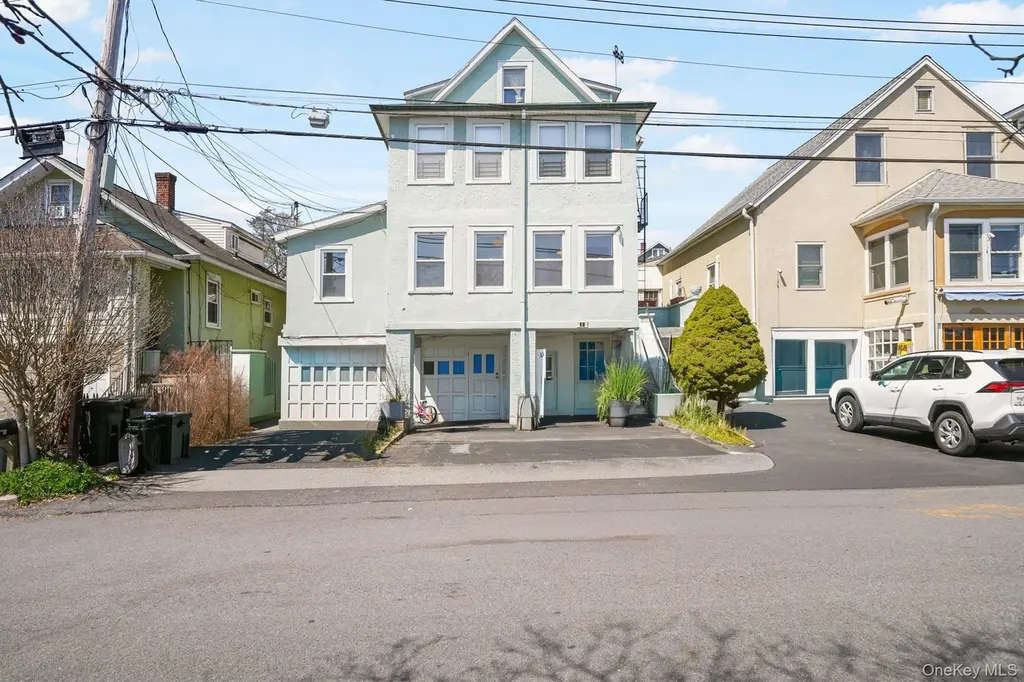
33 Hopper St · Pleasantville, NY
Flood risk 6/10 · Moderate
- FEMA flood zone
- X (unshaded)
- Chance of flooding over 30 yrs
- 0.75%
- Est. flood insurance / yr
- $507 – $1,088
Fire risk 3/10 · Minor
- Est. fire insurance / yr
- $691 – $1,283
Heat risk 6/10 · Moderate
- Hot days now (above 98°F)
- 7 days/yr
- Hot days in 30 yrs
- 15 days/yr
Wind risk 5/10 · Moderate
- Chance of severe wind over 30 yrs
- 26.0%
Air-quality risk 4/10 · Minor
- Unhealthy air days now
- 4 days/yr
- Unhealthy air days in 30 yrs
- 6 days/yr
Risk factors via First Street. Map © Google.
Why this score? — see what drove the B grade
The composite is a weighted blend of 9 inputs, each scored 0–100. Each bar is that input's sub-score; the figure is the points it added to the 100-point composite (weight × sub-score).
- Cash flow +24.9/30.0
- ARV discount +15.0/15.0
- DSCR +8.1/10.0
- 1% rule +7.3/10.0
- Schools +7.1/10.0
- Livability +3.9/5.0
- Rent growth +2.5/5.0
- Condition / age +2.5/5.0
- Appreciation +0.0/10.0
$950,000
🖨 Deal sheet 📄 Offer letter ✓ Due diligence
Multi-family units
County records classify this as Multi-Family (2-4 Unit). Listing-text estimate: 1 unit. estimate disagrees with records
Listing remarks MLS
Excellent investment or owner-occupant opportunity in the heart of Pleasantville! This well-maintained multi-family property features three apartments, including one 3-bedroom unit and two 2-bedroom units—ideal for generating steady rental income. Each unit offers 1 full bathroom, a functional layout, and great natural light throughout. The 2-bedroom apartments located on the second and third floors are currently tenant-occupied, while the 3-bedroom apartment on the first floor is vacant—perfect for owner occupancy or additional rental potential. The property includes two parking spaces in the driveway, one garage space, and plenty of public street parking available. The property is being sold As-is. Ideally located approximately 0.5 miles (about a 10-minute walk) from the Pleasantville train station, with easy access to local shops, restaurants, and everyday amenities. Enjoy a private backyard garden, offering outdoor space for relaxation or tenant use. Property is being sold as-is.
Key facts
- Three apartments
- Two parking spaces
- Tenant-occupied
Tags
Neighborhood map
What this means for you Summary
Snapshot
- This is a 7-bed/3.0-bath multifamily listed at $950k.
Deal economics
- At list price, monthly cash flow is $2k ($24k/yr) — positive.
- The deal already cash-flows at list — no discount required.
- Meets the 1% rule at list price ($12k rent vs $950k).
- Recommended offer: $893k (6.0% below list) — sets the bar for market timing.
- Cap rate 8.9% vs local median 2.1% in Pleasantville — top-decile yield for the area; either an underpriced asset or a hidden risk that comps aren't pricing in. Stress-test before assuming the spread holds.
Location & tenants
- Location reads 77/100 on livability (#194 in NY, #2,992 nationally) — a middle-class / working-renter tenant base. Strengths: schools A+, crime A+, employment A+; Watch: amenities F, cost of living F.
- Pleasantville Union Free School District (suburban): math 71% / reading 83% proficiency, ranked #46 of 590 in NY (top 8%) — strong family-tenant draw, lease renewals of 3-5y typical; only 6% free/reduced lunch — higher-income household profile.
- Market conditions: 42 active listings in the ZIP; high-income renter base; 954 units permitted in Westchester County in 2024 (649 in 5+ unit buildings).
- At $11,638/mo this rent would consume 76% of the median local household income ($184k/yr) (locally 281% of renters already pay >50% of income on rent) — very limited rent-growth headroom before tenants either downsize or default.
Forward outlook
- Local home prices are declining (-3.0%/yr); year-one equity from $7k of loan paydown is wiped out by about $28k of value loss. Plan a longer hold.
- Westchester County population projected at +10% by 2050 — modest demand growth; plan on rents tracking national, not racing it.
Negotiation context
- It's been on market 62 days — a 6% lower offer ($893k) is reasonable based on typical stale-listing flexibility.
Risks & watch-outs
- Watch-outs: built in 1911 — expect roof / HVAC / electrical / plumbing capex.
- Climate carrying-cost: major flood risk; moderate wind risk, 26% chance of damaging wind over 30y; extreme-heat days projected 7→15/yr by 2055 (HVAC capex compounding) — expect insurance premiums to compound above CPI over the hold.
Questions for the listing agent
- It's been on market 62 days. Have you received any prior offers? Is the seller open to a 6% concession, seller financing, or rate buy-down credit?
- Built in 1911 — when were the roof, HVAC, electrical panel, plumbing, and water heater last replaced?
- Why hasn't it sold? Are there any deal-killer items the seller is aware of (foundation, flood, title, zoning, code violations)?
- Is there a deadline driving the sale (1031 exchange, divorce, estate, relocation)? That informs how much negotiation room exists.
- Schools are A-rated — typically a magnet for longer-tenancy family renters. What's the average tenant stay here, and is there a school-zone premium baked into asking?
- What's the average days-on-market for RENTAL listings here right now (not sales)? A rising rental-DOM trend means longer vacancies and softer asking-rent achievability than the comps imply.
- What's the recent tenant-quality profile in this submarket — average credit score on applications, eviction rate, late-payment / NSF rate, and stable-employment percentage? A property-management company in the area should have these aggregated.
- How much new apartment / multifamily construction is in the pipeline within 1–3 miles? Heavy new supply (>2% of stock underway) typically softens rents 12–24 months out; light construction supports rent growth.
Investment metrics
- 1% rule
- 1.23% ✓
- Cap rate
- 8.86%
- Cash-on-cash
- 9.16%
- DSCR
- 1.41
- GRM
- 6.8
CMA / ARV
- ARV (median comp)
- $1,801,076
- List price
- $950,000
- Delta
- -47.25%
- Verdict
- UNDERPRICED
- Comps
- 20 within 1.0 mi
Show comp detail 2 sales within ~0.75 mi
| Address | Dist | Beds/Ba | Sqft | Sold | Price | $/sf | Match |
|---|---|---|---|---|---|---|---|
| 2 Sarles Ln | 0.30mi | 6/4.0 (-1) | 4,426 | 20mo | $880,000 | $199 | 48 |
| 41 Saratoga Ave | 0.51mi | 6/4.0 (-1) | 3,000 | 10mo | $965,000 | $322 | 46 |
Match score weights: distance 35% · size 25% · config 20% · recency 20%. Top-matched comps best support the ARV.
Projected returns pro-forma
-3.0% appreciation · 3.0% rent growth · sell at horizon
- IRR
- -2.4%
- Equity multiple
- 0.91×
- Total profit
- $-24,063
- Equity at exit
- $141,648
- IRR
- 7.3%
- Equity multiple
- 1.56×
- Total profit
- $147,791
- Equity at exit
- $82,139
Cash invested: $266,000 (down + closing). Projections, not guarantees.
Landlord ↔ Tenant lean methodology
- Overall (STATE)
- 15 Strongly Tenant-Friendly
- State New York
- 15 Strongly Tenant-Friendly · D+10
- County
- — inherits STATE
- City
- — inherits STATE
ZIP-level market 10570
- Active inventory
- 42
- Price-to-rent
- 18.3×
Monthly cashflow live
- Estimated rent
- $11,638 high interval (Pro) →
- Mortgage (P&I)
- −$4,982
- Tax from tax record
- −$1,786 /mo · $21,427/yr
- Insurance
- −$396
- HOA
- −$0
- Vacancy / Maint / Mgmt
- −$2,444
- Net cashflow
- $2,031
Break-even live
3-unit breakdown (identical units grouped — click to expand)
| Units | Beds | Baths | Est. rent |
|---|---|---|---|
| 1× unit | 3 | 1 | $4,320 |
| 2× units | 2 | 1 | $7,318 |
| #2 | 2 | 1 | $3,659 |
| #3 | 2 | 1 | $3,659 |
| Total (3 units) | $11,638 | ||
UW: 25.0% down · 7.5% · 30yr · 1.5% tax · 5.0% vac · 8.0% maint · 8.0% mgmt
Financing live
Cash to close
- Down payment
- $237,500
- Closing costs
- $28,500
- Reserves months
- —
- Total cash needed
- —
Loan-product check · same deal, 3 products live
Conventional
25% down · 7.5% · 30yr
- Down + closing
- —
- Monthly P&I
- —
- Monthly cashflow
- —
- DSCR
- —
- Eligible?
- —
Personal DTI + credit; lowest rate.
DSCR
20% down · 8.5% · 30yr
- Down + closing
- —
- Monthly P&I
- —
- Monthly cashflow
- —
- DSCR
- —
- Eligible?
- —
No personal income docs; deal must DSCR.
Hard money
10% down · 12.0% · 12mo
- Down + closing
- —
- Monthly P&I
- —
- Monthly cashflow
- —
- DSCR
- —
- Eligible?
- —
Short-term bridge; refi at stabilization.
Listing history 12 events
-
2026-06-16status $950,000 Pending 62 DOM
-
2026-06-15days on market $950,000 Active 62 DOM
-
2026-06-13days on market $950,000 Active 60 DOM
-
2026-06-09days on market $950,000 Active 56 DOM
-
2026-06-08days on market $950,000 Active 55 DOM
-
2026-06-07days on market $950,000 Active 54 DOM
-
2026-06-04days on market $950,000 Active 51 DOM
-
2026-06-03days on market $950,000 Active 50 DOM
-
2026-06-02days on market $950,000 Active 49 DOM
-
2026-06-01days on market $950,000 Active 48 DOM
-
2026-05-31days on market $950,000 Active 47 DOM
-
2026-04-10$950,000 Active 1010-char remark
Show marketing remark (1010 chars)
Excellent investment or owner-occupant opportunity in the heart of Pleasantville! This well-maintained multi-family property features three apartments, including one 3-bedroom unit and two 2-bedroom units—ideal for generating steady rental income. Each unit offers 1 full bathroom, a functional layout, and great natural light throughout. The 2-bedroom apartments located on the second and third floors are currently tenant-occupied, while the 3-bedroom apartment on the first floor is vacant—perfect for owner occupancy or additional rental potential. The property includes two parking spaces in the driveway, one garage space, and plenty of public street parking available. The property is being sold As-is. Ideally located approximately 0.5 miles (about a 10-minute walk) from the Pleasantville train station, with easy access to local shops, restaurants, and everyday amenities. Enjoy a private backyard garden, offering outdoor space for relaxation or tenant use. Property is being sold as-is.
ⓘ Source: listings_history table (triggers on properties + properties_extension) + one-shot
backfill from property_details.listing_events for pre-trigger history.
Tax reassessment forecast NY · Partial reset (capped growth)
- Current annual tax
- $21,427 · $1,786/mo
- Projected year-2 tax
- $21,427 · $1,786/mo
- Expected delta
- $0/yr ($0/mo · 0.0%)
ⓘ Screening estimate from a state-policy table — verify with the county assessor before closing.
Climate risk First Street
- Flood 6/10 Major FEMA zone X (unshaded) · 75% chance over 30 yrs
- Wildfire 3/10 Moderate
- Heat 6/10 Major 7 d/yr ≥98°F today · 15 d/yr by 30 yrs out
- Wind 5/10 Major 26% chance of damaging wind over 30 yrs
- Air quality 4/10 Moderate 4 unhealthy d/yr today · 6 by 30 yrs out
Nearby sold comps map
Loading sold comps map…
Walkable amenities ~0.75 mi
Loading nearby amenities…
Taxation est. · year 1
- Rental income
- $139,656
- − Mortgage interest
- −$53,215
- − Property taxes
- −$21,427
- − Insurance
- −$4,750
- − Repairs & maintenance
- −$11,172
- − Management
- −$11,172
- − Depreciation
- −$27,636
- Taxable income
- $10,282
- Est. tax owed @ 24.0%
- −$2,468
- After-tax cash flow
- $21,900/yr
For passive investors: Depreciation is non-cash, so a rental often shows a tax loss while cash-flowing — sheltering income. Rental losses are passive: they offset passive income freely, and up to $25,000/yr can offset ordinary (W-2) income if you actively participate and your MAGI is under $100k (phasing out to $0 by $150k); unused losses carry forward. On sale, claimed depreciation is recaptured at up to 25%, and gains may owe capital-gains tax (a 1031 exchange can defer both). Figures are a year-1 estimate at your 24.0% rate — not tax advice; consult a CPA.
Schools (NCES district)
- District
- Pleasantville Union Free School District
- NCES district ID
- 3623310
- Math proficiency
- 71% ▼ -6.00%
- Reading proficiency
- 83% ▲ 7.00%
- Median HH income
- $115,887
- Composite
- 71.43/100
- National rank
- #227
- State rank
- #46 of 590 in NY
Livability — Pleasantville
- Score
- 77/100
- State rank
- #194
- US rank
- #2992
Category grades
Schools grade is shown separately in the Schools card above.
Census & demographics
- Census place
- Pleasantville, NY
- County
- Westchester County · 709,332 people
- City population
- 13,289
- Metro
- New York-Newark-Jersey City, NY-NJ-PA
- Population (ZIP)
- 13,289
- Household income
- $183,833
- Rent vs Own
- Severe rent burden
- 281.0
Population outlook (Westchester County) Hauer SSP2
- Today (2025)
- 1,028,035 people
- By 2030
- 1,051,636 · +2.3%
- By 2040
- 1,098,520 · +6.9%
- By 2050
- 1,136,044 · +10.5%
- By 2075
- 1,196,925 · +16.4%
- By 2100
- 1,175,147 · +14.3%
Race, ethnicity, and origin ACS 2023
- Neighborhood character
- Predominantly White (77%)
- Race & ethnicity
- White 77% Hispanic / Latino 13% Two or more races 6% Black 4% Asian 3%
- Hispanic origin (detail)
- Puerto Rican 1%
- Common ancestry
- Romanian 4% Scotch-Irish 4% Italian 4%
- Foreign-born
- 13% · Canada, China, Jamaica
- Languages at home
- 85% English-only · Spanish 8% Other Indo-European 2% Chinese 1%
Political lean MEDSL · Westchester
- 2024 margin
- Strong D (+26.3) · D 63.1% · R 36.9%
- 2008→2024 swing
- -1.3pp toward R · 2008: 27.6pp · 2024: 26.3pp
- All cycles
- 2024: D+26.3 2020: D+36.3 2016: D+32.8 2012: D+22.2 2008: D+27.6
Not yet ingested
- Civics
- —
Market trends
- HPI YoY
- ▼ -695.32%
- Current HPI
- 277.2529
- Rent YoY
- —
- Metro
- New York-Newark-Jersey City, NY-NJ-PA
- State GDP YoY
- ▲ 2.60%
- F500 in state
- 92
Industry mix (Fortune 500 HQ in NY)
| Industry | F500 HQs | Revenue |
|---|---|---|
| Financial Services | 10 | $950B |
|
||
| Consumer Goods | 9 | $162B |
|
||
| Insurance | 4 | $225B |
|
||
| Telecommunications | 2 | $144B |
|
||
| Pharmaceuticals | 2 | $112B |
|
||
| Media / Entertainment | 2 | $69B |
|
||
Price history
1 event — show timeline
- 2026-04-10 Listed $950,000 OneKey® MLS as Distributed by MLS Grid
Property tax history
+10.8%/yrLatest (2025): $21,427 · +9.9% YoY. Source: county tax records.
Cash-flow waterfall
monthlySold comps — $/sqft
last 12 mo · ≤1 miLoading sold comps…