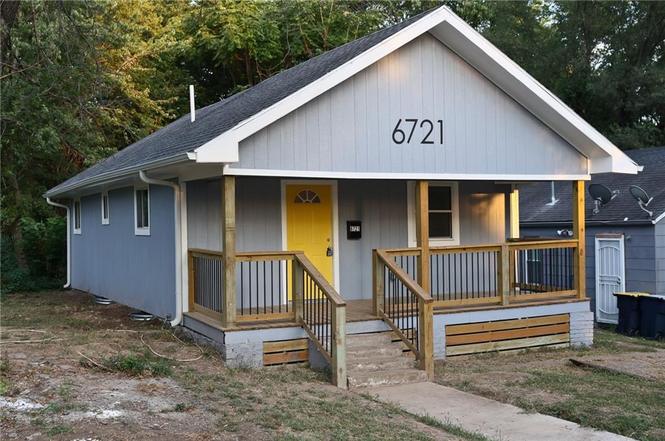
6721 S Benton Ave · Kansas City, MO
Flood risk 1/10 · Minimal
- FEMA flood zone
- X (unshaded)
- Chance of flooding over 30 yrs
- 0.0%
- Est. flood insurance / yr
- $473 – $860
Fire risk 1/10 · Minimal
- Est. fire insurance / yr
- $1,054 – $1,958
Heat risk 4/10 · Minor
- Hot days now (above 106°F)
- 7 days/yr
- Hot days in 30 yrs
- 16 days/yr
Wind risk 2/10 · Minimal
- Chance of severe wind over 30 yrs
- —
Air-quality risk 3/10 · Minor
- Unhealthy air days now
- 2 days/yr
- Unhealthy air days in 30 yrs
- 4 days/yr
Risk factors via First Street. Map © Google.
Why this score? — see what drove the C- grade
The composite is a weighted blend of 9 inputs, each scored 0–100. Each bar is that input's sub-score; the figure is the points it added to the 100-point composite (weight × sub-score).
- Cash flow +16.0/30.0
- Appreciation +10.0/10.0
- 1% rule +5.3/10.0
- DSCR +5.0/10.0
- ARV discount +4.7/15.0
- Livability +3.9/5.0
- Rent growth +3.2/5.0
- Condition / age +2.5/5.0
- Schools +1.5/10.0
$114,900
🖨 Deal sheet (PDF) 📄 Offer letter ✓ Due diligence
Listing remarks
Fully rehabbed 2 bed room 2 bathroom Bungalow right in the heart of Kansas City. This house boast of new exterior siding, a new roof, new windows, Fresh exterior paint, an open floor plan, with lots of recessed lighting, fresh paint, updated fixtures, updated Kitchen, large deck for summer gatherings or for enjoying hot chocolate on cool fall evening, updated Bathrooms(master bath comes with a jet stream tub) and Both bedrooms are sizeable. Come make this affordable home yours! * * * seller is willing to $500 towards closing cost * * *
Key facts
- Open floor plan
- Recessed lighting
- New exterior siding
Tags
Neighborhood map
What this means for you Summary
Snapshot
- This is a 2-bed/1.0-bath single-family listed at $115k.
Deal economics
- At list price, monthly cash flow is $58 ($694/yr) — positive.
- The deal already cash-flows at list — no discount required.
- Meets the 1% rule at list price ($1k rent vs $115k).
- Recommended offer: $101k (12.0% below list) — sets the bar for market timing.
- Cap rate 6.9% vs local median 3.9% in Kansas City — top-decile yield for the area; either an underpriced asset or a hidden risk that comps aren't pricing in. Stress-test before assuming the spread holds.
Location & tenants
- Location reads 78/100 on livability (#28 in MO, #2,671 nationally) — a middle-class / working-renter tenant base. Strengths: amenities A+, commute A+, cost of living A+; Watch: crime F.
- Kansas City 33 (urban): math 12% / reading 24% proficiency, ranked #308 of 324 in MO (top 95%) — low school quality limits family demand, transient renter base, plan for 1-2y turnover; 75% free/reduced lunch — lower-income household profile, screen leases tightly.
- Zoned schools: B. Banneker Elementary (math 2% / reading 8%, grade F, #1,072 of 1,115 statewide, top 98%, 390 students, 99% FRL); Southeast High School (math 2% / reading 12%, grade F, #512 of 521 statewide, top 99%, 487 students, 99% FRL) — zoned schools average 99% FRL vs 75% district-wide (24 pts higher); higher-poverty schools than district average — tighter screening recommended.
- Market conditions: Rents rising (+3.0%/yr); 94 active listings in the ZIP; 40 comparable units currently listed for rent nearby; rentals at typical pace (median 25d on market — plan ~3-4 weeks tenant-placement turnaround); 4,002 units permitted in Jackson County in 2024 (2,271 in 5+ unit buildings).
- This rent runs 31% of the median local income ($46k/yr) — at the standard rent-burdened threshold; future hikes will face affordability resistance.
Forward outlook
- In year one you build about $12k of equity ($794 loan paydown + $11k appreciation (10.0% local appreciation)).
- Jackson County population projected at +4% by 2050 — modest demand growth; plan on rents tracking national, not racing it.
- At projected returns (10.0% appreciation + 3.0% rent growth), your $32k cash investment doubles in ~3 years — after that, you're playing with house money.
- By year 3, paydown + projected appreciation supports a ~$31k cash-out refi (75% LTV) — recoverable capital for the next deal without selling this one.
Negotiation context
- It's been on market 164 days — a 12% lower offer ($101k) is reasonable based on typical stale-listing flexibility.
Risks & watch-outs
- Watch-outs: built in 1920 — expect roof / HVAC / electrical / plumbing capex.
Questions for the listing agent
- It's been on market 164 days. Have you received any prior offers? Is the seller open to a 12% concession, seller financing, or rate buy-down credit?
- Built in 1920 — when were the roof, HVAC, electrical panel, plumbing, and water heater last replaced?
- Why hasn't it sold? Are there any deal-killer items the seller is aware of (foundation, flood, title, zoning, code violations)?
- Is there a deadline driving the sale (1031 exchange, divorce, estate, relocation)? That informs how much negotiation room exists.
- Crime grade is F in this area — have there been break-ins, vandalism, or insurance claims at this property in the last 3 years? What carrier currently insures it and at what premium?
- What's the average days-on-market for RENTAL listings here right now (not sales)? A rising rental-DOM trend means longer vacancies and softer asking-rent achievability than the comps imply.
- What's the recent tenant-quality profile in this submarket — average credit score on applications, eviction rate, late-payment / NSF rate, and stable-employment percentage? A property-management company in the area should have these aggregated.
- How much new for-sale + rental construction is in the pipeline within 1–3 miles? Heavy new supply typically softens prices + rents 12–24 months out; constrained supply supports both.
Investment metrics
- 1% rule
- 1.03% ✓
- Cap rate
- 6.90%
- Cash-on-cash
- 2.16%
- DSCR
- 1.10
- GRM
- 8.1
CMA / ARV
- ARV (on-the-fly)
- $108,225
- Comps found
- 12
Show comp detail 12 sales within ~0.75 mi
| Address | Dist | Beds/Ba | Sqft | Sold | Price | $/sf | Match |
|---|---|---|---|---|---|---|---|
| 2401 E 68th Ter | 0.35mi | 2/1.0 | 984 (+1%) | 6mo | $85,000 | $86 | 77 |
| 2230 E 67th Ter | 0.37mi | 2/1.0 | 897 (-8%) | 1mo | $99,900 | $111 | 69 |
| 6942 College Ave | 0.38mi | 3/1.5 (+1) | 990 (+2%) | 6mo | $80,000 | $81 | 68 |
| 6727 Agnes Ave | 0.07mi | 3/1.0 (+1) | 1,100 (+13%) | 4mo | $90,000 | $82 | 67 |
| 6815 S Benton Ave | 0.11mi | 2/1.0 | 832 (-15%) | 4mo | $99,000 | $119 | 67 |
| 2407 E 69th Ter | 0.40mi | 2/1.0 | 875 (-10%) | 2mo | $105,000 | $120 | 63 |
| 7103 Agnes Ave | 0.48mi | 2/1.0 | 854 (-12%) | 0mo | $65,000 | $76 | 57 |
| 3608 E 72nd St | 0.73mi | 3/1.0 (+1) | 959 (-2%) | 3mo | $74,900 | $78 | 56 |
| 2816 E 63rd St | 0.57mi | 3/1.0 (+1) | 1,056 (+8%) | 1mo | $139,900 | $132 | 54 |
| 7040 Agnes Ave | 0.43mi | 3/1.0 (+1) | 840 (-14%) | 1mo | $99,900 | $119 | 51 |
| 4015 E 68th Ter | 0.73mi | 3/1.0 (+1) | 916 (-6%) | 5mo | $139,900 | $153 | 47 |
| 7127 Bales Ave | 0.64mi | 3/1.0 (+1) | 864 (-11%) | 6mo | $50,000 | $58 | 41 |
Match score weights: distance 35% · size 25% · config 20% · recency 20%. Top-matched comps best support the ARV.
Projected returns pro-forma
10.0% appreciation · 2.98% rent growth · sell at horizon
- IRR
- 25.8%
- Equity multiple
- 3.06×
- Total profit
- $66,308
- Equity at exit
- $103,511
- IRR
- 22.7%
- Equity multiple
- 6.98×
- Total profit
- $192,463
- Equity at exit
- $223,225
Cash invested: $32,172 (down + closing). Projections, not guarantees.
Landlord ↔ Tenant lean methodology
- Overall (STATE)
- 81 Strongly Landlord-Friendly
- State Missouri
- 81 Strongly Landlord-Friendly · R+10
- County
- — inherits STATE
- City
- — inherits STATE
ZIP-level market 64132
- Home prices YoY
- 23.6%
- Rents YoY
- 3.0%
- Active inventory
- 94
- Price-to-rent
- 8.1×
Monthly cashflow live
- Estimated rent
- $1,188 high interval (Pro) →
- Mortgage (P&I)
- −$603
- Tax from tax record
- −$230 /mo · $2,759/yr
- Insurance
- −$48
- HOA
- −$0
- Vacancy / Maint / Mgmt
- −$249
- Net cashflow
- $58
Break-even live
Sensitivity live
| Price | -10% $123 | -5% $90 | +0% $58 | +5% $25 | +10% $-7 |
|---|---|---|---|---|---|
| Rent | -10% $-36 | -5% $11 | +0% $58 | +5% $105 | +10% $152 |
| Rate | -1.0pp $116 | -0.5pp $87 | base $58 | +0.5pp $28 | +1.0pp $-2 |
UW: 25.0% down · 7.5% · 30yr · 1.5% tax · 5.0% vac · 8.0% maint · 8.0% mgmt
Financing live
Cash to close
- Down payment
- $28,725
- Closing costs
- $3,447
- Reserves months
- —
- Total cash needed
- —
Loan-product check · same deal, 3 products live
Conventional
25% down · 7.5% · 30yr
- Down + closing
- —
- Monthly P&I
- —
- Monthly cashflow
- —
- DSCR
- —
- Eligible?
- —
Personal DTI + credit; lowest rate.
DSCR
20% down · 8.5% · 30yr
- Down + closing
- —
- Monthly P&I
- —
- Monthly cashflow
- —
- DSCR
- —
- Eligible?
- —
No personal income docs; deal must DSCR.
Hard money
10% down · 12.0% · 12mo
- Down + closing
- —
- Monthly P&I
- —
- Monthly cashflow
- —
- DSCR
- —
- Eligible?
- —
Short-term bridge; refi at stabilization.
Rent comps 40 comps
| Address | Beds | Baths | Sqft | Rent | $/sqft | DOM | Units | Dist |
|---|---|---|---|---|---|---|---|---|
| 6703 Walrond Ave Kansas City, MO | 2.0 | 1.0 | 912 | $1,200 | $1.32 | 3d | 1 | 0.20mi |
| 2430 E 67th Ter Kansas City, MO | 3.0 | 2.0 | 960 | $1,195 | $1.24 | 44d | 1 | 0.25mi |
| 2421 E 67th Ter Kansas City, MO | 2.0 | 1.0 | 816 | $1,125 | $1.38 | 17d | 1 | 0.25mi |
| 6921 Prospect Ave Unit C Kansas City, MO | 1.0 | 1.0 | 538 | $850 | $1.58 | 5d | 1 | 0.29mi |
| 7022 S Benton Ave Kansas City, MO | 3.0 | 1.5 | 1100 | $1,095 | $1.00 | 15d | 1 | 0.36mi |
| 7036 Bellefontaine Ave Unit A Kansas City, MO | 2.0 | 1.0 | 810 | $1,200 | $1.48 | 3d | 1 | 0.41mi |
| 2422 E 70th Ter Kansas City, MO | 2.0 | 1.0 | 748 | $1,356 | $1.81 | 13d | 1 | 0.41mi |
| 2120 E 68th Ter Kansas City, MO | 2.0 | 1.0 | 930 | $1,200 | $1.29 | 24d | 1 | 0.45mi |
| 3601 E Meyer Blvd Kansas City, MO | 1.0 | 1.0 | 560 | $900 | $1.61 | 44d | 1 | 0.49mi |
| 7133 Agnes Ave Kansas City, MO | 3.0 | 2.0 | 1100 | $1,645 | $1.50 | 24d | 1 | 0.51mi |
| 6817 Cleveland Ave Kansas City, MO | 2.0 | 1.0 | 779 | $1,100 | $1.41 | 44d | 1 | 0.58mi |
| 7115 Bales Ave Kansas City, MO | 3.0 | 1.0 | 865 | $1,350 | $1.56 | 17d | 1 | 0.61mi |
| 1831 E 68th St Kansas City, MO | 3.0 | 1.0 | 1043 | $1,250 | $1.20 | 17d | 1 | 0.61mi |
| 7127 Bales Ave Kansas City, MO | 3.0 | 1.0 | 900 | $1,350 | $1.50 | 24d | 1 | 0.63mi |
| 1805 E 67th St Kansas City, MO | 2.0 | 1.0 | 1064 | $1,200 | $1.13 | 17d | 1 | 0.68mi |
| 7317 Agnes Ave Kansas City, MO | 2.0 | 1.0 | 767 | $895 | $1.17 | 24d | 1 | 0.73mi |
| 7412 Bellefontaine Ave Unit A Kansas City, MO | 2.0 | 1.0 | 780 | $1,200 | $1.54 | 3d | 1 | 0.84mi |
| 6901 Jackson Ave Unit 6903 Kansas City, MO | 3.0 | 1.0 | 1000 | $1,200 | $1.20 | 22d | 1 | 0.85mi |
| 7411 Montgall Ave Kansas City, MO | 3.0 | 1.0 | 840 | $1,200 | $1.43 | 44d | 1 | 0.85mi |
| 1435 E 66th Ter Kansas City, MO | 3.0 | 1.0 | 988 | $1,340 | $1.36 | 13d | 1 | 0.87mi |
| 6029 Indiana Ave Kansas City, MO | 2.0 | 1.0 | 832 | $1,150 | $1.38 | 44d | 1 | 0.91mi |
| 7426 Indiana Ave Kansas City, MO | 3.0 | 1.0 | 1100 | $1,400 | $1.27 | 44d | 1 | 0.92mi |
| 3106 E 75th St Kansas City, MO | 3.0 | 1.5 | 985 | $1,225 | $1.24 | 22d | 1 | 0.93mi |
| 3604 E 61st St Unit 3604 Kansas City, MO | 3.0 | 1.0 | 875 | $1,300 | $1.49 | 44d | 1 | 0.93mi |
| 6941 Spruce Ave Kansas City, MO | 2.0 | 1.0 | 815 | $950 | $1.17 | 44d | 1 | 0.94mi |
| 6653 Lydia Ave Kansas City, MO | 3.0 | 1.0 | 962 | $1,500 | $1.56 | 17d | 1 | 0.94mi |
| 6404 The Paseo Kansas City, MO | 1.0–2.0 | 1.0–2.0 | 942 | $1,600 | $1.70 | 3d | 6 | 0.97mi |
| 7427 Arleta Blvd Kansas City, MO | 2.0 | 1.0 | 805 | $1,150 | $1.43 | 44d | 1 | 1.01mi |
| 1702 Bushman Dr Kansas City, MO | 1.0–2.0 | 1.0–2.0 | 895 | $1,065 | $1.19 | 44d | 1 | 1.08mi |
| 2512 E 59th St Kansas City, MO | 2.0 | 1.0 | 750 | $1,150 | $1.53 | 44d | 1 | 1.08mi |
| 7560 Prospect Ave Unit F Kansas City, MO | 1.0 | 1.0 | 900 | $925 | $1.03 | 44d | 1 | 1.12mi |
| 2205 E 59th St Kansas City, MO | 2.0 | 1.0 | 724 | $1,025 | $1.42 | 17d | 1 | 1.12mi |
| 7560 Prospect Ave Unit G Kansas City, MO | 1.0 | 1.0 | 900 | $925 | $1.03 | 5d | 1 | 1.12mi |
| 3615 E 58th St Unit 1 Kansas City, MO | 2.0 | 1.0 | 936 | $875 | $0.93 | 44d | 1 | 1.27mi |
| 3617 E 58th St Unit 2 Kansas City, MO | 2.0 | 1.0 | 936 | $875 | $0.93 | 44d | 1 | 1.27mi |
| 2100 E 58th St Kansas City, MO | 2.0 | 1.0 | 1030 | $1,500 | $1.46 | 44d | 1 | 1.29mi |
| 4250 E 60 Ter Unit 4250 Kansas City, MO | 2.0 | 1.0 | 783 | $895 | $1.14 | 24d | 1 | 1.30mi |
| 5709 Bales Ave Kansas City, MO | 2.0 | 1.0 | 782 | $1,095 | $1.40 | 24d | 1 | 1.31mi |
| 5713 Brooklyn Ave Kansas City, MO | 2.0 | 1.0 | 600 | $1,200 | $2.00 | 8d | 1 | 1.32mi |
| 5730 Garfield Ave Kansas City, MO | 3.0 | 1.0 | 866 | $1,195 | $1.38 | 17d | 1 | 1.32mi |
Listing history 7 events
-
2026-02-25status Pending
-
2026-01-08price $114,900
-
2025-11-14price $134,900
-
2025-10-02price $149,900
-
2025-09-14$164,900 Active
-
2006-05-19soldstatus
-
1994-05-18soldstatus
ⓘ Source: listings_history table (triggers on properties + properties_extension) + one-shot
backfill from property_details.listing_events for pre-trigger history.
Tax reassessment forecast MO · Resets to sale price
- Current annual tax
- $2,759 · $230/mo
- Projected year-2 tax
- $2,759 · $230/mo
- Expected delta
- $0/yr ($0/mo · 0.0%)
ⓘ Screening estimate from a state-policy table — verify with the county assessor before closing.
Climate risk First Street
- Flood 1/10 Low FEMA zone X (unshaded) · 0% chance over 30 yrs
- Wildfire 1/10 Low
- Heat 4/10 Moderate 7 d/yr ≥106°F today · 16 d/yr by 30 yrs out
- Wind 2/10 Low
- Air quality 3/10 Moderate 2 unhealthy d/yr today · 4 by 30 yrs out
Nearby sold comps map
Loading sold comps map…
Walkable amenities ~0.75 mi
Loading nearby amenities…
Taxation est. · year 1
- Rental income
- $14,251
- − Mortgage interest
- −$6,436
- − Property taxes
- −$2,759
- − Insurance
- −$574
- − Repairs & maintenance
- −$1,140
- − Management
- −$1,140
- − Depreciation
- −$3,343
- Taxable loss
- −$1,142
- Est. tax savings @ 24.0%
- +$274
- After-tax cash flow
- $968/yr
For passive investors: Depreciation is non-cash, so a rental often shows a tax loss while cash-flowing — sheltering income. Rental losses are passive: they offset passive income freely, and up to $25,000/yr can offset ordinary (W-2) income if you actively participate and your MAGI is under $100k (phasing out to $0 by $150k); unused losses carry forward. On sale, claimed depreciation is recaptured at up to 25%, and gains may owe capital-gains tax (a 1031 exchange can defer both). Figures are a year-1 estimate at your 24.0% rate — not tax advice; consult a CPA.
Schools (NCES district)
- District
- Kansas City 33
- NCES district ID
- 2916400
- Math proficiency
- 12% ▼ -8.00%
- Reading proficiency
- 24% ▬ 0.00%
- Median HH income
- $35,227
- Composite
- 14.8/100
- National rank
- #9387
- State rank
- #308 of 324 in MO
Livability — Kansas City
- Score
- 78/100
- State rank
- #28
- US rank
- #2671
Category grades
Schools grade is shown separately in the Schools card above.
Census & demographics
- Census place
- Kansas City, MO
- County
- Jackson County · 687,798 people
- City population
- 439,467
- Metro
- Kansas City, MO-KS
- Population (ZIP)
- 12,084
- Household income
- $45,622
- Rent vs Own
- Severe rent burden
- 679.0
Population outlook (Jackson County) Hauer SSP2
- Today (2025)
- 719,589 people
- By 2030
- 731,456 · +1.6%
- By 2040
- 746,689 · +3.8%
- By 2050
- 749,289 · +4.1%
- By 2075
- 736,227 · +2.3%
- By 2100
- 668,210 · -7.1%
Race, ethnicity, and origin ACS 2023
- Neighborhood character
- Predominantly Black (66%)
- Race & ethnicity
- Black 66% White 16% Hispanic / Latino 11% Two or more races 10%
- Hispanic origin (detail)
- Mexican 9%
- Common ancestry
- Italian 2% Scotch-Irish 1% Romanian 1%
- Foreign-born
- 6% · Canada, Jamaica
- Languages at home
- 92% English-only · Spanish 7%
Political lean MEDSL · Jackson
- 2024 margin
- D (+19.3) · D 58.9% · R 39.5% · Other 1.6%
- 2008→2024 swing
- -6.1pp toward R · 2008: 25.4pp · 2024: 19.3pp
- All cycles
- 2024: D+19.3 2020: D+22.0 2016: D+16.6 2012: D+19.0 2008: D+25.4
Not yet ingested
- Civics
- —
Market trends
- HPI YoY
- ▲ 79.13%
- Current HPI
- 414.4305
- Rent YoY
- ▲ 2.98%
- Metro
- Kansas City, MO-KS
- State GDP YoY
- ▲ 1.84%
- F500 in state
- 20
Industry mix (Fortune 500 HQ in MO)
| Industry | F500 HQs | Revenue |
|---|---|---|
| Healthcare | 1 | $163B |
|
||
| Insurance | 1 | $21B |
|
||
| Industrial Technology | 1 | $17B |
|
||
| Retail | 1 | $16B |
|
||
| Industrial Distribution | 1 | $10B |
|
||
| Utilities | 1 | $9B |
|
||
Price history
-30.3% since first listed7 events — show timeline
- 2026-02-25 Pending — Heartland MLS as Distributed by MLS Grid
- 2026-01-08 Price Changed $114,900 Heartland MLS as Distributed by MLS Grid
- 2025-11-14 Price Changed $134,900 Heartland MLS as Distributed by MLS Grid
- 2025-10-02 Price Changed $149,900 Heartland MLS as Distributed by MLS Grid
- 2025-09-14 Listed $164,900 Heartland MLS as Distributed by MLS Grid
- 2006-05-19 Sold (Public Records) — Public Records
- 1994-05-18 Sold (Public Records) — Public Records
Property tax history
+20.7%/yrLatest (2025): $2,759 · +130.6% YoY. Source: county tax records.
Cash-flow waterfall
monthlySold comps — $/sqft
last 12 mo · ≤1 miLoading sold comps…