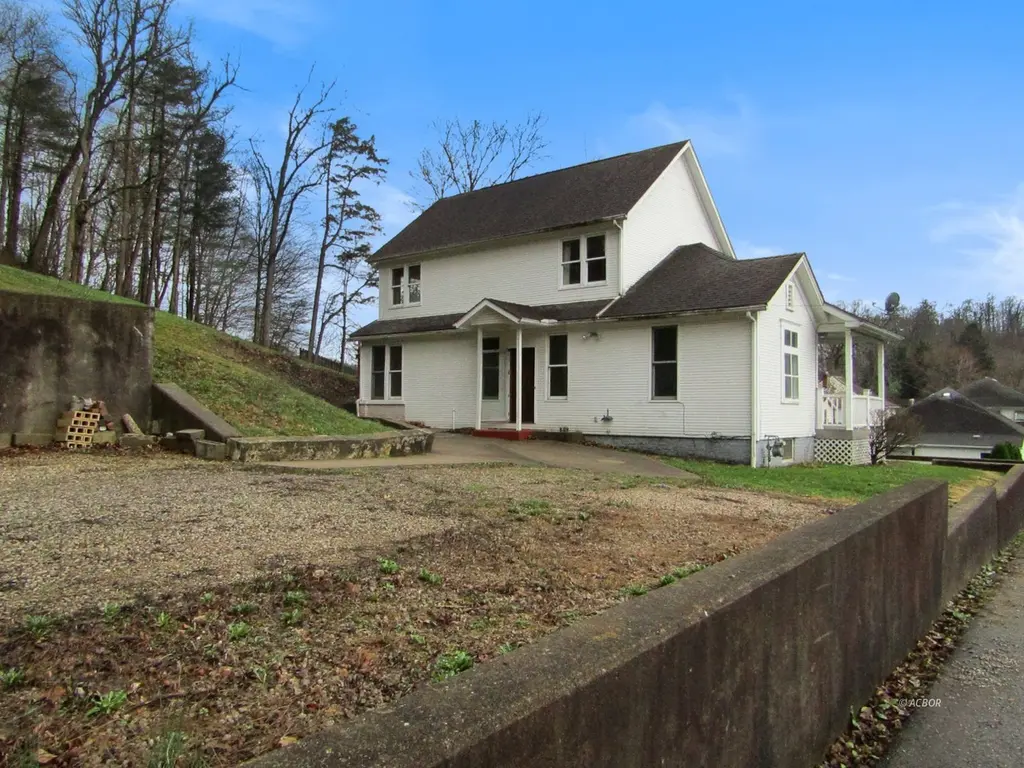
1 Poling Ave · Nelsonville, OH
Flood risk 6/10 · Moderate
- FEMA flood zone
- X (unshaded)
- Chance of flooding over 30 yrs
- 0.53%
- Est. flood insurance / yr
- $473 – $860
Fire risk 3/10 · Minor
- Est. fire insurance / yr
- $713 – $1,323
Heat risk 4/10 · Minor
- Hot days now (above 100°F)
- 7 days/yr
- Hot days in 30 yrs
- 19 days/yr
Wind risk 2/10 · Minimal
- Chance of severe wind over 30 yrs
- 1.0%
Air-quality risk 2/10 · Minimal
- Unhealthy air days now
- 0 days/yr
- Unhealthy air days in 30 yrs
- 1 days/yr
Risk factors via First Street. Map © Google.
Why this score? — see what drove the B grade
The composite is a weighted blend of 9 inputs, each scored 0–100. Each bar is that input's sub-score; the figure is the points it added to the 100-point composite (weight × sub-score).
- Cash flow +28.5/30.0
- ARV discount +15.0/15.0
- DSCR +10.0/10.0
- 1% rule +7.9/10.0
- Livability +3.2/5.0
- Schools +2.7/10.0
- Rent growth +2.5/5.0
- Condition / age +2.5/5.0
- Appreciation +0.0/10.0
$92,900
🖨 Deal sheet (PDF) 📄 Offer letter ✓ Due diligence
Listing remarks MLS
1 Poling Ave Nelsonville, Oh 45701
Key facts
- Large upper deck
- Waterfalls
- Hocking hills region
Tags
Property features AI
Finance
- Other: Tax amount listed but excluded per instructions
- Financial info: No investor or income/expense details provided
- HOA & community: No HOA details provided
Exterior
- Parking: No parking details provided
- Security: No security details provided
- Utilities: No utility details provided
- Home design: Single family residence; Residential property; 2-story
- Construction: Vinyl siding
- Exterior features: Asphalt/shingle roof
Interior
- Kitchen: Dishwasher; Electric range; Electric oven
- Bedrooms: 7 total rooms (bedroom count not specified)
- Flooring: Tile; Wood; Linoleum
- Bathrooms: 2 full bathrooms
- Heating & cooling: Window unit(s) for cooling
- Interior features: Laminate counters; Unfinished basement
- Laundry & utility: No laundry details provided
Neighborhood map
What this means for you Summary
Snapshot
- This is a 3-bed/2.0-bath single-family listed at $93k.
Deal economics
- At list price, monthly cash flow is $304 ($4k/yr) — positive.
- The deal already cash-flows at list — no discount required.
- Meets the 1% rule at list price ($1k rent vs $93k).
Location & tenants
- Location reads 65/100 on livability (#750 in OH) — a middle-class / working-renter tenant base. Strengths: cost of living A+, housing A; Watch: health & safety C-, amenities F, commute F.
- Nelsonville-York City (rural): math 31% / reading 35% proficiency, ranked #572 of 656 in OH (top 87%) — families likely to look elsewhere, expect single-tenant / working-renter base with shorter leases.
- Zoned schools: Nelsonville-York Elementary School (math 40% / reading 39%, grade F, #1,055 of 1,584 statewide, top 68%, 511 students, 0% FRL); Nelsonville-York Junior High School (math 22% / reading 31%, grade F, #586 of 654 statewide, top 90%, 254 students, 0% FRL); Nelsonville-York High School (math 32% / reading 37%, grade F, #582 of 781 statewide, top 76%, 289 students, 0% FRL) — zoned schools average 0% FRL vs 55% district-wide (55 pts lower); this property's tenant base skews higher-income than the district average.
- Market conditions: 22 active listings in the ZIP; 1 comparable units currently listed for rent nearby; 5 units permitted in Athens County in 2024 (0 in 5+ unit buildings).
- This rent runs 30% of the median local income ($48k/yr) — at the standard rent-burdened threshold; future hikes will face affordability resistance.
Forward outlook
- Local home prices are declining (-3.0%/yr); year-one equity from $642 of loan paydown is wiped out by about $3k of value loss. Plan a longer hold.
- Athens County population projected at +4% by 2050 — modest demand growth; plan on rents tracking national, not racing it.
- At projected returns (-3.0% appreciation + 3.0% rent growth), your $26k cash investment doubles in ~9 years — after that, you're playing with house money.
Negotiation context
- Only 3 days on market — expect competitive offers; lowballing is unlikely to land.
- 3 sale attempts since 7y ago with the ask held roughly flat each time — persistent listings suggest the price (not the market) is what's stuck; bring a comps-based counter.
Risks & watch-outs
- Watch-outs: built in 1900 — expect roof / HVAC / electrical / plumbing capex.
- Climate carrying-cost: major flood risk — expect insurance premiums to compound above CPI over the hold.
Questions for the listing agent
- Built in 1900 — when were the roof, HVAC, electrical panel, plumbing, and water heater last replaced?
- Is there a deadline driving the sale (1031 exchange, divorce, estate, relocation)? That informs how much negotiation room exists.
- Schools are D-rated, which usually means shorter tenancies and higher turnover. Who's the typical renter profile here, and what's been the actual vacancy rate?
- What's the average days-on-market for RENTAL listings here right now (not sales)? A rising rental-DOM trend means longer vacancies and softer asking-rent achievability than the comps imply.
- What's the recent tenant-quality profile in this submarket — average credit score on applications, eviction rate, late-payment / NSF rate, and stable-employment percentage? A property-management company in the area should have these aggregated.
- How much new for-sale + rental construction is in the pipeline within 1–3 miles? Heavy new supply typically softens prices + rents 12–24 months out; constrained supply supports both.
Investment metrics
- 1% rule
- 1.29% ✓
- Cap rate
- 10.22%
- Cash-on-cash
- 14.03%
- DSCR
- 1.62
- GRM
- 6.5
CMA / ARV
- ARV (on-the-fly)
- $170,768
- Comps found
- 12
Show comp detail 12 sales within ~0.75 mi
| Address | Dist | Beds/Ba | Sqft | Sold | Price | $/sf | Match |
|---|---|---|---|---|---|---|---|
| 218 W Franklin St | 0.31mi | 4/2.5 (+1) | 1,632 (-1%) | 6mo | $175,000 | $107 | 72 |
| 30 Short | 0.07mi | 3/1.0 | 1,681 (+2%) | 23mo | $125,000 | $74 | 70 |
| 300 W Washington St | 0.40mi | 3/1.0 | 1,656 (+1%) | 14mo | $90,000 | $54 | 64 |
| 385 W Franklin St | 0.46mi | 3/2.5 | 1,660 (+1%) | 16mo | $176,500 | $106 | 61 |
| 474 Chestnut St | 0.53mi | 4/2.5 (+1) | 1,698 (+3%) | 5mo | $125,000 | $74 | 58 |
| 226 W Columbus St | 0.37mi | 4/1.0 (+1) | 1,536 (-6%) | 9mo | $175,000 | $114 | 56 |
| 391 W Franklin St | 0.47mi | 3/3.0 | 1,548 (-6%) | 15mo | $152,590 | $99 | 52 |
| 669 Poplar St | 0.70mi | 3/2.5 | 1,696 (+3%) | 13mo | $184,500 | $109 | 49 |
| 371 W Franklin St | 0.45mi | 3/1.0 | 1,476 (-10%) | 19mo | $149,000 | $101 | 42 |
| 17071 Riverside Dr | 0.64mi | 3/2.0 | 1,802 (+10%) | 16mo | $315,000 | $175 | 41 |
| 520 W Washington St | 0.59mi | 3/1.0 | 1,488 (-9%) | 19mo | $155,000 | $104 | 37 |
| 419 Washington St | 0.51mi | 4/2.0 (+1) | 1,812 (+10%) | 22mo | $167,000 | $92 | 36 |
Match score weights: distance 35% · size 25% · config 20% · recency 20%. Top-matched comps best support the ARV.
Projected returns pro-forma
-3.0% appreciation · 3.0% rent growth · sell at horizon
- IRR
- 4.3%
- Equity multiple
- 1.17×
- Total profit
- $4,329
- Equity at exit
- $13,852
- IRR
- 13.8%
- Equity multiple
- 2.11×
- Total profit
- $28,782
- Equity at exit
- $8,032
Cash invested: $26,012 (down + closing). Projections, not guarantees.
Landlord ↔ Tenant lean methodology
- Overall (STATE)
- 73 Landlord-Friendly
- State Ohio
- 73 Landlord-Friendly · R+6
- County
- — inherits STATE
- City
- — inherits STATE
ZIP-level market 45764
- Home prices YoY
- -6.8%
- Active inventory
- 22
- Price-to-rent
- 6.5×
Monthly cashflow live
- Estimated rent
- $1,200 medium interval (Pro) →
- Mortgage (P&I)
- −$487
- Tax from tax record
- −$118 /mo · $1,417/yr
- Insurance
- −$39
- HOA
- −$0
- Vacancy / Maint / Mgmt
- −$252
- Net cashflow
- $304
Break-even live
Sensitivity live
| Price | -10% $357 | -5% $330 | +0% $304 | +5% $278 | +10% $251 |
|---|---|---|---|---|---|
| Rent | -10% $209 | -5% $257 | +0% $304 | +5% $351 | +10% $399 |
| Rate | -1.0pp $351 | -0.5pp $328 | base $304 | +0.5pp $280 | +1.0pp $255 |
UW: 25.0% down · 7.5% · 30yr · 1.5% tax · 5.0% vac · 8.0% maint · 8.0% mgmt
Financing live
Cash to close
- Down payment
- $23,225
- Closing costs
- $2,787
- Reserves months
- —
- Total cash needed
- —
Loan-product check · same deal, 3 products live
Conventional
25% down · 7.5% · 30yr
- Down + closing
- —
- Monthly P&I
- —
- Monthly cashflow
- —
- DSCR
- —
- Eligible?
- —
Personal DTI + credit; lowest rate.
DSCR
20% down · 8.5% · 30yr
- Down + closing
- —
- Monthly P&I
- —
- Monthly cashflow
- —
- DSCR
- —
- Eligible?
- —
No personal income docs; deal must DSCR.
Hard money
10% down · 12.0% · 12mo
- Down + closing
- —
- Monthly P&I
- —
- Monthly cashflow
- —
- DSCR
- —
- Eligible?
- —
Short-term bridge; refi at stabilization.
Rent comps 1 comps
| Address | Beds | Baths | Sqft | Rent | $/sqft | DOM | Units | Dist |
|---|---|---|---|---|---|---|---|---|
| 301 Fort St Unit B Nelsonville, OH | 3.0 | 1.0 | 1800 | $1,200 | $0.67 | 25d | 1 | 0.13mi |
Listing history 3 events
-
2026-06-21days on market $92,900 Active 3 DOM
-
2026-06-18remarks 699-char remark
-
2026-06-18$92,900 Active 1 DOM
ⓘ Source: listings_history table (triggers on properties + properties_extension) + one-shot
backfill from property_details.listing_events for pre-trigger history.
Tax reassessment forecast OH · Partial reset (capped growth)
- Current annual tax
- $1,417 · $118/mo
- Projected year-2 tax
- $1,433 · $119/mo
- Expected delta
- +$16/yr (+$1/mo · 1.1%)
ⓘ Screening estimate from a state-policy table — verify with the county assessor before closing.
Climate risk First Street
- Flood 6/10 Major FEMA zone X (unshaded) · 53% chance over 30 yrs
- Wildfire 3/10 Moderate
- Heat 4/10 Moderate 7 d/yr ≥100°F today · 19 d/yr by 30 yrs out
- Wind 2/10 Low 100% chance of damaging wind over 30 yrs
- Air quality 2/10 Low 0 unhealthy d/yr today · 1 by 30 yrs out
Nearby sold comps map
Loading sold comps map…
Walkable amenities ~0.75 mi
Loading nearby amenities…
Taxation est. · year 1
- Rental income
- $14,400
- − Mortgage interest
- −$5,204
- − Property taxes
- −$1,417
- − Insurance
- −$464
- − Repairs & maintenance
- −$1,152
- − Management
- −$1,152
- − Depreciation
- −$2,703
- Taxable income
- $2,308
- Est. tax owed @ 24.0%
- −$554
- After-tax cash flow
- $3,094/yr
For passive investors: Depreciation is non-cash, so a rental often shows a tax loss while cash-flowing — sheltering income. Rental losses are passive: they offset passive income freely, and up to $25,000/yr can offset ordinary (W-2) income if you actively participate and your MAGI is under $100k (phasing out to $0 by $150k); unused losses carry forward. On sale, claimed depreciation is recaptured at up to 25%, and gains may owe capital-gains tax (a 1031 exchange can defer both). Figures are a year-1 estimate at your 24.0% rate — not tax advice; consult a CPA.
Schools (NCES district)
- District
- Nelsonville-York City
- NCES district ID
- 3904444
- Math proficiency
- 31% ▼ -11.00%
- Reading proficiency
- 35% ▼ -15.00%
- Median HH income
- $29,199
- Composite
- 26.7/100
- National rank
- #7155
- State rank
- #572 of 656 in OH
Livability — Nelsonville
- Score
- 65/100
- State rank
- #750
- US rank
- #13547
Category grades
Schools grade is shown separately in the Schools card above.
Census & demographics
- Census place
- Nelsonville, OH
- County
- Athens · 60,466 people
- Population (ZIP)
- 7,548
- Household income
- $47,978
- Rent vs Own
- Severe rent burden
- 6.7
Population outlook (Athens County) Hauer SSP2
- Today (2025)
- 71,867 people
- By 2030
- 73,556 · +2.4%
- By 2040
- 74,528 · +3.7%
- By 2050
- 74,947 · +4.3%
- By 2075
- 77,996 · +8.5%
- By 2100
- 81,619 · +13.6%
Race, ethnicity, and origin ACS 2023
- Neighborhood character
- Predominantly White (92%)
- Race & ethnicity
- White 92% Black 3% Two or more races 3% Hispanic / Latino 2%
- Common ancestry
- Iranian 3% Slovak 2% Romanian 2%
- Foreign-born
- 0%
Political lean MEDSL · Athens
- 2024 margin
- D (+10.8) · D 54.9% · R 44.2%
- 2008→2024 swing
- -24.5pp toward R · 2008: 35.3pp · 2024: 10.8pp
- All cycles
- 2024: D+10.8 2020: D+15.0 2016: D+16.9 2012: D+35.0 2008: D+35.3
Not yet ingested
- Civics
- —
Market trends
- HPI YoY
- ▼ -15.72%
- Current HPI
- 217.2268
- Rent YoY
- —
- Metro
- —
- State GDP YoY
- ▲ 1.98%
- F500 in state
- 48
Industry mix (Fortune 500 HQ in OH)
| Industry | F500 HQs | Revenue |
|---|---|---|
| Insurance | 3 | $145B |
|
||
| Industrial Machinery | 3 | $49B |
|
||
| Financial Services | 3 | $24B |
|
||
| Consumer Goods | 2 | $93B |
|
||
| Aerospace / Defense | 2 | $47B |
|
||
| Utilities | 2 | $33B |
|
||
Price history
+9.4% since first listed9 events — show timeline
- 2026-06-16 Listed $92,900 ACBOR
- 2026-04-27 Sold (Public Records) $82,000 Public Records
- 2019-12-20 Listed $84,900 ACBOR
- 2019-12-18 Sold (Public Records) $84,900 Public Records
- 2019-12-12 Listing Removed — CBRMLS
- 2019-12-11 Sold (MLS) $84,900 ACBOR
- 2019-12-11 Sold (MLS) $84,900 CBRMLS
- 2019-11-01 Contingent — CBRMLS
- 2019-10-27 Listed $84,900 CBRMLS
Property tax history
+9.2%/yrLatest (2025): $1,417 · +2.4% YoY. Source: county tax records.
Cash-flow waterfall
monthlySold comps — $/sqft
last 12 mo · ≤1 miLoading sold comps…