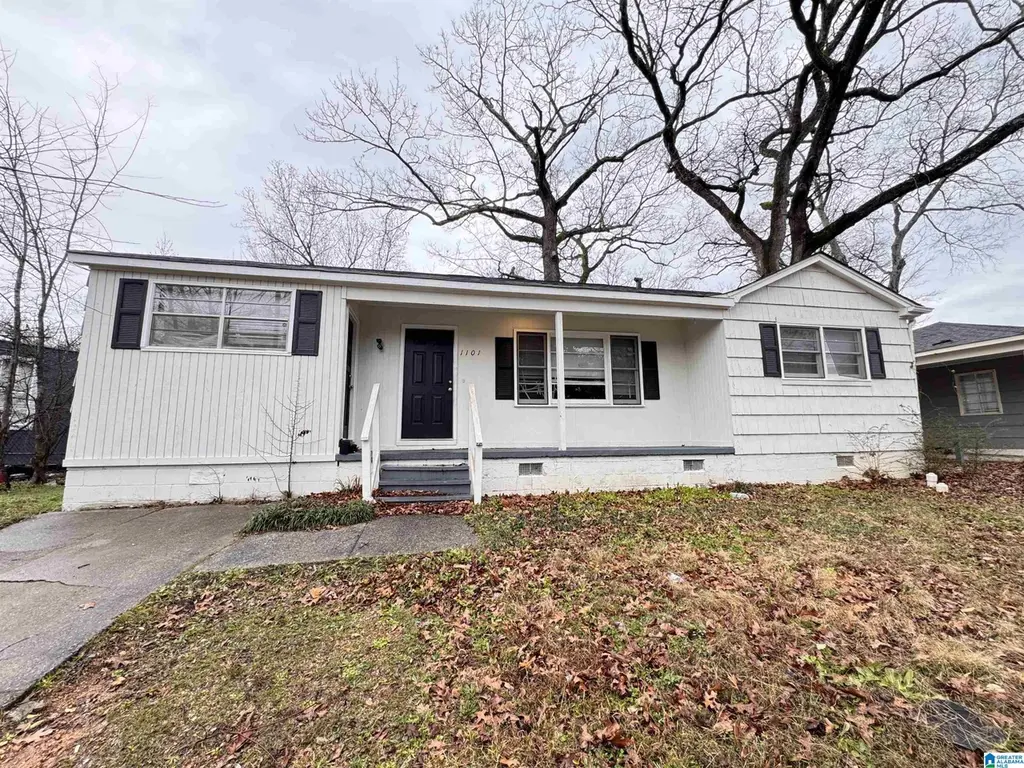
1101 Carol Cir · Midfield, AL
Flood risk 1/10 · Minimal
- FEMA flood zone
- X (unshaded)
- Chance of flooding over 30 yrs
- 0.0%
- Est. flood insurance / yr
- $473 – $860
Fire risk 1/10 · Minimal
- Est. fire insurance / yr
- $916 – $1,700
Heat risk 6/10 · Moderate
- Hot days now (above 108°F)
- 7 days/yr
- Hot days in 30 yrs
- 18 days/yr
Wind risk 6/10 · Moderate
- Chance of severe wind over 30 yrs
- 27.0%
Air-quality risk 3/10 · Minor
- Unhealthy air days now
- 2 days/yr
- Unhealthy air days in 30 yrs
- 5 days/yr
Risk factors via First Street. Map © Google.
Why this score? — see what drove the C grade
The composite is a weighted blend of 9 inputs, each scored 0–100. Each bar is that input's sub-score; the figure is the points it added to the 100-point composite (weight × sub-score).
- Cash flow +27.7/30.0
- DSCR +9.8/10.0
- 1% rule +7.5/10.0
- Livability +3.2/5.0
- Appreciation +2.6/10.0
- Condition / age +2.5/5.0
- Rent growth +2.1/5.0
- Schools +0.7/10.0
- ARV discount +0.0/15.0
$99,000
🖨 Deal sheet 📄 Offer letter ✓ Due diligence
Listing remarks MLS
Solid investment opportunity in Midfield on a quiet, established street with strong long-term upside. The property will benefit from a turnover refresh before placing the next tenant, making it a great option for buyers looking to add value through light updates. Similar properties with comparable features have shown rental potential of up to $1,000 per month, offering attractive cash flow possibilities. Convenient location with quick access to Birmingham, shopping, and major roadways adds to the appeal for both tenants and future resale.
Key facts
- Major roadways
- Shopping
- Light updates
Tags
Neighborhood map
What this means for you Summary
Snapshot
- This is a 3-bed/1.0-bath single-family listed at $99k.
Deal economics
- At list price, monthly cash flow is $299 ($4k/yr) — positive.
- The deal already cash-flows at list — no discount required.
- Meets the 1% rule at list price ($1k rent vs $99k).
- Recommended offer: $93k (6.0% below list) — sets the bar for market timing.
Location & tenants
- Location reads 64/100 on livability (#164 in AL) — a middle-class / working-renter tenant base. Strengths: commute A+, cost of living A+, housing A+; Watch: schools F, amenities F, employment F.
- Midfield City (suburban): math 2% / reading 14% proficiency, ranked #126 of 129 in AL (top 98%) — low school quality limits family demand, transient renter base, plan for 1-2y turnover; 83% free/reduced lunch — lower-income household profile, screen leases tightly.
- Market conditions: Rents soft (-1.5%/yr); 87 active listings in the ZIP; 35 comparable units currently listed for rent nearby; rentals at typical pace (median 16d on market — plan ~3-4 weeks tenant-placement turnaround); 2,114 units permitted in Jefferson County in 2024 (556 in 5+ unit buildings).
Forward outlook
- Local home prices are declining (-3.0%/yr); year-one equity from $684 of loan paydown is wiped out by about $3k of value loss. Plan a longer hold.
- Jefferson County population projected to shrink 4% by 2050 — rents likely to lag national; underwrite the cash flow, not the appreciation.
Negotiation context
- It's been on market 65 days — a 6% lower offer ($93k) is reasonable based on typical stale-listing flexibility.
- 4 sale attempts since 11y ago; this cycle's ask has dropped $6k (6%) from the opening price — seller is motivated, your offer sets the floor, not the list.
- Current owner paid $75k; 32% above their basis — modest negotiation headroom, anchor on the comps not their cost.
Risks & watch-outs
- Watch-outs: built in 1958 — expect roof / HVAC / electrical / plumbing capex.
- Climate carrying-cost: major wind risk, 27% chance of damaging wind over 30y; extreme-heat days projected 7→18/yr by 2055 (HVAC capex compounding) — expect insurance premiums to compound above CPI over the hold.
Questions for the listing agent
- It's been on market 65 days. Have you received any prior offers? Is the seller open to a 6% concession, seller financing, or rate buy-down credit?
- Built in 1958 — when were the roof, HVAC, electrical panel, plumbing, and water heater last replaced?
- Why hasn't it sold? Are there any deal-killer items the seller is aware of (foundation, flood, title, zoning, code violations)?
- Is there a deadline driving the sale (1031 exchange, divorce, estate, relocation)? That informs how much negotiation room exists.
- Schools are F-rated, which usually means shorter tenancies and higher turnover. Who's the typical renter profile here, and what's been the actual vacancy rate?
- What's the average days-on-market for RENTAL listings here right now (not sales)? A rising rental-DOM trend means longer vacancies and softer asking-rent achievability than the comps imply.
- What's the recent tenant-quality profile in this submarket — average credit score on applications, eviction rate, late-payment / NSF rate, and stable-employment percentage? A property-management company in the area should have these aggregated.
- How much new for-sale + rental construction is in the pipeline within 1–3 miles? Heavy new supply typically softens prices + rents 12–24 months out; constrained supply supports both.
Investment metrics
- 1% rule
- 1.25% ✓
- Cap rate
- 9.92%
- Cash-on-cash
- 12.96%
- DSCR
- 1.58
- GRM
- 6.7
CMA / ARV
- ARV (median comp)
- $74,892
- List price
- $99,000
- Delta
- 32.19%
- Verdict
- OVERPRICED
- Comps
- 20 within 1.0 mi
Show comp detail 12 sales within ~0.75 mi
| Address | Dist | Beds/Ba | Sqft | Sold | Price | $/sf | Match |
|---|---|---|---|---|---|---|---|
| 1120 9th Ave | 0.22mi | 3/1.0 | 1,437 (+4%) | 1mo | $72,900 | $51 | 83 |
| 703 11th Ave | 0.26mi | 4/1.0 (+1) | 1,302 (-6%) | 1mo | $80,000 | $61 | 72 |
| 1117 Carol Cir | 0.05mi | 4/1.5 (+1) | 1,504 (+8%) | 8mo | $45,000 | $30 | 70 |
| 1221 Carol Cir | 0.13mi | 3/1.0 | 1,200 (-14%) | 2mo | $75,000 | $63 | 70 |
| 617 8th Ave | 0.39mi | 4/2.0 (+1) | 1,436 (+4%) | 3mo | $85,000 | $59 | 64 |
| 812 7th Ave | 0.40mi | 3/2.0 | 1,319 (-5%) | 7mo | $179,000 | $136 | 63 |
| 1010 7th Ave | 0.38mi | 3/2.0 | 1,321 (-5%) | 11mo | $57,000 | $43 | 61 |
| 5209 Mcclain St | 0.21mi | 2/1.0 (-1) | 1,217 (-12%) | 12mo | $25,000 | $21 | 54 |
| 1545 Carol Cir | 0.22mi | 3/1.5 | 1,184 (-15%) | 11mo | $85,000 | $72 | 54 |
| 503 8th Ave | 0.46mi | 3/2.0 | 1,218 (-12%) | 0mo | $75,000 | $62 | 54 |
| 828 Westfield Dr | 0.71mi | 4/1.5 (+1) | 1,424 (+3%) | 12mo | $144,000 | $101 | 45 |
| 716 Westfield Dr | 0.73mi | 3/1.5 | 1,541 (+11%) | 10mo | $155,000 | $101 | 37 |
Match score weights: distance 35% · size 25% · config 20% · recency 20%. Top-matched comps best support the ARV.
Projected returns pro-forma
-3.0% appreciation · 0.0% rent growth · sell at horizon
- IRR
- -0.6%
- Equity multiple
- 0.98×
- Total profit
- $-578
- Equity at exit
- $14,761
- IRR
- 5.7%
- Equity multiple
- 1.37×
- Total profit
- $10,132
- Equity at exit
- $8,560
Cash invested: $27,720 (down + closing). Projections, not guarantees.
Landlord ↔ Tenant lean methodology
- Overall (STATE)
- 90 Strongly Landlord-Friendly
- State Alabama
- 90 Strongly Landlord-Friendly · R+15
- County
- — inherits STATE
- City
- — inherits STATE
ZIP-level market 35228
- Home prices YoY
- -3.5%
- Rents YoY
- -1.5%
- Active inventory
- 87
- Price-to-rent
- 6.7×
Monthly cashflow live
- Estimated rent
- $1,233 high interval (Pro) →
- Mortgage (P&I)
- −$519
- Tax from tax record
- −$114 /mo · $1,373/yr
- Insurance
- −$41
- HOA
- −$0
- Vacancy / Maint / Mgmt
- −$259
- Net cashflow
- $299
Break-even live
UW: 25.0% down · 7.5% · 30yr · 1.5% tax · 5.0% vac · 8.0% maint · 8.0% mgmt
Financing live
Cash to close
- Down payment
- $24,750
- Closing costs
- $2,970
- Reserves months
- —
- Total cash needed
- —
Loan-product check · same deal, 3 products live
Conventional
25% down · 7.5% · 30yr
- Down + closing
- —
- Monthly P&I
- —
- Monthly cashflow
- —
- DSCR
- —
- Eligible?
- —
Personal DTI + credit; lowest rate.
DSCR
20% down · 8.5% · 30yr
- Down + closing
- —
- Monthly P&I
- —
- Monthly cashflow
- —
- DSCR
- —
- Eligible?
- —
No personal income docs; deal must DSCR.
Hard money
10% down · 12.0% · 12mo
- Down + closing
- —
- Monthly P&I
- —
- Monthly cashflow
- —
- DSCR
- —
- Eligible?
- —
Short-term bridge; refi at stabilization.
Rent comps 35 comps
| Address | Beds | Baths | Sqft | Rent | $/sqft | DOM | Units | Dist |
|---|---|---|---|---|---|---|---|---|
| 1109 12th Ave Birmingham, AL | 4.0 | 2.0 | 1217 | $1,475 | $1.21 | 3d | 1 | 0.05mi |
| 806 12th Ave Birmingham, AL | 3.0 | 1.0 | 1262 | $1,075 | $0.85 | 43d | 1 | 0.15mi |
| 832 Alden Ave Birmingham, AL | 4.0 | 2.0 | 1231 | $1,150 | $0.93 | 23d | 1 | 0.26mi |
| 603 11th Ave Birmingham, AL | 3.0 | 1.0 | 1289 | $1,100 | $0.85 | 43d | 1 | 0.29mi |
| 605 10th Ave Birmingham, AL | 3.0 | 1.0 | 1060 | $850 | $0.80 | 43d | 1 | 0.31mi |
| 1401 9th Ave Birmingham, AL | 3.0 | 2.0 | 1222 | $1,200 | $0.98 | 43d | 1 | 0.32mi |
| 1206 15th St Birmingham, AL | 3.0 | 1.0 | 1600 | $950 | $0.59 | 43d | 1 | 0.36mi |
| 617 8th Ave Birmingham, AL | 4.0 | 2.0 | 1436 | $1,350 | $0.94 | 1d | 1 | 0.37mi |
| 616 Rutledge Dr Birmingham, AL | 3.0 | 1.0 | 1416 | $1,095 | $0.77 | 21d | 1 | 0.47mi |
| 801 Rutledge Dr Birmingham, AL | 4.0 | 2.0 | 1808 | $1,600 | $0.88 | 1d | 1 | 0.57mi |
| 608 5th Ave Midfield, AL | 3.0 | 1.0 | 1241 | $795 | $0.64 | 21d | 1 | 0.58mi |
| 80 Wilkes Cir Birmingham, AL | 4.0 | 2.0 | 1078 | $1,200 | $1.11 | 14d | 1 | 0.72mi |
| 63 Wilkes Cir Unit 1 Birmingham, AL | 4.0 | 1.0 | 1164 | $1,250 | $1.07 | 43d | 1 | 0.76mi |
| 63 Wilkes Cir Birmingham, AL | 4.0 | 1.0 | 1164 | $1,200 | $1.03 | 43d | 1 | 0.76mi |
| 4506 Letson St Brighton, AL | 3.0 | 2.0 | 1032 | $1,200 | $1.16 | 23d | 1 | 0.87mi |
| 733 Glen Ridge Dr Fairfield, AL | 3.0 | 1.0 | 1225 | $1,378 | $1.12 | 1d | 1 | 0.96mi |
| 1254 Lewis St Brighton, AL | 3.0 | 1.0 | 1200 | $850 | $0.71 | 43d | 1 | 0.96mi |
| 222 4th Ave Birmingham, AL | 3.0 | 1.0 | 1300 | $1,050 | $0.81 | 43d | 1 | 0.98mi |
| 800 Fairfax Dr Fairfield, AL | 4.0 | 2.0 | 1200 | $1,650 | $1.38 | 1d | 1 | 0.99mi |
| 226 3rd Ave Birmingham, AL | 4.0 | 2.0 | 1248 | $1,300 | $1.04 | 43d | 1 | 1.05mi |
| 925 Woodward Rd Birmingham, AL | 2.0 | 2.0 | 1104 | $950 | $0.86 | 43d | 1 | 1.11mi |
| 923 Woodward Rd Birmingham, AL | 3.0 | 1.0 | 1273 | $1,200 | $0.94 | 23d | 1 | 1.11mi |
| 200 Woodward Dr Bessemer, AL | 3.0 | 1.0 | 900 | $1,123 | $1.25 | 2d | 1 | 1.15mi |
| 412 Fairfax Dr Unit 424-3 Fairfield, AL | 3.0 | 1.5 | 1035 | $1,200 | $1.16 | 10d | 1 | 1.17mi |
| 412 Fairfax Dr Unit 436-11 Fairfield, AL | 2.0 | 1.5 | 935 | $910 | $0.97 | 10d | 1 | 1.17mi |
| 412 Fairfax Dr Unit 400-12 Fairfield, AL | 2.0 | 1.0 | 888 | $915 | $1.03 | 10d | 1 | 1.17mi |
| 412 Fairfax Dr Unit 436-10 Fairfield, AL | 2.0 | 1.0 | 888 | $890 | $1.00 | 10d | 1 | 1.17mi |
| 412 Fairfax Dr Unit 444-12 Fairfield, AL | 2.0 | 1.0 | 888 | $910 | $1.02 | 10d | 1 | 1.17mi |
| 412 Fairfax Dr Unit 424-10 Fairfield, AL | 3.0 | 1.5 | 1035 | $1,275 | $1.23 | 11d | 1 | 1.17mi |
| 412 Fairfax Dr Unit 400-1 Fairfield, AL | 2.0 | 1.5 | 935 | $1,175 | $1.26 | 3d | 1 | 1.17mi |
| 412 Fairfax Dr Unit 416-11 Fairfield, AL | 2.0 | 1.5 | 935 | $975 | $1.04 | 3d | 1 | 1.17mi |
| 1565 Miles St Dolomite, AL | 3.0 | 2.0 | 1120 | $1,175 | $1.05 | 16d | 1 | 1.19mi |
| 216 Pine St Bessemer, AL | 3.0 | 2.0 | 1000 | $1,200 | $1.20 | 43d | 1 | 1.28mi |
| 1983 Townhouse Ln Bessemer, AL | 2.0 | 2.0 | 1465 | $1,100 | $0.75 | 16d | 1 | 1.42mi |
| 520 Brewer Dr Bessemer, AL | 3.0 | 1.0 | 1040 | $1,100 | $1.06 | 3d | 1 | 1.43mi |
Listing history 30 events
-
2026-06-18days on market $99,000 Active 65 DOM
-
2026-06-17days on market $99,000 Active 64 DOM
-
2026-06-16days on market $99,000 Active 63 DOM
-
2026-06-15days on market $99,000 Active 62 DOM
-
2026-06-13days on market $99,000 Active 60 DOM
-
2026-06-13days on market $99,000 Active 59 DOM
-
2026-06-10days on market $99,000 Active 57 DOM
-
2026-06-09days on market $99,000 Active 56 DOM
-
2026-06-08days on market $99,000 Active 55 DOM
-
2026-06-07days on market $99,000 Active 54 DOM
-
2026-06-05days on market $99,000 Active 51 DOM
-
2026-06-03days on market $99,000 Active 50 DOM
-
2026-06-02pricedays on market $99,000 Active 49 DOM
-
2026-06-01days on market $105,000 Active 48 DOM
-
2026-05-31days on market $105,000 Active 47 DOM
-
2026-04-14$105,000 Active 544-char remark
Show marketing remark (544 chars)
Solid investment opportunity in Midfield on a quiet, established street with strong long-term upside. The property will benefit from a turnover refresh before placing the next tenant, making it a great option for buyers looking to add value through light updates. Similar properties with comparable features have shown rental potential of up to $1,000 per month, offering attractive cash flow possibilities. Convenient location with quick access to Birmingham, shopping, and major roadways adds to the appeal for both tenants and future resale.
-
2022-03-28soldstatus $75,000
-
2022-03-25soldstatus $75,000 Sold 168-char remark
Show marketing remark (168 chars)
Great investment property in midfield. Located on a street in nice area. this property is a good opportunity to cashflow in the Birmingham Market. Monthly rent is $850.
-
2022-02-16historical Contingent 168-char remark
Show marketing remark (168 chars)
Great investment property in midfield. Located on a street in nice area. this property is a good opportunity to cashflow in the Birmingham Market. Monthly rent is $850.
-
2022-01-27$75,000 Active 168-char remark
Show marketing remark (168 chars)
Great investment property in midfield. Located on a street in nice area. this property is a good opportunity to cashflow in the Birmingham Market. Monthly rent is $850.
-
2020-09-10soldstatus $62,500
-
2020-07-30soldstatus $62,500 Sold
-
2020-06-22historical Contingent
-
2020-06-08$65,900 Active
-
2015-12-17soldstatus $59,900 Sold
-
2015-10-30Contingent
-
2001-08-15soldstatus $67,600
-
1996-01-11soldstatus $45,900
-
1995-12-01soldstatus $45,900
-
1989-08-01soldstatus $42,500
ⓘ Source: listings_history table (triggers on properties + properties_extension) + one-shot
backfill from property_details.listing_events for pre-trigger history.
Tax reassessment forecast AL · Resets to sale price
- Current annual tax
- $1,373 · $114/mo
- Projected year-2 tax
- $1,373 · $114/mo
- Expected delta
- $0/yr ($0/mo · 0.0%)
ⓘ Screening estimate from a state-policy table — verify with the county assessor before closing.
Climate risk First Street
- Flood 1/10 Low FEMA zone X (unshaded) · 0% chance over 30 yrs
- Wildfire 1/10 Low
- Heat 6/10 Major 7 d/yr ≥108°F today · 18 d/yr by 30 yrs out
- Wind 6/10 Major 27% chance of damaging wind over 30 yrs
- Air quality 3/10 Moderate 2 unhealthy d/yr today · 5 by 30 yrs out
Nearby sold comps map
Loading sold comps map…
Walkable amenities ~0.75 mi
Loading nearby amenities…
Taxation est. · year 1
- Rental income
- $14,797
- − Mortgage interest
- −$5,546
- − Property taxes
- −$1,373
- − Insurance
- −$495
- − Repairs & maintenance
- −$1,184
- − Management
- −$1,184
- − Depreciation
- −$2,880
- Taxable income
- $2,136
- Est. tax owed @ 24.0%
- −$513
- After-tax cash flow
- $3,079/yr
For passive investors: Depreciation is non-cash, so a rental often shows a tax loss while cash-flowing — sheltering income. Rental losses are passive: they offset passive income freely, and up to $25,000/yr can offset ordinary (W-2) income if you actively participate and your MAGI is under $100k (phasing out to $0 by $150k); unused losses carry forward. On sale, claimed depreciation is recaptured at up to 25%, and gains may owe capital-gains tax (a 1031 exchange can defer both). Figures are a year-1 estimate at your 24.0% rate — not tax advice; consult a CPA.
Schools (NCES district)
- District
- Midfield City
- NCES district ID
- 0102350
- Math proficiency
- 2% ▼ -18.00%
- Reading proficiency
- 14% ▼ -5.00%
- Median HH income
- $39,267
- Composite
- 6.89/100
- National rank
- #9978
- State rank
- #126 of 129 in AL
Livability — Midfield
- Score
- 64/100
- State rank
- #164
- US rank
- #14536
Category grades
Schools grade is shown separately in the Schools card above.
Census & demographics
- Census place
- Midfield, AL
- County
- Jefferson County · 527,445 people
- City population
- 10,216
- Metro
- Birmingham-Hoover, AL
- Population (ZIP)
- 10,216
- Household income
- $50,815
- Rent vs Own
- Severe rent burden
- 456.0
Population outlook (Jefferson County) Hauer SSP2
- Today (2025)
- 669,185 people
- By 2030
- 669,694 · +0.1%
- By 2040
- 661,388 · -1.2%
- By 2050
- 643,086 · -3.9%
- By 2075
- 577,267 · -13.7%
- By 2100
- 474,758 · -29.1%
Race, ethnicity, and origin ACS 2023
- Neighborhood character
- Predominantly Black (89%)
- Race & ethnicity
- Black 89% Hispanic / Latino 5% Two or more races 5% White 5%
- Foreign-born
- 2% · Canada
- Languages at home
- 95% English-only · Spanish 5%
Political lean MEDSL · Jefferson
- 2024 margin
- D (+10.4) · D 54.6% · R 44.2% · Other 1.2%
- 2008→2024 swing
- +5.4pp toward D · 2008: 5.1pp · 2024: 10.4pp
- All cycles
- 2024: D+10.4 2020: D+13.2 2016: D+7.2 2012: D+6.0 2008: D+5.1
Not yet ingested
- Civics
- —
Market trends
- HPI YoY
- ▼ -4.84%
- Current HPI
- 134.8633
- Rent YoY
- ▼ -1.47%
- Metro
- Birmingham-Hoover, AL
- State GDP YoY
- ▲ 2.94%
- F500 in state
- 4
Industry mix (Fortune 500 HQ in AL)
| Industry | F500 HQs | Revenue |
|---|---|---|
| Financial Services | 1 | $8B |
|
||
| Healthcare | 1 | $5B |
|
||
Price history
+147.1% since first listed15 events — show timeline
- 2026-04-14 Listed $105,000 Greater Alabama MLS
- 2022-03-28 Sold (Public Records) $75,000 Public Records
- 2022-03-25 Sold (MLS) $75,000 Greater Alabama MLS
- 2022-02-16 Contingent — Greater Alabama MLS
- 2022-01-27 Listed $75,000 Greater Alabama MLS
- 2020-09-10 Sold (Public Records) $62,500 Public Records
- 2020-07-30 Sold (MLS) $62,500 Greater Alabama MLS
- 2020-06-22 Contingent — Greater Alabama MLS
- 2020-06-08 Listed $65,900 Greater Alabama MLS
- 2015-12-17 Sold (MLS) $59,900 Greater Alabama MLS
- 2015-10-30 Listed — Greater Alabama MLS
- 2001-08-15 Sold (Public Records) $67,600 Public Records
- 1996-01-11 Sold (Public Records) $45,900 Public Records
- 1995-12-01 Sold (Public Records) $45,900 Public Records
- 1989-08-01 Sold (Public Records) $42,500 Public Records
Property tax history
+9.2%/yrLatest (2025): $1,373 · +0.0% YoY. Source: county tax records.
Cash-flow waterfall
monthlySold comps — $/sqft
last 12 mo · ≤1 miLoading sold comps…