945 San Ildefonso Road Rd #73 · Los Alamos, NM
Flood risk 1/10 · Minimal
- FEMA flood zone
- X (unshaded)
- Chance of flooding over 30 yrs
- 0.0%
- Est. flood insurance / yr
- $507 – $1,088
Fire risk 5/10 · Moderate
- Est. fire insurance / yr
- $706 – $1,312
Heat risk 2/10 · Minimal
- Hot days now (above 88°F)
- 6 days/yr
- Hot days in 30 yrs
- 16 days/yr
Wind risk 1/10 · Minimal
- Chance of severe wind over 30 yrs
- —
Air-quality risk 6/10 · Moderate
- Unhealthy air days now
- 11 days/yr
- Unhealthy air days in 30 yrs
- 13 days/yr
Risk factors via First Street. Map © Google.
Why this score? — see what drove the B grade
The composite is a weighted blend of 9 inputs, each scored 0–100. Each bar is that input's sub-score; the figure is the points it added to the 100-point composite (weight × sub-score).
- Cash flow +30.0/30.0
- 1% rule +10.0/10.0
- DSCR +10.0/10.0
- ARV discount +7.5/15.0
- Schools +6.4/10.0
- Livability +4.0/5.0
- Rent growth +2.5/5.0
- Condition / age +2.5/5.0
- Appreciation +0.0/10.0
$96,000
🖨 Deal sheet 📄 Offer letter ✓ Due diligence
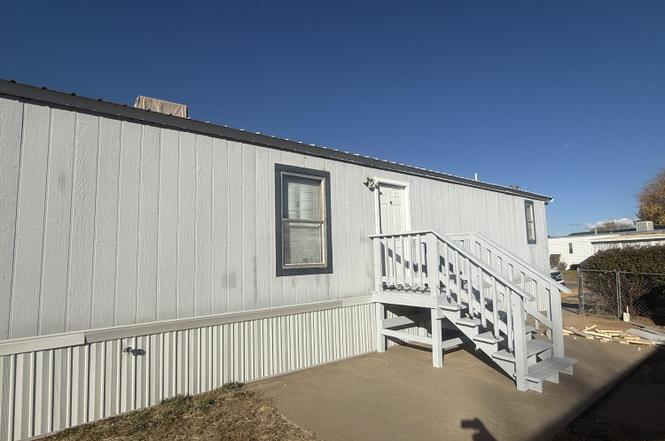
Listing remarks
Nice manufactured home is a quiet location ready to occupy. Fully fenced yard. . 3 bedrooms, 2 full bathrooms. Gas stove range. Washer & Dryer included. Metal roof, new skirting. Evaporative cooling. New entry steps and deck. Carpet and engineered wood flooring. Two storage sheds.
Key facts
- Gas stove range
- Metal roof
- New skirting
Tags
Neighborhood map
What this means for you Summary
Snapshot
- This is a 3-bed/2.0-bath manufactured listed at $96k.
Deal economics
- At list price, monthly cash flow is $2k ($20k/yr) — positive.
- The deal already cash-flows at list — no discount required.
- Meets the 1% rule at list price ($3k rent vs $96k).
- Recommended offer: $87k (9.0% below list) — sets the bar for market timing.
Location & tenants
- Location reads 81/100 on livability (#2 in NM, #1,377 nationally) — a professional / high-income tenant draw. Strengths: crime A+, employment A+, housing A+; Watch: amenities F, commute F.
- Los Alamos Public Schools (town): math 61% / reading 78% proficiency, ranked #2 of 29 in NM (top 7%) — acceptable for families but not a draw, mixed tenant base, ~2y average lease; only 10% free/reduced lunch — higher-income household profile.
- Market conditions: 49 active listings in the ZIP; 4 comparable units currently listed for rent nearby; rentals at typical pace (median 20d on market — plan ~3-4 weeks tenant-placement turnaround); high-income renter base; 14 units permitted in Los Alamos County in 2024 (0 in 5+ unit buildings).
Forward outlook
- Local home prices are declining (-3.0%/yr); year-one equity from $664 of loan paydown is wiped out by about $3k of value loss. Plan a longer hold.
- Los Alamos County population projected at +12% by 2050 — modest demand growth; plan on rents tracking national, not racing it.
- At projected returns (-3.0% appreciation + 3.0% rent growth), your $27k cash investment doubles in ~2 years — after that, you're playing with house money.
Negotiation context
- It's been on market 116 days — a 9% lower offer ($87k) is reasonable based on typical stale-listing flexibility.
Risks & watch-outs
- Climate carrying-cost: moderate wildfire risk — expect insurance premiums to compound above CPI over the hold.
Questions for the listing agent
- It's been on market 116 days. Have you received any prior offers? Is the seller open to a 9% concession, seller financing, or rate buy-down credit?
- Why hasn't it sold? Are there any deal-killer items the seller is aware of (foundation, flood, title, zoning, code violations)?
- Is there a deadline driving the sale (1031 exchange, divorce, estate, relocation)? That informs how much negotiation room exists.
- Schools are B-rated — typically a magnet for longer-tenancy family renters. What's the average tenant stay here, and is there a school-zone premium baked into asking?
- What's the average days-on-market for RENTAL listings here right now (not sales)? A rising rental-DOM trend means longer vacancies and softer asking-rent achievability than the comps imply.
- What's the recent tenant-quality profile in this submarket — average credit score on applications, eviction rate, late-payment / NSF rate, and stable-employment percentage? A property-management company in the area should have these aggregated.
- How much new for-sale + rental construction is in the pipeline within 1–3 miles? Heavy new supply typically softens prices + rents 12–24 months out; constrained supply supports both.
Investment metrics
- 1% rule
- 3.07% ✓
- Cap rate
- 27.12%
- Cash-on-cash
- 74.39%
- DSCR
- 4.31
- GRM
- 2.7
CMA / ARV
- ARV (on-the-fly)
- $96,000
- Comps found
- 1
Show comp detail 1 sale within ~0.75 mi
| Address | Dist | Beds/Ba | Sqft | Sold | Price | $/sf | Match |
|---|---|---|---|---|---|---|---|
| 945 San Ildefonso Road Rd #73 | 0.00mi | 3/2.0 | 1,280 (0%) | 1mo | $96,000 | $75 | 99 |
Match score weights: distance 35% · size 25% · config 20% · recency 20%. Top-matched comps best support the ARV.
Projected returns pro-forma
-3.0% appreciation · 3.0% rent growth · sell at horizon
- IRR
- 74.2%
- Equity multiple
- 4.37×
- Total profit
- $90,616
- Equity at exit
- $14,314
- IRR
- 78.0%
- Equity multiple
- 9.03×
- Total profit
- $215,744
- Equity at exit
- $8,300
Cash invested: $26,880 (down + closing). Projections, not guarantees.
Landlord ↔ Tenant lean methodology
- Overall (STATE)
- 55 Moderately Landlord-Leaning
- State New Mexico
- 55 Moderately Landlord-Leaning · D+3
- County
- — inherits STATE
- City
- — inherits STATE
ZIP-level market 87544
- Active inventory
- 49
- Price-to-rent
- 2.7×
Monthly cashflow live
- Estimated rent
- $2,949 medium interval (Pro) →
- Mortgage (P&I)
- −$503
- Tax est. 1.5%
- −$120 /mo · $1,440/yr
- Insurance
- −$40
- HOA
- −$0
- Vacancy / Maint / Mgmt
- −$619
- Net cashflow
- $1,666
Break-even live
UW: 25.0% down · 7.5% · 30yr · 1.5% tax · 5.0% vac · 8.0% maint · 8.0% mgmt
Financing live
Cash to close
- Down payment
- $24,000
- Closing costs
- $2,880
- Reserves months
- —
- Total cash needed
- —
Loan-product check · same deal, 3 products live
Conventional
25% down · 7.5% · 30yr
- Down + closing
- —
- Monthly P&I
- —
- Monthly cashflow
- —
- DSCR
- —
- Eligible?
- —
Personal DTI + credit; lowest rate.
DSCR
20% down · 8.5% · 30yr
- Down + closing
- —
- Monthly P&I
- —
- Monthly cashflow
- —
- DSCR
- —
- Eligible?
- —
No personal income docs; deal must DSCR.
Hard money
10% down · 12.0% · 12mo
- Down + closing
- —
- Monthly P&I
- —
- Monthly cashflow
- —
- DSCR
- —
- Eligible?
- —
Short-term bridge; refi at stabilization.
Rent comps 4 comps
| Address | Beds | Baths | Sqft | Rent | $/sqft | DOM | Units | Dist |
|---|---|---|---|---|---|---|---|---|
| 340 Rim Rd Unit 340-B Los Alamos, NM | 2.0 | 1.0 | 1460 | $3,500 | $2.40 | 10d | 1 | 0.66mi |
| 55 Verde Ridge St Unit B Los Alamos, NM | 2.0 | 1.5 | 1134 | $2,400 | $2.12 | 19d | 1 | 0.91mi |
| 1300 Iris St #203 Los Alamos, NM | 2.0 | 2.0 | 1000 | $2,400 | $2.40 | 19d | 1 | 1.11mi |
| 1926 24th St Los Alamos, NM | 2.0 | 1.0 | 900 | $1,920 | $2.13 | 2d | 1 | 1.37mi |
Listing history 3 events
-
2026-03-27status Pending
-
2026-02-11price $96,000
-
2025-11-24$110,000 Active
ⓘ Source: listings_history table (triggers on properties + properties_extension) + one-shot
backfill from property_details.listing_events for pre-trigger history.
Climate risk First Street
- Flood 1/10 Low FEMA zone X (unshaded) · 0% chance over 30 yrs
- Wildfire 5/10 Major
- Heat 2/10 Low 6 d/yr ≥88°F today · 16 d/yr by 30 yrs out
- Wind 1/10 Low
- Air quality 6/10 Major 11 unhealthy d/yr today · 13 by 30 yrs out
Nearby sold comps map
Loading sold comps map…
Walkable amenities ~0.75 mi
Loading nearby amenities…
Taxation est. · year 1
- Rental income
- $35,388
- − Mortgage interest
- −$5,377
- − Property taxes
- −$1,440
- − Insurance
- −$480
- − Repairs & maintenance
- −$2,831
- − Management
- −$2,831
- − Depreciation
- −$2,793
- Taxable income
- $19,636
- Est. tax owed @ 24.0%
- −$4,713
- After-tax cash flow
- $15,283/yr
For passive investors: Depreciation is non-cash, so a rental often shows a tax loss while cash-flowing — sheltering income. Rental losses are passive: they offset passive income freely, and up to $25,000/yr can offset ordinary (W-2) income if you actively participate and your MAGI is under $100k (phasing out to $0 by $150k); unused losses carry forward. On sale, claimed depreciation is recaptured at up to 25%, and gains may owe capital-gains tax (a 1031 exchange can defer both). Figures are a year-1 estimate at your 24.0% rate — not tax advice; consult a CPA.
Schools (NCES district)
- District
- Los Alamos Public Schools
- NCES district ID
- 3501650
- Math proficiency
- 61% ▲ 14.00%
- Reading proficiency
- 78% ▲ 20.00%
- Median HH income
- $104,436
- Composite
- 64.09/100
- National rank
- #577
- State rank
- #2 of 29 in NM
Livability — Los Alamos
- Score
- 81/100
- State rank
- #2
- US rank
- #1377
Category grades
Schools grade is shown separately in the Schools card above.
Census & demographics
- Census place
- Los Alamos, NM
- County
- Los Alamos County · 13,598 people
- City population
- 13,598
- Metro
- Los Alamos, NM
- Population (ZIP)
- 13,598
- Household income
- $138,583
- Rent vs Own
- Severe rent burden
- 43.0
Population outlook (Los Alamos County) Hauer SSP2
- Today (2025)
- 17,874 people
- By 2030
- 18,157 · +1.6%
- By 2040
- 19,073 · +6.7%
- By 2050
- 20,010 · +12.0%
- By 2075
- 22,686 · +26.9%
- By 2100
- 23,523 · +31.6%
Race, ethnicity, and origin ACS 2023
- Neighborhood character
- Predominantly White (68%)
- Race & ethnicity
- White 68% Hispanic / Latino 19% Two or more races 11% Asian 7% Black 1%
- Hispanic origin (detail)
- Mexican 11%
- Common ancestry
- Italian 4% Slovak 4% Romanian 3%
- Foreign-born
- 14% · China, Canada, South Korea
- Languages at home
- 79% English-only · Spanish 9% Chinese 4% Other Indo-European 2%
Political lean MEDSL · Los Alamos
- 2024 margin
- Solid D (+30.2) · D 63.4% · R 33.2% · Other 3.4%
- 2008→2024 swing
- +23.3pp toward D · 2008: 6.9pp · 2024: 30.2pp
- All cycles
- 2024: D+30.2 2020: D+26.6 2016: D+20.3 2012: D+3.7 2008: D+6.9
Not yet ingested
- Civics
- —
Market trends
- HPI YoY
- ▼ -377.45%
- Current HPI
- 192.7096
- Rent YoY
- —
- Metro
- Los Alamos, NM
- State GDP YoY
- —
- F500 in state
- 0
Price history
-12.7% since first listed3 events — show timeline
- 2026-03-27 Pending — Southwest MLS
- 2026-02-11 Price Changed $96,000 Southwest MLS
- 2025-11-24 Listed $110,000 Southwest MLS
Cash-flow waterfall
monthlySold comps — $/sqft
last 12 mo · ≤1 miLoading sold comps…