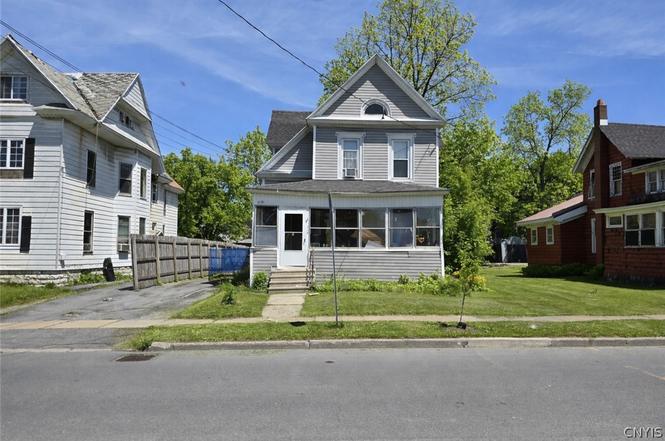
919 Academy St · Watertown, NY
Flood risk 1/10 · Minimal
- FEMA flood zone
- X
- Chance of flooding over 30 yrs
- 0.0%
- Est. flood insurance / yr
- $473 – $860
Fire risk 1/10 · Minimal
- Est. fire insurance / yr
- $691 – $1,283
Heat risk 2/10 · Minimal
- Hot days now (above 91°F)
- 7 days/yr
- Hot days in 30 yrs
- 15 days/yr
Wind risk 1/10 · Minimal
- Chance of severe wind over 30 yrs
- 0.0%
Air-quality risk 2/10 · Minimal
- Unhealthy air days now
- 1 days/yr
- Unhealthy air days in 30 yrs
- 1 days/yr
Risk factors via First Street. Map © Google.
Why this score? — see what drove the B grade
The composite is a weighted blend of 9 inputs, each scored 0–100. Each bar is that input's sub-score; the figure is the points it added to the 100-point composite (weight × sub-score).
- Cash flow +27.6/30.0
- ARV discount +15.0/15.0
- DSCR +9.7/10.0
- 1% rule +7.4/10.0
- Rent growth +5.0/5.0
- Schools +3.7/10.0
- Livability +3.4/5.0
- Condition / age +2.5/5.0
- Appreciation +0.0/10.0
$144,000
🖨 Deal sheet 📄 Offer letter ✓ Due diligence
Listing remarks
Welcome to your next home sweet home! Nestled in the heart of Watertown, this charming 4-bedroom, 2-bathroom house offers a delightful blend of comfort and convenience. Boasting a generous 2,128 square feet of living space, this residence is perfectly suited for those who enjoy spreading out or entertaining guests. Step inside and be greeted by a warm, welcoming formal dining room where you’ll host memorable dinners and laugh-filled evenings. The enclosed front porch provides a cozy nook for morning coffees or a serene spot to unwind after a busy day. Each of the bedrooms offers its own unique charm, with the primary bedroom providing ample space for relaxation and rejuvenation. The a
Key facts
- Formal dining room
- Enclosed front porch
- 7,560 sq ft lot
Tags
Neighborhood map
What this means for you Summary
Snapshot
- This is a 4-bed/2.0-bath single-family listed at $144k.
Deal economics
- At list price, monthly cash flow is $430 ($5k/yr) — positive.
- The deal already cash-flows at list — no discount required.
- Meets the 1% rule at list price ($2k rent vs $144k).
- Recommended offer: $131k (9.0% below list) — sets the bar for market timing.
- Cap rate 9.9% vs local median 6.2% in Watertown — top-decile yield for the area; either an underpriced asset or a hidden risk that comps aren't pricing in. Stress-test before assuming the spread holds.
Location & tenants
- Location reads 68/100 on livability (#540 in NY) — a middle-class / working-renter tenant base. Strengths: health & safety A+, cost of living A-, housing A-; Watch: amenities C-, schools D, crime F.
- Watertown City School District (urban): math 34% / reading 54% proficiency, ranked #481 of 590 in NY (top 82%) — families likely to look elsewhere, expect single-tenant / working-renter base with shorter leases.
- Market conditions: Rents rising fast (+10.0%/yr); 223 active listings in the ZIP; 10 comparable units currently listed for rent nearby; rentals lingering (median 44d on market — plan ~5-8 weeks vacancy on turnover, expect pricing pressure); 100% of comp listings sitting > 30 days — soft ceiling on asking rent; 196 units permitted in Jefferson County in 2024 (0 in 5+ unit buildings).
- This rent runs 37% of the median local income ($59k/yr) — at the standard rent-burdened threshold; future hikes will face affordability resistance.
Forward outlook
- Local home prices are declining (-3.0%/yr); year-one equity from $996 of loan paydown is wiped out by about $4k of value loss. Plan a longer hold.
- Jefferson County population projected at -12% by 2050 — secular population decline; favor cash flow + early exit over multi-decade hold.
- At projected returns (-3.0% appreciation + 8.0% rent growth), your $40k cash investment doubles in ~7 years — after that, you're playing with house money.
Negotiation context
- It's been on market 113 days — a 9% lower offer ($131k) is reasonable based on typical stale-listing flexibility.
- 7 sale attempts since 16y ago with the ask held roughly flat each time — persistent listings suggest the price (not the market) is what's stuck; bring a comps-based counter.
Risks & watch-outs
- Watch-outs: built in 1860 — expect roof / HVAC / electrical / plumbing capex.
Questions for the listing agent
- It's been on market 113 days. Have you received any prior offers? Is the seller open to a 9% concession, seller financing, or rate buy-down credit?
- Built in 1860 — when were the roof, HVAC, electrical panel, plumbing, and water heater last replaced?
- Why hasn't it sold? Are there any deal-killer items the seller is aware of (foundation, flood, title, zoning, code violations)?
- Is there a deadline driving the sale (1031 exchange, divorce, estate, relocation)? That informs how much negotiation room exists.
- Schools are D-rated, which usually means shorter tenancies and higher turnover. Who's the typical renter profile here, and what's been the actual vacancy rate?
- Crime grade is F in this area — have there been break-ins, vandalism, or insurance claims at this property in the last 3 years? What carrier currently insures it and at what premium?
- What's the average days-on-market for RENTAL listings here right now (not sales)? A rising rental-DOM trend means longer vacancies and softer asking-rent achievability than the comps imply.
- What's the recent tenant-quality profile in this submarket — average credit score on applications, eviction rate, late-payment / NSF rate, and stable-employment percentage? A property-management company in the area should have these aggregated.
- How much new for-sale + rental construction is in the pipeline within 1–3 miles? Heavy new supply typically softens prices + rents 12–24 months out; constrained supply supports both.
Investment metrics
- 1% rule
- 1.24% ✓
- Cap rate
- 9.88%
- Cash-on-cash
- 12.80%
- DSCR
- 1.57
- GRM
- 6.7
CMA / ARV
- ARV (on-the-fly)
- $270,256
- Comps found
- 12
Show comp detail 12 sales within ~0.75 mi
| Address | Dist | Beds/Ba | Sqft | Sold | Price | $/sf | Match |
|---|---|---|---|---|---|---|---|
| 919 Academy St | 0.00mi | 4/2.0 | 2,128 (0%) | 0mo | $150,000 | $70 | 100 |
| 418 Brainard St | 0.27mi | 4/2.0 | 2,152 (+1%) | 1mo | $274,000 | $127 | 84 |
| 946 Franklin St | 0.28mi | 4/1.5 | 2,110 (-1%) | 0mo | $256,000 | $121 | 83 |
| 1141 State St | 0.27mi | 4/2.0 | 2,272 (+7%) | 1mo | $299,900 | $132 | 76 |
| 360 Brainard St | 0.39mi | 4/2.0 | 2,016 (-5%) | 2mo | $162,000 | $80 | 72 |
| 1025 Boyd St | 0.12mi | 4/3.0 | 2,345 (+10%) | 2mo | $231,000 | $99 | 71 |
| 1120 Temple St | 0.23mi | 3/1.5 (-1) | 1,980 (-7%) | 2mo | $300,000 | $152 | 69 |
| 340 Winslow St | 0.35mi | 5/2.0 (+1) | 2,288 (+8%) | 2mo | $203,425 | $89 | 64 |
| 711 Cadwell St | 0.32mi | 4/1.5 | 1,870 (-12%) | 1mo | $239,900 | $128 | 62 |
| 1151 Harrison St | 0.25mi | 3/2.5 (-1) | 1,871 (-12%) | 0mo | $300,000 | $160 | 61 |
| 205 Michigan Ave | 0.42mi | 4/2.0 | 1,848 (-13%) | 2mo | $280,000 | $152 | 56 |
| 202 Colorado Ave | 0.49mi | 5/2.5 (+1) | 2,308 (+8%) | 2mo | $169,501 | $73 | 55 |
Match score weights: distance 35% · size 25% · config 20% · recency 20%. Top-matched comps best support the ARV.
Projected returns pro-forma
-3.0% appreciation · 8.0% rent growth · sell at horizon
- IRR
- 8.1%
- Equity multiple
- 1.34×
- Total profit
- $13,546
- Equity at exit
- $21,471
- IRR
- 21.3%
- Equity multiple
- 3.24×
- Total profit
- $90,219
- Equity at exit
- $12,450
Cash invested: $40,320 (down + closing). Projections, not guarantees.
Landlord ↔ Tenant lean methodology
- Overall (STATE)
- 15 Strongly Tenant-Friendly
- State New York
- 15 Strongly Tenant-Friendly · D+10
- County
- — inherits STATE
- City
- — inherits STATE
ZIP-level market 13601
- Home prices YoY
- -5.6%
- Rents YoY
- 10.0%
- Active inventory
- 223
- Price-to-rent
- 6.7×
Monthly cashflow live
- Estimated rent
- $1,790 high interval (Pro) →
- Mortgage (P&I)
- −$755
- Tax from tax record
- −$169 /mo · $2,027/yr
- Insurance
- −$60
- HOA
- −$0
- Vacancy / Maint / Mgmt
- −$376
- Net cashflow
- $430
Break-even live
UW: 25.0% down · 7.5% · 30yr · 1.5% tax · 5.0% vac · 8.0% maint · 8.0% mgmt
Financing live
Cash to close
- Down payment
- $36,000
- Closing costs
- $4,320
- Reserves months
- —
- Total cash needed
- —
Loan-product check · same deal, 3 products live
Conventional
25% down · 7.5% · 30yr
- Down + closing
- —
- Monthly P&I
- —
- Monthly cashflow
- —
- DSCR
- —
- Eligible?
- —
Personal DTI + credit; lowest rate.
DSCR
20% down · 8.5% · 30yr
- Down + closing
- —
- Monthly P&I
- —
- Monthly cashflow
- —
- DSCR
- —
- Eligible?
- —
No personal income docs; deal must DSCR.
Hard money
10% down · 12.0% · 12mo
- Down + closing
- —
- Monthly P&I
- —
- Monthly cashflow
- —
- DSCR
- —
- Eligible?
- —
Short-term bridge; refi at stabilization.
Rent comps 10 comps
| Address | Beds | Baths | Sqft | Rent | $/sqft | DOM | Units | Dist |
|---|---|---|---|---|---|---|---|---|
| 621 Academy St Watertown, NY | 3.0 | 2.0 | 1652 | $1,600 | $0.97 | 44d | 1 | 0.25mi |
| 123 State Pl Watertown, NY | 3.0 | 1.5 | 1500 | $1,750 | $1.17 | 44d | 1 | 0.33mi |
| 417 Franklin St Watertown, NY | 3.0 | 2.5 | 3000 | $1,750 | $0.58 | 44d | 1 | 0.37mi |
| 328 Clay St Unit 3 Watertown, NY | 3.0 | 2.0 | 1500 | $1,650 | $1.10 | 44d | 1 | 0.55mi |
| 256 Michigan Ave Watertown, NY | 2.0–4.0 | 1.0–2.5 | 1435 | $1,626 | $1.13 | 44d | 9 | 0.69mi |
| 128 Park Ave Watertown, NY | 3.0 | 2.0 | 2300 | $2,400 | $1.04 | 44d | 1 | 0.75mi |
| 1815 Olmstead Dr Watertown, NY | 2.0–4.0 | 1.0–2.0 | 1380 | $1,676 | $1.21 | 44d | 6 | 1.02mi |
| 377 W Main St Unit 1 Watertown, NY | 3.0 | 1.0 | 1991 | $1,350 | $0.68 | 44d | 1 | 1.13mi |
| 156 N Meadow St Watertown, NY | 4.0 | 1.0 | 2535 | $1,500 | $0.59 | 44d | 1 | 1.28mi |
| 702 Leray St Watertown, NY | 3.0 | 1.0 | 2700 | $1,300 | $0.48 | 44d | 1 | 1.32mi |
Listing history 26 events
-
2026-06-07statusdays on market $144,000 Pending 113 DOM
-
2026-06-05days on market $144,000 Active Under Contract 112 DOM
-
2026-06-03days on market $144,000 Active Under Contract 111 DOM
-
2026-06-02days on market $144,000 Active Under Contract 110 DOM
-
2026-06-01days on market $144,000 Active Under Contract 109 DOM
-
2026-05-31days on market $144,000 Active Under Contract 108 DOM
-
2026-05-30days on market $144,000 Active Under Contract 107 DOM
-
2026-03-27historical Active Under Contract
-
2026-02-12$144,000 Active
-
2026-02-11status Active
-
2025-11-24historical
-
2025-11-23status Pending
-
2025-11-07historical Active Under Contract
-
2025-06-20price $142,000
-
2025-05-24$144,000 Active
-
2025-05-21historical
-
2025-05-12price $144,000
-
2025-04-02price $149,000
-
2025-03-07status Active
-
2025-03-06$160,000 Active
-
2017-03-31historical
-
2016-10-12$154,000
-
2010-10-29soldstatus $155,000
-
2010-10-27soldstatus $155,000
-
2010-04-26$154,900
-
2006-10-02soldstatus $90,000
ⓘ Source: listings_history table (triggers on properties + properties_extension) + one-shot
backfill from property_details.listing_events for pre-trigger history.
Tax reassessment forecast NY · Partial reset (capped growth)
- Current annual tax
- $2,027 · $169/mo
- Projected year-2 tax
- $2,231 · $186/mo
- Expected delta
- +$203/yr (+$17/mo · 10.0%)
ⓘ Screening estimate from a state-policy table — verify with the county assessor before closing.
Climate risk First Street
- Flood 1/10 Low FEMA zone X · 0% chance over 30 yrs
- Wildfire 1/10 Low
- Heat 2/10 Low 7 d/yr ≥91°F today · 15 d/yr by 30 yrs out
- Wind 1/10 Low 0% chance of damaging wind over 30 yrs
- Air quality 2/10 Low 1 unhealthy d/yr today · 1 by 30 yrs out
Nearby sold comps map
Loading sold comps map…
Walkable amenities ~0.75 mi
Loading nearby amenities…
Taxation est. · year 1
- Rental income
- $21,483
- − Mortgage interest
- −$8,066
- − Property taxes
- −$2,027
- − Insurance
- −$720
- − Repairs & maintenance
- −$1,719
- − Management
- −$1,719
- − Depreciation
- −$4,189
- Taxable income
- $3,043
- Est. tax owed @ 24.0%
- −$730
- After-tax cash flow
- $4,432/yr
For passive investors: Depreciation is non-cash, so a rental often shows a tax loss while cash-flowing — sheltering income. Rental losses are passive: they offset passive income freely, and up to $25,000/yr can offset ordinary (W-2) income if you actively participate and your MAGI is under $100k (phasing out to $0 by $150k); unused losses carry forward. On sale, claimed depreciation is recaptured at up to 25%, and gains may owe capital-gains tax (a 1031 exchange can defer both). Figures are a year-1 estimate at your 24.0% rate — not tax advice; consult a CPA.
Schools (NCES district)
- District
- Watertown City School District
- NCES district ID
- 3630120
- Math proficiency
- 34% ▼ -10.00%
- Reading proficiency
- 54% ▲ 12.00%
- Median HH income
- $40,919
- Composite
- 36.86/100
- National rank
- #4551
- State rank
- #481 of 590 in NY
Livability — Watertown
- Score
- 68/100
- State rank
- #540
- US rank
- #9700
Category grades
Schools grade is shown separately in the Schools card above.
Census & demographics
- Census place
- Watertown, NY
- County
- Jefferson County · 47,417 people
- City population
- 36,839
- Metro
- Watertown-Fort Drum, NY
- Population (ZIP)
- 36,839
- Household income
- $58,791
- Rent vs Own
- Severe rent burden
- 1634.0
Population outlook (Jefferson County) Hauer SSP2
- Today (2025)
- 111,748 people
- By 2030
- 109,370 · -2.1%
- By 2040
- 103,828 · -7.1%
- By 2050
- 98,523 · -11.8%
- By 2075
- 91,422 · -18.2%
- By 2100
- 78,214 · -30.0%
Race, ethnicity, and origin ACS 2023
- Neighborhood character
- Predominantly White (82%)
- Race & ethnicity
- White 82% Two or more races 7% Hispanic / Latino 6% Black 4% Asian 2%
- Hispanic origin (detail)
- Mexican 2% Puerto Rican 2%
- Common ancestry
- Lithuanian 7% Romanian 3% Slovak 2%
- Foreign-born
- 4% · Canada
- Languages at home
- 94% English-only · Spanish 3% Other Indo-European 1% German/W. Germanic 1%
Political lean MEDSL · Jefferson
- 2024 margin
- Strong R (+23.6) · D 38.2% · R 61.8%
- 2008→2024 swing
- -18.3pp toward R · 2008: -5.3pp · 2024: -23.6pp
- All cycles
- 2024: R+23.6 2020: R+19.0 2016: R+22.4 2012: R+2.9 2008: R+5.3
Not yet ingested
- Civics
- —
Market trends
- HPI YoY
- ▼ -18.86%
- Current HPI
- 316.636
- Rent YoY
- ▲ 9.96%
- Metro
- Watertown-Fort Drum, NY
- State GDP YoY
- ▲ 2.60%
- F500 in state
- 92
Industry mix (Fortune 500 HQ in NY)
| Industry | F500 HQs | Revenue |
|---|---|---|
| Financial Services | 10 | $950B |
|
||
| Consumer Goods | 9 | $162B |
|
||
| Insurance | 4 | $225B |
|
||
| Telecommunications | 2 | $144B |
|
||
| Pharmaceuticals | 2 | $112B |
|
||
| Media / Entertainment | 2 | $69B |
|
||
Price history
+60.0% since first listed19 events — show timeline
- 2026-03-27 Contingent — CNYIS
- 2026-02-12 Listed $144,000 CNYIS
- 2026-02-11 Relisted — CNYIS
- 2025-11-24 Listing Removed — CNYIS
- 2025-11-23 Pending — CNYIS
- 2025-11-07 Contingent — CNYIS
- 2025-06-20 Price Changed $142,000 CNYIS
- 2025-05-24 Listed $144,000 CNYIS
- 2025-05-21 Listing Removed — CNYIS
- 2025-05-12 Price Changed $144,000 CNYIS
- 2025-04-02 Price Changed $149,000 CNYIS
- 2025-03-07 Relisted — CNYIS
- 2025-03-06 Listed $160,000 CNYIS
- 2017-03-31 Listing Removed — CNYIS
- 2016-10-12 Listed $154,000 CNYIS
- 2010-10-29 Sold (Public Records) $155,000 Public Records
- 2010-10-27 Sold (MLS) $155,000 CNYIS
- 2010-04-26 Listed $154,900 CNYIS
- 2006-10-02 Sold (Public Records) $90,000 Public Records
Property tax history
+18.2%/yrLatest (2025): $2,027 · +2.0% YoY. Source: county tax records.
Cash-flow waterfall
monthlySold comps — $/sqft
last 12 mo · ≤1 miLoading sold comps…