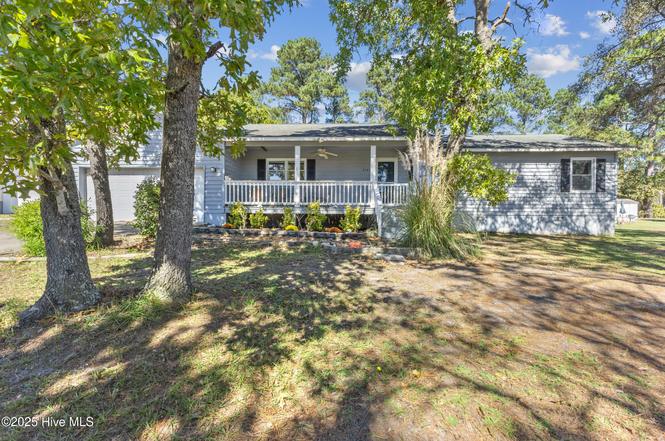
4580 Squirrel Ave NW · Shallotte, NC
Flood risk 1/10 · Minimal
- FEMA flood zone
- X (unshaded)
- Chance of flooding over 30 yrs
- 0.0%
- Est. flood insurance / yr
- $507 – $1,088
Fire risk 5/10 · Moderate
- Est. fire insurance / yr
- $906 – $1,684
Heat risk 9/10 · Severe
- Hot days now (above 105°F)
- 7 days/yr
- Hot days in 30 yrs
- 19 days/yr
Wind risk 8/10 · Major
- Chance of severe wind over 30 yrs
- 99.0%
Air-quality risk 1/10 · Minimal
- Unhealthy air days now
- 0 days/yr
- Unhealthy air days in 30 yrs
- 0 days/yr
Risk factors via First Street. Map © Google.
Why this score? — see what drove the D+ grade
The composite is a weighted blend of 9 inputs, each scored 0–100. Each bar is that input's sub-score; the figure is the points it added to the 100-point composite (weight × sub-score).
- ARV discount +15.0/15.0
- Cash flow +12.5/30.0
- Schools +3.9/10.0
- DSCR +3.7/10.0
- Livability +3.2/5.0
- 1% rule +2.8/10.0
- Rent growth +2.5/5.0
- Condition / age +2.5/5.0
- Appreciation +0.0/10.0
$219,000
🖨 Deal sheet (PDF) 📄 Offer letter ✓ Due diligence
Listing remarks MLS
Looking for a place to call home in a neighborhood without a HOA fee. Here's the place. Newly installed vinyl plank flooring throughout. All appliances included even washer and dryer. The location is a plus. So close to shopping, restaurants, schools and the local beaches. Broker owned.
Key facts
- Fresh paint
- New hvac
- New water heater
Tags
Neighborhood map
What this means for you Summary
Snapshot
- This is a 3-bed/2.0-bath single-family listed at $219k.
Deal economics
- At list price, monthly cash flow is $-32 ($-390/yr) — negative.
- To cash-flow at today's rent, offer at most $213k (2.6% below list).
- To meet the 1% rule (rent ≥ 1% of price), the offer needs to be $170k (22.3% below list).
- Recommended offer: $170k (22.3% below list) — sets the bar for 1% rule.
- Cap rate 6.1% vs local median 4.0% in Shallotte — top-decile yield for the area; either an underpriced asset or a hidden risk that comps aren't pricing in. Stress-test before assuming the spread holds.
Location & tenants
- Location reads 63/100 on livability (#411 in NC) — a middle-class / working-renter tenant base. Strengths: cost of living A+, housing A+, employment B; Watch: health & safety D, crime F, amenities F.
- Brunswick County Schools (rural): math 45% / reading 47% proficiency, ranked #82 of 178 in NC (top 46%) — families likely to look elsewhere, expect single-tenant / working-renter base with shorter leases.
- Zoned schools: Union Elementary (math 83% / reading 76%, grade A, #24 of 1,410 statewide, top 2%, 571 students, 100% FRL); Shallotte Middle (math 40% / reading 50%, grade D, #160 of 475 statewide, top 35%, 674 students, 100% FRL); West Brunswick High (math 50% / reading 56%, grade C-, #281 of 535 statewide, top 53%, 1,526 students, 100% FRL) — zoned schools average 100% FRL vs 53% district-wide (46 pts higher); higher-poverty schools than district average — tighter screening recommended.
- Zoned-school proficiency averages 59% at this address vs 46% district-wide (+13 pts) — the actual schools serving this property are materially stronger than the Brunswick County Schools average implies; a family-tenant draw the district grade alone would hide.
- Market conditions: 384 active listings in the ZIP; 6,112 units permitted in Brunswick County in 2024 (990 in 5+ unit buildings).
- This rent runs 31% of the median local income ($65k/yr) — at the standard rent-burdened threshold; future hikes will face affordability resistance.
Forward outlook
- Local home prices are declining (-3.0%/yr); year-one equity from $2k of loan paydown is wiped out by about $7k of value loss. Plan a longer hold.
- Brunswick County population projected at +36% by 2050 — long-run rental-demand tailwind backs the buy-and-hold thesis.
Negotiation context
- It's been on market 164 days — a 12% lower offer ($193k) is reasonable based on typical stale-listing flexibility.
- 5 sale attempts since 20y ago; this cycle's ask has dropped $40k (15%) from the opening price — seller is motivated, your offer sets the floor, not the list.
- Current owner paid $155k; 41% above their basis — modest negotiation headroom, anchor on the comps not their cost.
Risks & watch-outs
- Climate carrying-cost: severe wind risk, 99% chance of damaging wind over 30y; moderate wildfire risk; extreme-heat days projected 7→19/yr by 2055 (HVAC capex compounding) — expect insurance premiums to compound above CPI over the hold.
Questions for the listing agent
- What do current leases actually rent for vs. the listed asking? Can we see a recent rent roll and the last 12 months of T-12 income?
- It's been on market 164 days. Have you received any prior offers? Is the seller open to a 22% concession, seller financing, or rate buy-down credit?
- Why hasn't it sold? Are there any deal-killer items the seller is aware of (foundation, flood, title, zoning, code violations)?
- Is there a deadline driving the sale (1031 exchange, divorce, estate, relocation)? That informs how much negotiation room exists.
- Crime grade is F in this area — have there been break-ins, vandalism, or insurance claims at this property in the last 3 years? What carrier currently insures it and at what premium?
- The area grade is low — what's the realistic commute time and amenity access for the typical tenant pool here? Any planned neighborhood developments (good or bad) we should know about?
- What's the average days-on-market for RENTAL listings here right now (not sales)? A rising rental-DOM trend means longer vacancies and softer asking-rent achievability than the comps imply.
- What's the recent tenant-quality profile in this submarket — average credit score on applications, eviction rate, late-payment / NSF rate, and stable-employment percentage? A property-management company in the area should have these aggregated.
- How much new for-sale + rental construction is in the pipeline within 1–3 miles? Heavy new supply typically softens prices + rents 12–24 months out; constrained supply supports both.
Investment metrics
- 1% rule
- 0.78% ✗
- Cap rate
- 6.12%
- Cash-on-cash
- -0.64%
- DSCR
- 0.97
- GRM
- 10.7
CMA / ARV
- ARV (on-the-fly)
- $355,080
- Comps found
- 12
Show comp detail 12 sales within ~0.75 mi
| Address | Dist | Beds/Ba | Sqft | Sold | Price | $/sf | Match |
|---|---|---|---|---|---|---|---|
| 4284 Frogie Ln | 0.17mi | 3/2.0 | 1,883 (-12%) | 4mo | $323,815 | $172 | 68 |
| 180 Wild Raven St NW | 0.34mi | 3/3.0 | 2,069 (-4%) | 8mo | $356,000 | $172 | 67 |
| 4421 East Coast Ln | 0.37mi | 3/2.0 | 1,883 (-12%) | 4mo | $310,000 | $165 | 59 |
| 2000 Snipe Ln Lot 368- Galen B | 0.33mi | 4/2.5 (+1) | 2,340 (+9%) | 5mo | $316,000 | $135 | 59 |
| 2000 Lot 368- Galen B Snipe Ln | 0.33mi | 4/2.5 (+1) | 2,340 (+9%) | 5mo | $316,000 | $135 | 59 |
| 4465 East Coast Ln | 0.32mi | 4/2.0 (+1) | 1,883 (-12%) | 3mo | $304,000 | $161 | 57 |
| 4480 East Coast Ln | 0.29mi | 3/2.0 | 1,883 (-12%) | 11mo | $310,000 | $165 | 56 |
| 4480 East Coast Ln | 0.29mi | 3/2.0 | 1,883 (-12%) | 11mo | $310,000 | $165 | 56 |
| 4445 East Coast Ln | 0.36mi | 4/2.0 (+1) | 1,883 (-12%) | 7mo | $267,000 | $142 | 52 |
| 4445 East Coast Ln | 0.36mi | 4/2.0 (+1) | 1,883 (-12%) | 7mo | $319,475 | $170 | 52 |
| 4525 East Coast Ln | 0.34mi | 4/2.0 (+1) | 1,883 (-12%) | 12mo | $310,000 | $165 | 48 |
| 4525 East Coast Ln | 0.34mi | 4/2.0 (+1) | 1,883 (-12%) | 12mo | $310,000 | $165 | 48 |
Match score weights: distance 35% · size 25% · config 20% · recency 20%. Top-matched comps best support the ARV.
Projected returns pro-forma
-3.0% appreciation · 3.0% rent growth · sell at horizon
- IRR
- -17.4%
- Equity multiple
- 0.39×
- Total profit
- $-37,613
- Equity at exit
- $32,654
- IRR
- -9.5%
- Equity multiple
- 0.42×
- Total profit
- $-35,651
- Equity at exit
- $18,935
Cash invested: $61,320 (down + closing). Projections, not guarantees.
Landlord ↔ Tenant lean methodology
- Overall (STATE)
- 85 Strongly Landlord-Friendly
- State North Carolina
- 85 Strongly Landlord-Friendly · R+3
- County
- — inherits STATE
- City
- — inherits STATE
ZIP-level market 28470
- Home prices YoY
- -34.8%
- Active inventory
- 384
- Price-to-rent
- 10.7×
Monthly cashflow live
- Estimated rent
- $1,702 medium interval (Pro) →
- Mortgage (P&I)
- −$1,148
- Tax from tax record
- −$138 /mo · $1,652/yr
- Insurance
- −$91
- HOA
- −$0
- Vacancy / Maint / Mgmt
- −$358
- Net cashflow
- $-32
Break-even live
Sensitivity live
| Price | -10% $92 | -5% $30 | +0% $-32 | +5% $-94 | +10% $-156 |
|---|---|---|---|---|---|
| Rent | -10% $-167 | -5% $-100 | +0% $-32 | +5% $35 | +10% $102 |
| Rate | -1.0pp $78 | -0.5pp $23 | base $-32 | +0.5pp $-89 | +1.0pp $-147 |
UW: 25.0% down · 7.5% · 30yr · 1.5% tax · 5.0% vac · 8.0% maint · 8.0% mgmt
Financing live
Cash to close
- Down payment
- $54,750
- Closing costs
- $6,570
- Reserves months
- —
- Total cash needed
- —
Loan-product check · same deal, 3 products live
Conventional
25% down · 7.5% · 30yr
- Down + closing
- —
- Monthly P&I
- —
- Monthly cashflow
- —
- DSCR
- —
- Eligible?
- —
Personal DTI + credit; lowest rate.
DSCR
20% down · 8.5% · 30yr
- Down + closing
- —
- Monthly P&I
- —
- Monthly cashflow
- —
- DSCR
- —
- Eligible?
- —
No personal income docs; deal must DSCR.
Hard money
10% down · 12.0% · 12mo
- Down + closing
- —
- Monthly P&I
- —
- Monthly cashflow
- —
- DSCR
- —
- Eligible?
- —
Short-term bridge; refi at stabilization.
Listing history 15 events
-
2026-04-17status Pending
-
2026-04-14price $219,000
-
2026-03-24status Active
-
2026-03-12status Pending
-
2026-03-08price $229,000
-
2026-01-23price $245,000
-
2025-10-23$259,000 Active
-
2019-03-18soldstatus $155,000 287-char remark
Show marketing remark (287 chars)
Looking for a place to call home in a neighborhood without a HOA fee. Here's the place. Newly installed vinyl plank flooring throughout. All appliances included even washer and dryer. The location is a plus. So close to shopping, restaurants, schools and the local beaches. Broker owned.
-
2019-03-18soldstatus $155,000
Show marketing remark (287 chars)
Looking for a place to call home in a neighborhood without a HOA fee. Here's the place. Newly installed vinyl plank flooring throughout. All appliances included even washer and dryer. The location is a plus. So close to shopping, restaurants, schools and the local beaches. Broker owned.
-
2019-01-25$159,900 287-char remark
Show marketing remark (287 chars)
Looking for a place to call home in a neighborhood without a HOA fee. Here's the place. Newly installed vinyl plank flooring throughout. All appliances included even washer and dryer. The location is a plus. So close to shopping, restaurants, schools and the local beaches. Broker owned.
-
2017-01-31historical
-
2016-12-30$147,500
-
2006-08-28soldstatus $145,000
-
2006-08-28soldstatus $145,000
-
2006-05-17$149,000
ⓘ Source: listings_history table (triggers on properties + properties_extension) + one-shot
backfill from property_details.listing_events for pre-trigger history.
Tax reassessment forecast NC · Resets to sale price
- Current annual tax
- $1,652 · $138/mo
- Projected year-2 tax
- $1,796 · $150/mo
- Expected delta
- +$143/yr (+$12/mo · 8.7%)
ⓘ Screening estimate from a state-policy table — verify with the county assessor before closing.
Climate risk First Street
- Flood 1/10 Low FEMA zone X (unshaded) · 0% chance over 30 yrs
- Wildfire 5/10 Major
- Heat 9/10 Extreme 7 d/yr ≥105°F today · 19 d/yr by 30 yrs out
- Wind 8/10 Severe 99% chance of damaging wind over 30 yrs
- Air quality 1/10 Low 0 unhealthy d/yr today · 0 by 30 yrs out
Nearby sold comps map
Loading sold comps map…
Walkable amenities ~0.75 mi
Loading nearby amenities…
Taxation est. · year 1
- Rental income
- $20,429
- − Mortgage interest
- −$12,267
- − Property taxes
- −$1,652
- − Insurance
- −$1,095
- − Repairs & maintenance
- −$1,634
- − Management
- −$1,634
- − Depreciation
- −$6,371
- Taxable loss
- −$4,225
- Est. tax savings @ 24.0%
- +$1,014
- After-tax cash flow
- $624/yr
For passive investors: Depreciation is non-cash, so a rental often shows a tax loss while cash-flowing — sheltering income. Rental losses are passive: they offset passive income freely, and up to $25,000/yr can offset ordinary (W-2) income if you actively participate and your MAGI is under $100k (phasing out to $0 by $150k); unused losses carry forward. On sale, claimed depreciation is recaptured at up to 25%, and gains may owe capital-gains tax (a 1031 exchange can defer both). Figures are a year-1 estimate at your 24.0% rate — not tax advice; consult a CPA.
Schools (NCES district)
- District
- Brunswick County Schools
- NCES district ID
- 3700420
- Math proficiency
- 45% ▲ 4.00%
- Reading proficiency
- 47% ▲ 4.00%
- Median HH income
- $47,494
- Composite
- 39.23/100
- National rank
- #4011
- State rank
- #82 of 178 in NC
Livability — Shallotte
- Score
- 63/100
- State rank
- #411
- US rank
- #15490
Category grades
Schools grade is shown separately in the Schools card above.
Census & demographics
- Census place
- Shallotte, NC
- County
- Brunswick County · 131,536 people
- City population
- 11,219
- Metro
- Myrtle Beach-Conway-North Myrtle Beach, SC-NC
- Population (ZIP)
- 11,219
- Household income
- $65,030
- Rent vs Own
- Severe rent burden
- 455.0
Population outlook (Brunswick County) Hauer SSP2
- Today (2025)
- 152,111 people
- By 2030
- 165,705 · +8.9%
- By 2040
- 188,494 · +23.9%
- By 2050
- 206,228 · +35.6%
- By 2075
- 237,876 · +56.4%
- By 2100
- 251,451 · +65.3%
Race, ethnicity, and origin ACS 2023
- Neighborhood character
- Predominantly White (73%)
- Race & ethnicity
- White 73% Black 13% Two or more races 9% Hispanic / Latino 8%
- Hispanic origin (detail)
- Mexican 3%
- Common ancestry
- Serbian 3% Slovak 2% Italian 2%
- Foreign-born
- 3% · Canada, Jamaica
- Languages at home
- 98% English-only · Spanish 2%
Political lean MEDSL · Brunswick
- 2024 margin
- Strong R (+24.9) · D 37.2% · R 62.0%
- 2008→2024 swing
- -6.9pp toward R · 2008: -17.9pp · 2024: -24.9pp
- All cycles
- 2024: R+24.9 2020: R+25.0 2016: R+28.7 2012: R+22.2 2008: R+17.9
Not yet ingested
- Civics
- —
Market trends
- HPI YoY
- ▼ -77.91%
- Current HPI
- 146.2303
- Rent YoY
- —
- Metro
- Myrtle Beach-Conway-North Myrtle Beach, SC-NC
- State GDP YoY
- ▲ 3.28%
- F500 in state
- 26
Industry mix (Fortune 500 HQ in NC)
| Industry | F500 HQs | Revenue |
|---|---|---|
| Financial Services | 2 | $213B |
|
||
| Retail | 2 | $95B |
|
||
| Industrial Conglomerate | 1 | $38B |
|
||
| Metals / Steel | 1 | $35B |
|
||
| Utilities | 1 | $30B |
|
||
| Industrial Machinery | 1 | $19B |
|
||
Price history
+47.0% since first listed15 events — show timeline
- 2026-04-17 Pending — Hive MLS
- 2026-04-14 Price Changed $219,000 Hive MLS
- 2026-03-24 Relisted — Hive MLS
- 2026-03-12 Pending — Hive MLS
- 2026-03-08 Price Changed $229,000 Hive MLS
- 2026-01-23 Price Changed $245,000 Hive MLS
- 2025-10-23 Listed $259,000 Hive MLS
- 2019-03-18 Sold (Public Records) $155,000 Public Records
- 2019-03-18 Sold (MLS) $155,000 Hive MLS
- 2019-01-25 Listed $159,900 Hive MLS
- 2017-01-31 Listing Removed — Hive MLS
- 2016-12-30 Listed $147,500 Hive MLS
- 2006-08-28 Sold (Public Records) $145,000 Public Records
- 2006-08-28 Sold (MLS) $145,000 Hive MLS
- 2006-05-17 Listed $149,000 Hive MLS
Property tax history
+5.3%/yrLatest (2025): $1,652 · +1.1% YoY. Source: county tax records.
Cash-flow waterfall
monthlySold comps — $/sqft
last 12 mo · ≤1 miLoading sold comps…