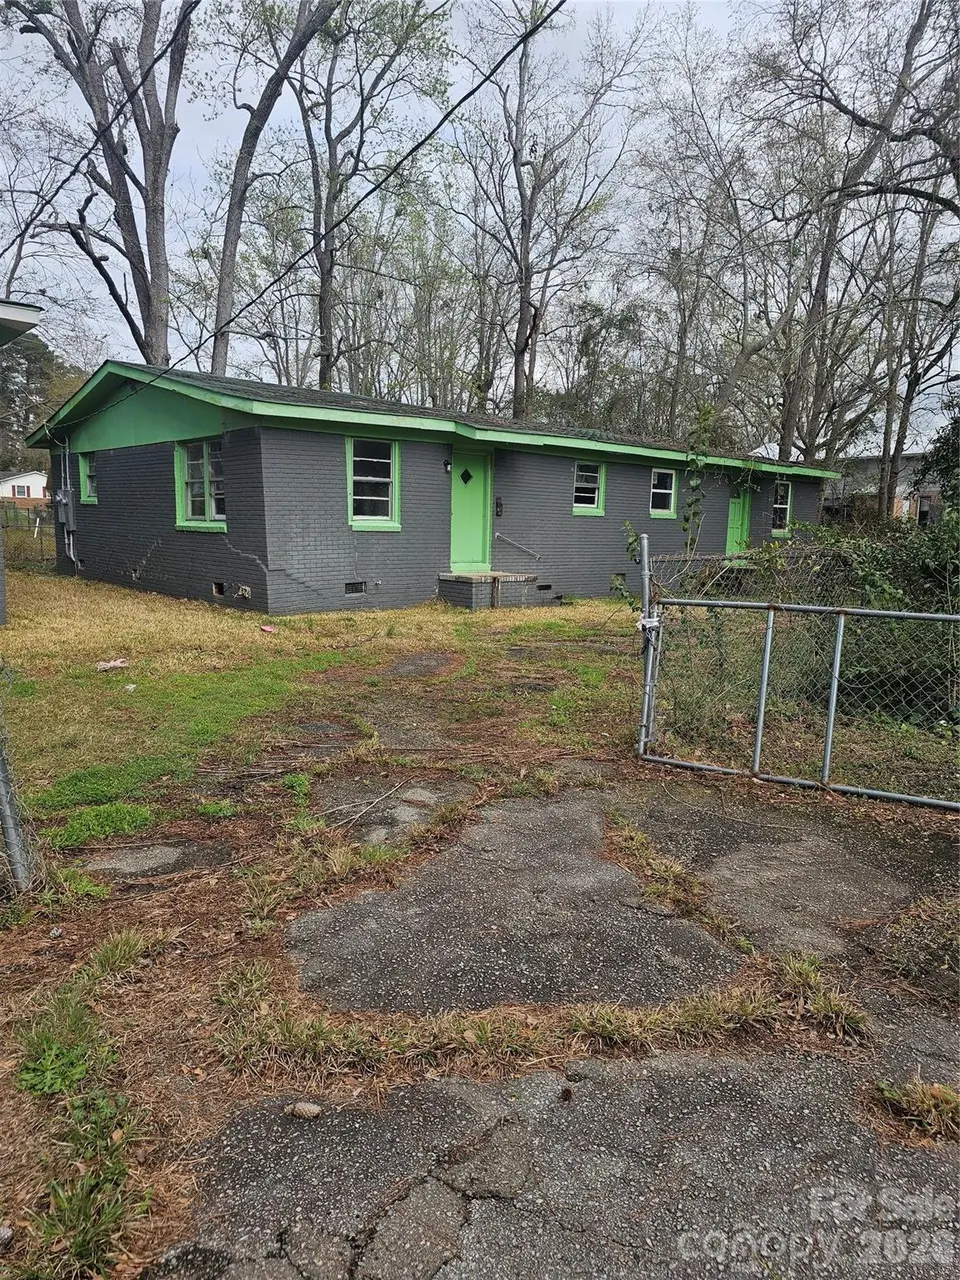
 Fourplex
1660 Windsor St · Orangeburg, SC
Flood risk 6/10 · Moderate
- FEMA flood zone
- X (unshaded)
- Chance of flooding over 30 yrs
- 0.74%
- Est. flood insurance / yr
- $507 – $1,088
Fire risk 3/10 · Minor
- Est. fire insurance / yr
- $783 – $1,453
Heat risk 7/10 · Major
- Hot days now (above 108°F)
- 7 days/yr
- Hot days in 30 yrs
- 17 days/yr
Wind risk 8/10 · Major
- Chance of severe wind over 30 yrs
- 80.0%
Air-quality risk 3/10 · Minor
- Unhealthy air days now
- 3 days/yr
- Unhealthy air days in 30 yrs
- 3 days/yr
Risk factors via First Street. Map © Google.
Why this score? — see what drove the B- grade
The composite is a weighted blend of 9 inputs, each scored 0–100. Each bar is that input's sub-score; the figure is the points it added to the 100-point composite (weight × sub-score).
- Cash flow +30.0/30.0
- 1% rule +10.0/10.0
- DSCR +10.0/10.0
- ARV discount +7.5/15.0
- Schools +5.0/10.0
- Livability +2.7/5.0
- Rent growth +2.5/5.0
- Condition / age +2.2/5.0
- Appreciation +0.0/10.0
$150,000
🖨 Deal sheet 📄 Offer letter ✓ Due diligence
Multi-family units
County records classify this as Multi-Family (2-4 Unit). Listing-text estimate: 4 units. confirmed
Listing remarks
BACK ON THE MARKET!!!! Investor Special – Income-Producing Opportunity in Orangeburg, SC! Attention investors! Don’t miss this quadruplex opportunity at 1660 Windsor Street offering strong income potential and value-add upside. This multifamily property features 4 units (8 bedrooms / 4 bathrooms total) with approximately 3,600 sq ft, making it an ideal addition to any rental portfolio. This property has a solid brick construction, the property includes front and rear porches for each unit, off-street parking, and a functional layout suited for long-term tenants. Located in an established area of Orangeburg, the property offers convenient access to local amenities, schools, and
Key facts
- Off street parking
- Convenient access
- Functional layout
Tags
Property features AI
Finance
- Other: Total of 4 units; Living area approximately 3600
- HOA & community: No HOA; Pets allowed
Exterior
- Parking: Driveway
- Utilities: City water; Public sewer
- Home design: Residential income property (duplex); Site-built construction
- Construction: Brick exterior; Composition roof; Crawl space foundation
- Exterior features: Level lot; Chain link fencing in front yard; Gravel and paved road access; Publicly maintained road
Interior
- Kitchen: Electric oven
- Bedrooms: 8 bedrooms total (configured as four 2-bedroom units)
- Flooring: Carpet
- Bathrooms: 4 full bathrooms
- Heating & cooling: Central heating; Central air conditioning
- Interior features: Electric oven; Primary bedroom; Living room; Dining area
- Laundry & utility: Laundry on the main level
Neighborhood map
What this means for you Summary
Snapshot
- This is a 4 × 2-bed/1.0-bath units multifamily listed at $150k. Condition is rated fair.
Deal economics
- At list price, monthly cash flow is $2k ($28k/yr) — positive. Per door: $581/mo.
- The deal already cash-flows at list — no discount required.
- Meets the 1% rule at list price ($4k rent vs $150k).
- Recommended offer: $141k (6.0% below list) — sets the bar for market timing.
- Cap rate 24.9% vs local median 4.2% in Orangeburg — top-decile yield for the area; either an underpriced asset or a hidden risk that comps aren't pricing in. Stress-test before assuming the spread holds.
Location & tenants
- Location reads 54/100 on livability (#324 in SC) — a working-class tenant base; expect higher turnover. Strengths: cost of living A+, health & safety B; Watch: housing C-, schools F, crime F.
- Market conditions: 226 active listings in the ZIP; 87 units permitted in Orangeburg County in 2024 (0 in 5+ unit buildings).
Forward outlook
- Local home prices are declining (-3.0%/yr); year-one equity from $1k of loan paydown is wiped out by about $4k of value loss. Plan a longer hold.
- Orangeburg County population projected at -27% by 2050 — secular population decline; favor cash flow + early exit over multi-decade hold.
- At projected returns (-3.0% appreciation + 3.0% rent growth), your $42k cash investment doubles in ~2 years — after that, you're playing with house money.
Negotiation context
- It's been on market 81 days — a 6% lower offer ($141k) is reasonable based on typical stale-listing flexibility.
- 2 sale attempts; this cycle's ask is 7% above the opening price — seller raised mid-cycle; expect resistance to lowballs.
Risks & watch-outs
- Watch-outs: built in 1950 — expect roof / HVAC / electrical / plumbing capex.
- Climate carrying-cost: major flood risk; severe wind risk, 80% chance of damaging wind over 30y; extreme-heat days projected 7→17/yr by 2055 (HVAC capex compounding) — expect insurance premiums to compound above CPI over the hold.
Questions for the listing agent
- It's been on market 81 days. Have you received any prior offers? Is the seller open to a 6% concession, seller financing, or rate buy-down credit?
- Can we see the unit-by-unit rent roll, current vacancy, and any below-market leases? What's the average tenancy length?
- What capital expenditures (roof, boiler, parking lot, exteriors) have been made in the last 5 years, and what's planned in the next 2?
- Have any recent inspections been done? Can we get a copy of the seller's disclosures and any deferred-maintenance estimates?
- Built in 1950 — when were the roof, HVAC, electrical panel, plumbing, and water heater last replaced?
- Why hasn't it sold? Are there any deal-killer items the seller is aware of (foundation, flood, title, zoning, code violations)?
- Is there a deadline driving the sale (1031 exchange, divorce, estate, relocation)? That informs how much negotiation room exists.
- Schools are F-rated, which usually means shorter tenancies and higher turnover. Who's the typical renter profile here, and what's been the actual vacancy rate?
- Crime grade is F in this area — have there been break-ins, vandalism, or insurance claims at this property in the last 3 years? What carrier currently insures it and at what premium?
- What's the average days-on-market for RENTAL listings here right now (not sales)? A rising rental-DOM trend means longer vacancies and softer asking-rent achievability than the comps imply.
- What's the recent tenant-quality profile in this submarket — average credit score on applications, eviction rate, late-payment / NSF rate, and stable-employment percentage? A property-management company in the area should have these aggregated.
- How much new apartment / multifamily construction is in the pipeline within 1–3 miles? Heavy new supply (>2% of stock underway) typically softens rents 12–24 months out; light construction supports rent growth.
Investment metrics
- 1% rule
- 2.84% ✓
- Cap rate
- 24.88%
- Cash-on-cash
- 66.38%
- DSCR
- 3.95
- GRM
- 2.9
CMA / ARV
No comps found within radius.
Projected returns pro-forma
-3.0% appreciation · 3.0% rent growth · sell at horizon
- IRR
- 65.7%
- Equity multiple
- 3.95×
- Total profit
- $123,727
- Equity at exit
- $22,365
- IRR
- 70.0%
- Equity multiple
- 8.11×
- Total profit
- $298,534
- Equity at exit
- $12,969
Cash invested: $42,000 (down + closing). Projections, not guarantees.
Landlord ↔ Tenant lean methodology
- Overall (STATE)
- 90 Strongly Landlord-Friendly
- State South Carolina
- 90 Strongly Landlord-Friendly · R+6
- County
- — inherits STATE
- City
- — inherits STATE
ZIP-level market 29115
- Home prices YoY
- -27.3%
- Active inventory
- 226
- Price-to-rent
- 11.8×
Monthly cashflow live
- Estimated rent
- $4,253 medium interval (Pro) →
- Mortgage (P&I)
- −$787
- Tax est. 1.5%
- −$188 /mo · $2,250/yr
- Insurance
- −$62
- HOA
- −$0
- Vacancy / Maint / Mgmt
- −$893
- Net cashflow
- $2,323
Break-even live
4-unit breakdown (identical units grouped — click to expand)
| Units | Beds | Baths | Est. rent |
|---|---|---|---|
| 4× units | 2 | 1 | $4,252 |
| #1 | 2 | 1 | $1,063 |
| #2 | 2 | 1 | $1,063 |
| #3 | 2 | 1 | $1,063 |
| #4 | 2 | 1 | $1,063 |
| Total (4 units) | $4,253 | ||
UW: 25.0% down · 7.5% · 30yr · 1.5% tax · 5.0% vac · 8.0% maint · 8.0% mgmt
Financing live
Cash to close
- Down payment
- $37,500
- Closing costs
- $4,500
- Reserves months
- —
- Total cash needed
- —
Loan-product check · same deal, 3 products live
Conventional
25% down · 7.5% · 30yr
- Down + closing
- —
- Monthly P&I
- —
- Monthly cashflow
- —
- DSCR
- —
- Eligible?
- —
Personal DTI + credit; lowest rate.
DSCR
20% down · 8.5% · 30yr
- Down + closing
- —
- Monthly P&I
- —
- Monthly cashflow
- —
- DSCR
- —
- Eligible?
- —
No personal income docs; deal must DSCR.
Hard money
10% down · 12.0% · 12mo
- Down + closing
- —
- Monthly P&I
- —
- Monthly cashflow
- —
- DSCR
- —
- Eligible?
- —
Short-term bridge; refi at stabilization.
Listing history 20 events
-
2026-06-19days on market $150,000 Active 81 DOM
-
2026-06-18days on market $150,000 Active 80 DOM
-
2026-06-17days on market $150,000 Active 79 DOM
-
2026-06-16days on market $150,000 Active 78 DOM
-
2026-06-15days on market $150,000 Active 77 DOM
-
2026-06-14days on market $150,000 Active 75 DOM
-
2026-06-12days on market $150,000 Active 74 DOM
-
2026-06-09days on market $150,000 Active 71 DOM
-
2026-06-08days on market $150,000 Active 70 DOM
-
2026-06-07days on market $150,000 Active 69 DOM
-
2026-06-07days on market $150,000 Active 68 DOM
-
2026-06-04days on market $150,000 Active 65 DOM
-
2026-06-02days on market $150,000 Active 64 DOM
-
2026-06-01days on market $150,000 Active 63 DOM
-
2026-05-31days on market $150,000 Active 62 DOM
-
2026-05-31days on market $150,000 Active 61 DOM
-
2026-04-22status Active
-
2026-04-22price $150,000
-
2026-04-02historical Active Under Contract
-
2026-03-30$140,000 Active
ⓘ Source: listings_history table (triggers on properties + properties_extension) + one-shot
backfill from property_details.listing_events for pre-trigger history.
Climate risk First Street
- Flood 6/10 Major FEMA zone X (unshaded) · 74% chance over 30 yrs
- Wildfire 3/10 Moderate
- Heat 7/10 Severe 7 d/yr ≥108°F today · 17 d/yr by 30 yrs out
- Wind 8/10 Severe 80% chance of damaging wind over 30 yrs
- Air quality 3/10 Moderate 3 unhealthy d/yr today · 3 by 30 yrs out
Nearby sold comps map
Loading sold comps map…
Walkable amenities ~0.75 mi
Loading nearby amenities…
Taxation est. · year 1
- Rental income
- $51,036
- − Mortgage interest
- −$8,402
- − Property taxes
- −$2,250
- − Insurance
- −$750
- − Repairs & maintenance
- −$4,083
- − Management
- −$4,083
- − Depreciation
- −$4,364
- Taxable income
- $27,104
- Est. tax owed @ 24.0%
- −$6,505
- After-tax cash flow
- $21,374/yr
For passive investors: Depreciation is non-cash, so a rental often shows a tax loss while cash-flowing — sheltering income. Rental losses are passive: they offset passive income freely, and up to $25,000/yr can offset ordinary (W-2) income if you actively participate and your MAGI is under $100k (phasing out to $0 by $150k); unused losses carry forward. On sale, claimed depreciation is recaptured at up to 25%, and gains may owe capital-gains tax (a 1031 exchange can defer both). Figures are a year-1 estimate at your 24.0% rate — not tax advice; consult a CPA.
Condition & rehab AI · 13 photos
This multifamily property requires extensive renovations to bring it up to modern standards, significantly improving its resale and rental value.
Repairs flagged
- Major kitchen cabinets — poor condition
- Major bathroom fixtures — damaged and missing
- Major exterior paint — chipped and peeling
- Major flooring — damaged and worn
- Major interior walls — peeling paint
Value-add opportunities
- Resale new kitchen cabinets — modernizes the space and adds value
- Resale new bathroom fixtures — improves functionality and aesthetics
- Resale new exterior paint — enhances curb appeal and property value
- Resale new flooring — creates a more inviting and functional living space
- Both HVAC system upgrade — improves comfort and energy efficiency
Renovation cost estimate screening
| Repair item | Severity | Est. cost |
|---|---|---|
| kitchen cabinets · poor condition | Major | $15,000–50,000 |
| bathroom fixtures · damaged and missing | Major | $15,000–50,000 |
| exterior paint · chipped and peeling | Major | $15,000–50,000 |
| flooring · damaged and worn | Major | $15,000–50,000 |
| interior walls · peeling paint | Major | $15,000–50,000 |
| Total estimated repair cost · 5 items | $75,000–250,000 |
Value-add ROI direction
- Resale new kitchen cabinets — modernizes the space and adds value ↑
- Resale new bathroom fixtures — improves functionality and aesthetics ↑
- Resale new exterior paint — enhances curb appeal and property value ↑
- Resale new flooring — creates a more inviting and functional living space ↑
- Both HVAC system upgrade — improves comfort and energy efficiency ↑
ⓘ Cost ranges are severity-bucket heuristics (US national rule-of-thumb). Get contractor quotes + a written scope before underwriting a rehab budget.
Schools (NCES district)
No district data.
Livability — Orangeburg
- Score
- 54/100
- State rank
- #324
- US rank
- #23942
Category grades
Schools grade is shown separately in the Schools card above.
Census & demographics
- Census place
- Orangeburg, SC
- City population
- 15,135
- Population (ZIP)
- 27,179
Population outlook (Orangeburg County) Hauer SSP2
- Today (2025)
- 82,698 people
- By 2030
- 78,615 · -4.9%
- By 2040
- 69,308 · -16.2%
- By 2050
- 60,629 · -26.7%
- By 2075
- 42,678 · -48.4%
- By 2100
- 28,136 · -66.0%
Race, ethnicity, and origin ACS 2023
- Neighborhood character
- Predominantly Black (76%)
- Race & ethnicity
- Black 76% White 20% Hispanic / Latino 2% Two or more races 2%
- Foreign-born
- 2% · Canada
- Languages at home
- 97% English-only · Spanish 2%
Political lean MEDSL · Orangeburg
- 2024 margin
- Strong D (+24.6) · D 61.8% · R 37.2% · Other 1.1%
- 2008→2024 swing
- -13.5pp toward R · 2008: 38.1pp · 2024: 24.6pp
- All cycles
- 2024: D+24.6 2020: D+33.2 2016: D+37.0 2012: D+43.5 2008: D+38.1
Not yet ingested
- Civics
- —
Market trends
- HPI YoY
- ▼ -56.65%
- Current HPI
- 150.823
- Rent YoY
- —
- Metro
- —
- State GDP YoY
- ▲ 4.51%
- F500 in state
- 2
Industry mix (Fortune 500 HQ in SC)
| Industry | F500 HQs | Revenue |
|---|---|---|
| Packaging | 1 | $7B |
|
||
Price history
+7.1% since first listed4 events — show timeline
- 2026-04-22 Relisted — CANOPYMLS as Distributed by MLS Grid
- 2026-04-22 Price Changed $150,000 CANOPYMLS as Distributed by MLS Grid
- 2026-04-02 Contingent — CANOPYMLS as Distributed by MLS Grid
- 2026-03-30 Listed $140,000 CANOPYMLS as Distributed by MLS Grid
Cash-flow waterfall
monthlySold comps — $/sqft
last 12 mo · ≤1 miLoading sold comps…