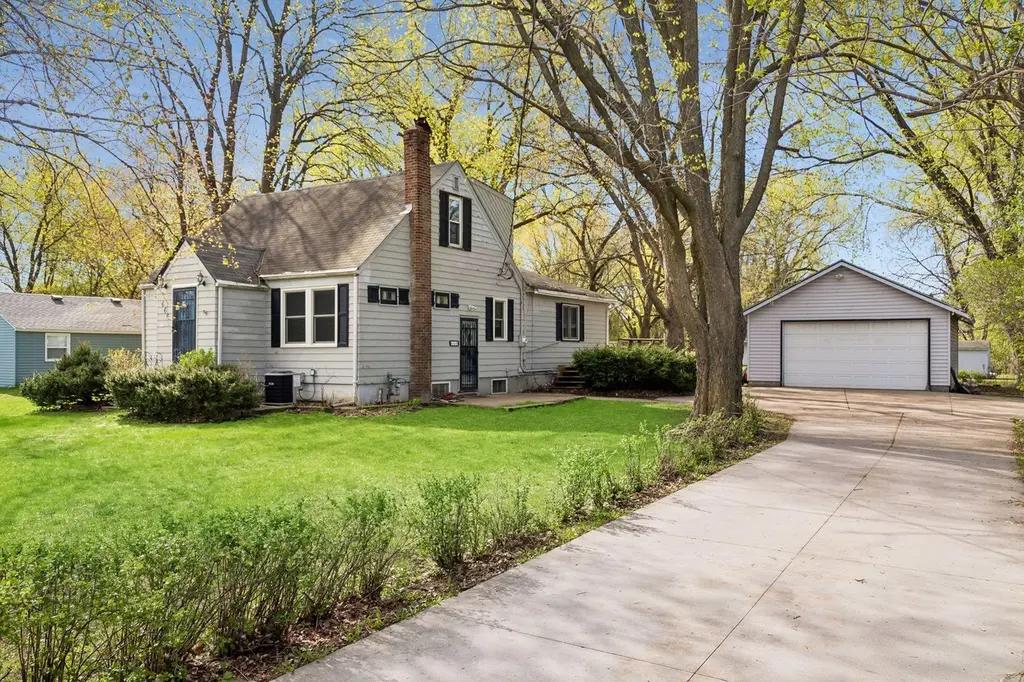
660 County Road D E · Little Canada, MN
Flood risk 3/10 · Minor
- FEMA flood zone
- X (unshaded)
- Chance of flooding over 30 yrs
- 0.2%
- Est. flood insurance / yr
- $473 – $860
Fire risk 1/10 · Minimal
- Est. fire insurance / yr
- $888 – $1,650
Heat risk 2/10 · Minimal
- Hot days now (above 100°F)
- 7 days/yr
- Hot days in 30 yrs
- 14 days/yr
Wind risk 2/10 · Minimal
- Chance of severe wind over 30 yrs
- —
Air-quality risk 2/10 · Minimal
- Unhealthy air days now
- 1 days/yr
- Unhealthy air days in 30 yrs
- 1 days/yr
Risk factors via First Street. Map © Google.
Why this score? — see what drove the C- grade
The composite is a weighted blend of 9 inputs, each scored 0–100. Each bar is that input's sub-score; the figure is the points it added to the 100-point composite (weight × sub-score).
- Cash flow +15.6/30.0
- ARV discount +15.0/15.0
- DSCR +4.8/10.0
- 1% rule +4.5/10.0
- Schools +3.9/10.0
- Livability +3.9/5.0
- Rent growth +3.4/5.0
- Condition / age +2.5/5.0
- Appreciation +0.0/10.0
$249,900
🖨 Deal sheet (PDF) 📄 Offer letter ✓ Due diligence
Listing remarks
Back on the market due to buyer being unable to secure financing. Rare opportunity to own over an acre in an area where lots like this are nearly unheard of! This 2+ bedroom home offers two main floor baths, hardwood floors, and a cozy gas-burning fireplace. Bring your ideas to renovate, expand, or build equity and make it your own. Recent mechanical updates include a newer furnace and A/C (just one year old), adding peace of mind. Two sheds provide additional storage, all set on a hard-to-find lot with endless possibilities.
Key facts
- Newer furnace
- Newer a/c
- Over an acre
Tags
Property features AI
Exterior
- Parking: Detached or attached garage with asphalt approach and garage door opener; 2-car garage (approximately 21 x 27 feet, 9-foot door height)
- Utilities: City water (connected); City sewer (connected); Natural gas; Electrical service with circuit breakers (100 amp)
- Home design: Residential property; One and one-half level layout; Deck and wrap-around porch
- Construction: Block construction; Asphalt roof; Block foundation; Built with finished and unfinished below-grade areas
- Exterior features: Wrap-around deck; Screened porch; Wood exterior; Storage shed; Light tree coverage
Interior
- Kitchen: Range; Refrigerator; Microwave; Eat-in kitchen layout
- Bedrooms: 2 bedrooms (one on the main level, one on the upper level)
- Flooring: Hardwood floors; Tile floors
- Bathrooms: One full bathroom on the main level; One three-quarter bathroom on the main level
- Heating & cooling: Forced air heating; Central air conditioning
- Interior features: Ceiling fans; Hardwood and tile floors; Walk-in closet; Family room with gas fireplace; Main floor bedroom; Eat-in kitchen / informal dining area
- Laundry & utility: Washer and dryer; Laundry located in basement
Neighborhood map
What this means for you Summary
Snapshot
- This is a 3-bed/2.0-bath single-family listed at $250k.
Deal economics
- At list price, monthly cash flow is $103 ($1k/yr) — positive.
- The deal already cash-flows at list — no discount required.
- To meet the 1% rule (rent ≥ 1% of price), the offer needs to be $238k (4.8% below list).
- Recommended offer: $238k (4.8% below list) — sets the bar for 1% rule.
- Cap rate 6.8% vs local median 3.5% in Little Canada — top-decile yield for the area; either an underpriced asset or a hidden risk that comps aren't pricing in. Stress-test before assuming the spread holds.
Location & tenants
- Location reads 78/100 on livability (#109 in MN, #2,510 nationally) — a middle-class / working-renter tenant base. Strengths: commute A+, housing A+, crime A-; Watch: amenities F.
- Roseville Public School District (suburban): math 37% / reading 53% proficiency, ranked #170 of 301 in MN (top 56%) — families likely to look elsewhere, expect single-tenant / working-renter base with shorter leases.
- Zoned schools: Parkview Center School (math 52% / reading 69%, grade B-, #203 of 857 statewide, top 24%, 717 students, 33% FRL); Roseville Area Middle (math 24% / reading 48%, grade F, #170 of 258 statewide, top 66%, 828 students, 58% FRL); Roseville Area Senior High (math 42% / reading 69%, grade C, #80 of 471 statewide, top 17%, 2,327 students, 48% FRL).
- Market conditions: Rents rising (+3.6%/yr); 175 active listings in the ZIP; 10 comparable units currently listed for rent nearby; rentals at typical pace (median 17d on market — plan ~3-4 weeks tenant-placement turnaround); 1,202 units permitted in Ramsey County in 2024 (880 in 5+ unit buildings).
- This rent runs 40% of the median local income ($71k/yr) — at the standard rent-burdened threshold; future hikes will face affordability resistance.
Forward outlook
- Local home prices are declining (-3.0%/yr); year-one equity from $2k of loan paydown is wiped out by about $7k of value loss. Plan a longer hold.
- Ramsey County population projected at +27% by 2050 — long-run rental-demand tailwind backs the buy-and-hold thesis.
Negotiation context
- It's been on market 21 days — a 2% lower offer ($246k) is reasonable based on typical stale-listing flexibility.
- 2 sale attempts; this cycle's ask has dropped $60k (19%) from the opening price — seller is motivated, your offer sets the floor, not the list.
- Current owner paid $210k; 19% above their basis — modest negotiation headroom, anchor on the comps not their cost.
Risks & watch-outs
- Watch-outs: built in 1940 — expect roof / HVAC / electrical / plumbing capex.
Questions for the listing agent
- Built in 1940 — when were the roof, HVAC, electrical panel, plumbing, and water heater last replaced?
- Is there a deadline driving the sale (1031 exchange, divorce, estate, relocation)? That informs how much negotiation room exists.
- What's the average days-on-market for RENTAL listings here right now (not sales)? A rising rental-DOM trend means longer vacancies and softer asking-rent achievability than the comps imply.
- What's the recent tenant-quality profile in this submarket — average credit score on applications, eviction rate, late-payment / NSF rate, and stable-employment percentage? A property-management company in the area should have these aggregated.
- How much new for-sale + rental construction is in the pipeline within 1–3 miles? Heavy new supply typically softens prices + rents 12–24 months out; constrained supply supports both.
Investment metrics
- 1% rule
- 0.95% ✗
- Cap rate
- 6.79%
- Cash-on-cash
- 1.77%
- DSCR
- 1.08
- GRM
- 8.7
CMA / ARV
- ARV (median comp)
- $351,233
- List price
- $249,900
- Delta
- -28.85%
- Verdict
- UNDERPRICED
- Comps
- 3 within 1.0 mi
Show comp detail 1 sale within ~0.75 mi
| Address | Dist | Beds/Ba | Sqft | Sold | Price | $/sf | Match |
|---|---|---|---|---|---|---|---|
| 3222 Greenbrier St | 0.27mi | 3/2.0 | 1,724 (+12%) | 3mo | $349,900 | $203 | 65 |
Match score weights: distance 35% · size 25% · config 20% · recency 20%. Top-matched comps best support the ARV.
Projected returns pro-forma
-3.0% appreciation · 3.6% rent growth · sell at horizon
- IRR
- -12.8%
- Equity multiple
- 0.54×
- Total profit
- $-32,426
- Equity at exit
- $37,261
- IRR
- -2.8%
- Equity multiple
- 0.81×
- Total profit
- $-13,517
- Equity at exit
- $21,607
Cash invested: $69,972 (down + closing). Projections, not guarantees.
Landlord ↔ Tenant lean methodology
- Overall (STATE)
- 46 Balanced
- State Minnesota
- 46 Balanced · D+2
- County
- — inherits STATE
- City
- — inherits STATE
ZIP-level market 55117
- Rents YoY
- 3.6%
- Active inventory
- 175
- Price-to-rent
- 8.7×
Monthly cashflow live
- Estimated rent
- $2,380 high interval (Pro) →
- Mortgage (P&I)
- −$1,311
- Tax from tax record
- −$363 /mo · $4,354/yr
- Insurance
- −$104
- HOA
- −$0
- Vacancy / Maint / Mgmt
- −$500
- Net cashflow
- $103
Break-even live
Sensitivity live
| Price | -10% $244 | -5% $174 | +0% $103 | +5% $32 | +10% $-39 |
|---|---|---|---|---|---|
| Rent | -10% $-85 | -5% $9 | +0% $103 | +5% $197 | +10% $291 |
| Rate | -1.0pp $229 | -0.5pp $167 | base $103 | +0.5pp $38 | +1.0pp $-28 |
UW: 25.0% down · 7.5% · 30yr · 1.5% tax · 5.0% vac · 8.0% maint · 8.0% mgmt
Financing live
Cash to close
- Down payment
- $62,475
- Closing costs
- $7,497
- Reserves months
- —
- Total cash needed
- —
Loan-product check · same deal, 3 products live
Conventional
25% down · 7.5% · 30yr
- Down + closing
- —
- Monthly P&I
- —
- Monthly cashflow
- —
- DSCR
- —
- Eligible?
- —
Personal DTI + credit; lowest rate.
DSCR
20% down · 8.5% · 30yr
- Down + closing
- —
- Monthly P&I
- —
- Monthly cashflow
- —
- DSCR
- —
- Eligible?
- —
No personal income docs; deal must DSCR.
Hard money
10% down · 12.0% · 12mo
- Down + closing
- —
- Monthly P&I
- —
- Monthly cashflow
- —
- DSCR
- —
- Eligible?
- —
Short-term bridge; refi at stabilization.
Rent comps 10 comps
| Address | Beds | Baths | Sqft | Rent | $/sqft | DOM | Units | Dist |
|---|---|---|---|---|---|---|---|---|
| 631 Liberty Way Saint Paul, MN | 2.0 | 2.0 | 1471 | $2,895 | $1.97 | 16d | 1 | 0.12mi |
| 768 Manor St Saint Paul, MN | 4.0 | 2.0 | 1650 | $2,500 | $1.52 | 45d | 1 | 0.28mi |
| 3040 Basswood St Unit A Little Canada, MN | 3.0 | 3.0 | 1777 | $2,800 | $1.58 | 16d | 1 | 0.37mi |
| 750 W Berwood Ave Vadnais Heights, MN | 4.0 | 2.0 | 1460 | $2,700 | $1.85 | 0d | 1 | 0.50mi |
| 2955 Arcade St Saint Paul, MN | 2.0 | 1.5 | 1122 | $2,000 | $1.78 | 26d | 1 | 0.50mi |
| Parkside Village (Arcade, Bella, Berwood, Greta) Vadnais Heights, MN | 2.0 | 2.0 | 1255 | $2,100 | $1.67 | 6d | 1 | 0.53mi |
| 3334 Arcade St S Saint Paul, MN | 2.0 | 2.0 | 1255 | $2,100 | $1.67 | 19d | 1 | 0.54mi |
| 826 Greta Ln Saint Paul, MN | 2.0 | 2.0 | 1255 | $2,100 | $1.67 | 6d | 1 | 0.56mi |
| 396 Labore Rd Saint Paul, MN | 3.0 | 1.0–1.5 | 775 | $1,815 | $2.34 | 14d | 25 | 0.81mi |
| 1255 County Road D Cir St Paul, MN | 3.0 | 2.0 | 1205 | $1,650 | $1.37 | 25d | 1 | 1.24mi |
Listing history 4 events
-
2026-05-12status Active 532-char remark
-
2026-05-12price $285,000 532-char remark
-
2026-05-04status Pending 532-char remark
-
2026-04-30$310,000 Active 532-char remark
ⓘ Source: listings_history table (triggers on properties + properties_extension) + one-shot
backfill from property_details.listing_events for pre-trigger history.
Tax reassessment forecast MN · Partial reset (capped growth)
- Current annual tax
- $4,354 · $363/mo
- Projected year-2 tax
- $4,354 · $363/mo
- Expected delta
- $0/yr ($0/mo · 0.0%)
ⓘ Screening estimate from a state-policy table — verify with the county assessor before closing.
Climate risk First Street
- Flood 3/10 Moderate FEMA zone X (unshaded) · 20% chance over 30 yrs
- Wildfire 1/10 Low
- Heat 2/10 Low 7 d/yr ≥100°F today · 14 d/yr by 30 yrs out
- Wind 2/10 Low
- Air quality 2/10 Low 1 unhealthy d/yr today · 1 by 30 yrs out
Nearby sold comps map
Loading sold comps map…
Walkable amenities ~0.75 mi
Loading nearby amenities…
Taxation est. · year 1
- Rental income
- $28,563
- − Mortgage interest
- −$13,998
- − Property taxes
- −$4,354
- − Insurance
- −$1,250
- − Repairs & maintenance
- −$2,285
- − Management
- −$2,285
- − Depreciation
- −$7,270
- Taxable loss
- −$2,879
- Est. tax savings @ 24.0%
- +$691
- After-tax cash flow
- $1,926/yr
For passive investors: Depreciation is non-cash, so a rental often shows a tax loss while cash-flowing — sheltering income. Rental losses are passive: they offset passive income freely, and up to $25,000/yr can offset ordinary (W-2) income if you actively participate and your MAGI is under $100k (phasing out to $0 by $150k); unused losses carry forward. On sale, claimed depreciation is recaptured at up to 25%, and gains may owe capital-gains tax (a 1031 exchange can defer both). Figures are a year-1 estimate at your 24.0% rate — not tax advice; consult a CPA.
Schools (NCES district)
- District
- Roseville Public School District
- NCES district ID
- 2732430
- Math proficiency
- 37% ▼ -12.00%
- Reading proficiency
- 53% ▼ -3.00%
- Median HH income
- $57,709
- Composite
- 39.32/100
- National rank
- #3988
- State rank
- #170 of 301 in MN
Livability — Little Canada
- Score
- 78/100
- State rank
- #109
- US rank
- #2510
Category grades
Schools grade is shown separately in the Schools card above.
Census & demographics
- Census place
- Little Canada, MN
- County
- Ramsey County · 542,837 people
- Metro
- Minneapolis-St. Paul-Bloomington, MN-WI
- Population (ZIP)
- 44,697
- Household income
- $70,771
- Rent vs Own
- Severe rent burden
- 1588.0
Population outlook (Ramsey County) Hauer SSP2
- Today (2025)
- 603,431 people
- By 2030
- 636,459 · +5.5%
- By 2040
- 700,596 · +16.1%
- By 2050
- 765,819 · +26.9%
- By 2075
- 929,297 · +54.0%
- By 2100
- 1,053,924 · +74.7%
Race, ethnicity, and origin ACS 2023
- Neighborhood character
- Highly diverse neighborhood (Simpson 0.72)
- Race & ethnicity
- White 44% Asian 24% Black 15% Hispanic / Latino 10% Two or more races 10%
- Hispanic origin (detail)
- Mexican 7%
- Common ancestry
- Portuguese 6% Romanian 3% Lithuanian 2%
- Foreign-born
- 21% · Canada, Philippines, India
- Languages at home
- 68% English-only · Other Asian/Pacific 15% Spanish 8% Other Indo-European 2%
Political lean MEDSL · Ramsey
- 2024 margin
- Solid D (+43.3) · D 70.5% · R 27.2% · Other 2.3%
- 2008→2024 swing
- +9.4pp toward D · 2008: 33.9pp · 2024: 43.3pp
- All cycles
- 2024: D+43.3 2020: D+45.4 2016: D+39.4 2012: D+35.3 2008: D+33.9
Not yet ingested
- Civics
- —
Market trends
- HPI YoY
- ▼ -308.56%
- Current HPI
- 267.4216
- Rent YoY
- ▲ 3.60%
- Metro
- Minneapolis-St. Paul-Bloomington, MN-WI
- State GDP YoY
- ▲ 2.41%
- F500 in state
- 34
Industry mix (Fortune 500 HQ in MN)
| Industry | F500 HQs | Revenue |
|---|---|---|
| Healthcare | 2 | $407B |
|
||
| Retail | 2 | $150B |
|
||
| Consumer Goods | 2 | $32B |
|
||
| Industrial Machinery | 2 | $6B |
|
||
| Agriculture | 1 | $40B |
|
||
| Healthcare / Medical Devices | 1 | $32B |
|
||
Price history
-32.3% since first listed7 events — show timeline
- 2026-06-05 Sold (MLS) $210,000 NORTHSTARMLS as Distributed by MLS Grid
- 2026-05-29 Pending — NORTHSTARMLS as Distributed by MLS Grid
- 2026-05-26 Price Changed $249,900 NORTHSTARMLS as Distributed by MLS Grid
- 2026-05-12 Relisted — NORTHSTARMLS as Distributed by MLS Grid
- 2026-05-12 Price Changed $285,000 NORTHSTARMLS as Distributed by MLS Grid
- 2026-05-04 Pending — NORTHSTARMLS as Distributed by MLS Grid
- 2026-04-30 Listed $310,000 NORTHSTARMLS as Distributed by MLS Grid
Property tax history
+5.6%/yrLatest (2025): $4,354 · +10.2% YoY. Source: county tax records.
Cash-flow waterfall
monthlySold comps — $/sqft
last 12 mo · ≤1 miLoading sold comps…