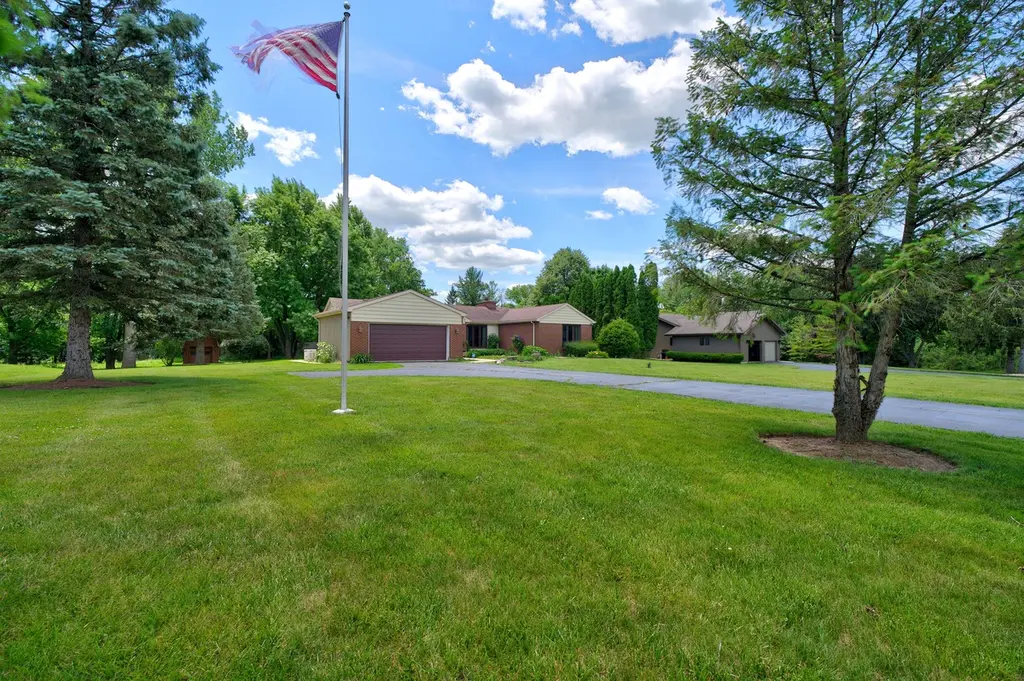
14385 W Sheryl Lynn Dr · Wadsworth, IL
Flood risk 1/10 · Minimal
- FEMA flood zone
- X (unshaded)
- Chance of flooding over 30 yrs
- 0.0%
- Est. flood insurance / yr
- $473 – $860
Fire risk 3/10 · Minor
- Est. fire insurance / yr
- $804 – $1,492
Heat risk 2/10 · Minimal
- Hot days now (above 98°F)
- 7 days/yr
- Hot days in 30 yrs
- 13 days/yr
Wind risk 2/10 · Minimal
- Chance of severe wind over 30 yrs
- —
Air-quality risk 3/10 · Minor
- Unhealthy air days now
- 2 days/yr
- Unhealthy air days in 30 yrs
- 3 days/yr
Risk factors via First Street. Map © Google.
Why this score? — see what drove the D- grade
The composite is a weighted blend of 9 inputs, each scored 0–100. Each bar is that input's sub-score; the figure is the points it added to the 100-point composite (weight × sub-score).
- Cash flow +12.8/30.0
- ARV discount +5.0/15.0
- DSCR +3.8/10.0
- Schools +3.7/10.0
- 1% rule +3.5/10.0
- Livability +3.5/5.0
- Rent growth +2.5/5.0
- Condition / age +2.5/5.0
- Appreciation +0.0/10.0
$345,000
🖨 Deal sheet (PDF) 📄 Offer letter ✓ Due diligence
Listing remarks MLS
A CUSTOM DESIGN RANCH IN THE COUNTRY, ONE OWNER, ALSO THE BUILDER, EAT IN KITCHEN W/BAY WINDOW, WOOD BURNING FIREPLACE IN LR, SPACIOUS BEDROOMS. FULL BASEMENT W/3RD BEDROOM, FULL BATH & FAMILY ROOM, UTILITY ROOM/ HOBBY ROOM. GARAGE HAS BUILT IN CUBOARDS & WORK BENCH. NICE STORAGE SHED 12X16 BEAUTIFUL SETTING IN A CUL-DE-SAC ALL ON 1 ACRE.
Key facts
- Long driveway
- Custom brick ranch
- 0.97 acre lot
Tags
Property features AI
Finance
- Other: Possession at closing; Earnest money held
- Financial info: Tax exemptions noted (Senior, Senior Freeze)
- HOA & community: No master association fee required
Exterior
- Parking: Attached garage owned (2 garage spaces, 2 total parking spaces)
- Security: Security system
- Utilities: Well water; Septic tank; Electric service with circuit breakers
- Home design: Detached single-family home; One-story layout with finished lower level; Fee simple ownership
- Construction: Brick construction; Built 41–50 years ago; Approximately 3,252 total finished square feet (builder source); Finished below-grade area
- Exterior features: Approximately 1.0–1.99 acre lot (dimensions 140 x 303)
Interior
- Kitchen: Kitchen on main level (9 x 16) with ceramic tile flooring
- Bedrooms: Master bedroom on main level (14 x 14) with hardwood flooring; Second bedroom on main level (10 x 14) with hardwood flooring; Additional bedroom(s) and bonus room available (bonus room in basement, 16 x 16, carpet)
- Flooring: Hardwood flooring in living room and main bedrooms; Ceramic tile in kitchen; Carpet in bonus room and other areas
- Bathrooms: 2 full bathrooms; 1 half bathroom; Basement has bathroom access
- Heating & cooling: Steam and baseboard heating; Central air conditioning
- Interior features: Open floorplan; Security system; CO detectors; Ceiling fans; Sump pump; Generator; Electric water heater; Finished full basement; One wood-burning fireplace in the living room; 5 total rooms
- Laundry & utility: Laundry room in basement (17 x 18)
Neighborhood map
What this means for you Summary
Snapshot
- This is a 3-bed/3.0-bath single-family listed at $345k.
Deal economics
- At list price, monthly cash flow is $-29 ($-347/yr) — negative.
- To cash-flow at today's rent, offer at most $340k (1.5% below list).
- To meet the 1% rule (rent ≥ 1% of price), the offer needs to be $294k (14.9% below list).
- Recommended offer: $294k (14.9% below list) — sets the bar for 1% rule.
Location & tenants
- Location reads 69/100 on livability (#411 in IL) — a middle-class / working-renter tenant base. Strengths: crime A+, employment A+, housing A+; Watch: amenities F, commute F, cost of living D-.
- Warren Twp Hsd 121 (suburban): math 34% / reading 43% proficiency, ranked #124 of 620 in IL (top 20%) — families likely to look elsewhere, expect single-tenant / working-renter base with shorter leases.
- Zoned schools: Warren Township High School (math 34% / reading 43%, grade F, #100 of 693 statewide, top 15%, 3,758 students, 0% FRL).
- Market conditions: 47 active listings in the ZIP; 2 comparable units currently listed for rent nearby; 948 units permitted in Lake County in 2024 (424 in 5+ unit buildings).
Forward outlook
- Local home prices are declining (-3.0%/yr); year-one equity from $2k of loan paydown is wiped out by about $10k of value loss. Plan a longer hold.
- Lake County population projected to shrink 8% by 2050 — rents likely to lag national; underwrite the cash flow, not the appreciation.
Negotiation context
- Only 4 days on market — expect competitive offers; lowballing is unlikely to land.
- 2 sale attempts since 19y ago with the ask held roughly flat each time — persistent listings suggest the price (not the market) is what's stuck; bring a comps-based counter.
- Current owner paid $285k; 21% above their basis — modest negotiation headroom, anchor on the comps not their cost.
Questions for the listing agent
- What do current leases actually rent for vs. the listed asking? Can we see a recent rent roll and the last 12 months of T-12 income?
- Is there a deadline driving the sale (1031 exchange, divorce, estate, relocation)? That informs how much negotiation room exists.
- Schools are D-rated, which usually means shorter tenancies and higher turnover. Who's the typical renter profile here, and what's been the actual vacancy rate?
- The area grade is low — what's the realistic commute time and amenity access for the typical tenant pool here? Any planned neighborhood developments (good or bad) we should know about?
- What's the average days-on-market for RENTAL listings here right now (not sales)? A rising rental-DOM trend means longer vacancies and softer asking-rent achievability than the comps imply.
- What's the recent tenant-quality profile in this submarket — average credit score on applications, eviction rate, late-payment / NSF rate, and stable-employment percentage? A property-management company in the area should have these aggregated.
- How much new for-sale + rental construction is in the pipeline within 1–3 miles? Heavy new supply typically softens prices + rents 12–24 months out; constrained supply supports both.
Investment metrics
- 1% rule
- 0.85% ✗
- Cap rate
- 6.19%
- Cash-on-cash
- -0.36%
- DSCR
- 0.98
- GRM
- 9.8
CMA / ARV
- ARV (on-the-fly)
- $326,880
- Comps found
- 3
Show comp detail 3 sales within ~0.75 mi
| Address | Dist | Beds/Ba | Sqft | Sold | Price | $/sf | Match |
|---|---|---|---|---|---|---|---|
| 39325 N Winchester Rd | 0.56mi | 3/2.0 | 1,374 (+1%) | 18mo | $330,000 | $240 | 53 |
| 39160 N Winchester Rd | 0.52mi | 3/2.0 | 1,337 (-2%) | 20mo | $320,000 | $239 | 52 |
| 14440 W Jody Ln | 0.19mi | 4/3.0 (+1) | 1,526 (+12%) | 24mo | $445,000 | $292 | 46 |
Match score weights: distance 35% · size 25% · config 20% · recency 20%. Top-matched comps best support the ARV.
Projected returns pro-forma
-3.0% appreciation · 3.0% rent growth · sell at horizon
- IRR
- -16.9%
- Equity multiple
- 0.40×
- Total profit
- $-57,724
- Equity at exit
- $51,441
- IRR
- -8.7%
- Equity multiple
- 0.46×
- Total profit
- $-52,545
- Equity at exit
- $29,829
Cash invested: $96,600 (down + closing). Projections, not guarantees.
Landlord ↔ Tenant lean methodology
- Overall (STATE)
- 43 Moderately Tenant-Leaning
- State Illinois
- 43 Moderately Tenant-Leaning · D+7
- County
- — inherits STATE
- City
- — inherits STATE
ZIP-level market 60083
- Home prices YoY
- -16.2%
- Active inventory
- 47
- Price-to-rent
- 9.8×
Monthly cashflow live
- Estimated rent
- $2,937 medium interval (Pro) →
- Mortgage (P&I)
- −$1,809
- Tax from tax record
- −$396 /mo · $4,756/yr
- Insurance
- −$144
- HOA
- −$0
- Vacancy / Maint / Mgmt
- −$617
- Net cashflow
- $-29
Break-even live
Sensitivity live
| Price | -10% $166 | -5% $69 | +0% $-29 | +5% $-127 | +10% $-224 |
|---|---|---|---|---|---|
| Rent | -10% $-261 | -5% $-145 | +0% $-29 | +5% $87 | +10% $203 |
| Rate | -1.0pp $145 | -0.5pp $59 | base $-29 | +0.5pp $-118 | +1.0pp $-209 |
UW: 25.0% down · 7.5% · 30yr · 1.5% tax · 5.0% vac · 8.0% maint · 8.0% mgmt
Financing live
Cash to close
- Down payment
- $86,250
- Closing costs
- $10,350
- Reserves months
- —
- Total cash needed
- —
Loan-product check · same deal, 3 products live
Conventional
25% down · 7.5% · 30yr
- Down + closing
- —
- Monthly P&I
- —
- Monthly cashflow
- —
- DSCR
- —
- Eligible?
- —
Personal DTI + credit; lowest rate.
DSCR
20% down · 8.5% · 30yr
- Down + closing
- —
- Monthly P&I
- —
- Monthly cashflow
- —
- DSCR
- —
- Eligible?
- —
No personal income docs; deal must DSCR.
Hard money
10% down · 12.0% · 12mo
- Down + closing
- —
- Monthly P&I
- —
- Monthly cashflow
- —
- DSCR
- —
- Eligible?
- —
Short-term bridge; refi at stabilization.
Rent comps 2 comps
| Address | Beds | Baths | Sqft | Rent | $/sqft | DOM | Units | Dist |
|---|---|---|---|---|---|---|---|---|
| 38955 N Delany Rd Wadsworth, IL | 3.0 | 1.5 | 1478 | $3,000 | $2.03 | 0d | 1 | 0.60mi |
| 4810 Eastwood Ct Waukegan, IL | 3.0 | 2.5 | 1800 | $2,750 | $1.53 | 0d | 1 | 1.46mi |
Listing history 3 events
-
2026-06-21days on market $345,000 Active 4 DOM
-
2026-06-17remarks 699-char remark
-
2026-06-17$345,000 Active 1 DOM
ⓘ Source: listings_history table (triggers on properties + properties_extension) + one-shot
backfill from property_details.listing_events for pre-trigger history.
Tax reassessment forecast IL · Partial reset (capped growth)
- Current annual tax
- $4,756 · $396/mo
- Projected year-2 tax
- $6,294 · $524/mo
- Expected delta
- +$1,538/yr (+$128/mo · 32.3%)
ⓘ Screening estimate from a state-policy table — verify with the county assessor before closing.
Climate risk First Street
- Flood 1/10 Low FEMA zone X (unshaded) · 0% chance over 30 yrs
- Wildfire 3/10 Moderate
- Heat 2/10 Low 7 d/yr ≥98°F today · 13 d/yr by 30 yrs out
- Wind 2/10 Low
- Air quality 3/10 Moderate 2 unhealthy d/yr today · 3 by 30 yrs out
Nearby sold comps map
Loading sold comps map…
Walkable amenities ~0.75 mi
Loading nearby amenities…
Taxation est. · year 1
- Rental income
- $35,246
- − Mortgage interest
- −$19,325
- − Property taxes
- −$4,756
- − Insurance
- −$1,725
- − Repairs & maintenance
- −$2,820
- − Management
- −$2,820
- − Depreciation
- −$10,036
- Taxable loss
- −$6,236
- Est. tax savings @ 24.0%
- +$1,497
- After-tax cash flow
- $1,150/yr
For passive investors: Depreciation is non-cash, so a rental often shows a tax loss while cash-flowing — sheltering income. Rental losses are passive: they offset passive income freely, and up to $25,000/yr can offset ordinary (W-2) income if you actively participate and your MAGI is under $100k (phasing out to $0 by $150k); unused losses carry forward. On sale, claimed depreciation is recaptured at up to 25%, and gains may owe capital-gains tax (a 1031 exchange can defer both). Figures are a year-1 estimate at your 24.0% rate — not tax advice; consult a CPA.
Schools (NCES district)
- District
- Warren Twp Hsd 121
- NCES district ID
- 1740800
- Math proficiency
- 34% ▼ -8.00%
- Reading proficiency
- 43% ▼ -5.00%
- Median HH income
- $86,523
- Composite
- 36.71/100
- National rank
- #4595
- State rank
- #124 of 620 in IL
Livability — Wadsworth
- Score
- 69/100
- State rank
- #411
- US rank
- #8458
Category grades
Schools grade is shown separately in the Schools card above.
Census & demographics
- Census place
- Wadsworth, IL
- Population (ZIP)
- 9,655
Population outlook (Lake County) Hauer SSP2
- Today (2025)
- 700,217 people
- By 2030
- 693,290 · -1.0%
- By 2040
- 673,588 · -3.8%
- By 2050
- 643,556 · -8.1%
- By 2075
- 562,792 · -19.6%
- By 2100
- 457,715 · -34.6%
Race, ethnicity, and origin ACS 2023
- Neighborhood character
- Diverse neighborhood (Simpson 0.65)
- Race & ethnicity
- White 50% Hispanic / Latino 28% Two or more races 14% Black 10% Asian 9%
- Hispanic origin (detail)
- Mexican 22% Puerto Rican 4%
- Common ancestry
- Romanian 9% Lithuanian 2% Slovak 2%
- Foreign-born
- 19% · Canada, South Korea, China
- Languages at home
- 70% English-only · Spanish 21% Tagalog/Filipino 3% Other Indo-European 2%
Political lean MEDSL · Lake
- 2024 margin
- Strong D (+20.8) · D 59.7% · R 38.9% · Other 1.4%
- 2008→2024 swing
- +1.1pp toward D · 2008: 19.6pp · 2024: 20.8pp
- All cycles
- 2024: D+20.8 2020: D+24.1 2016: D+20.3 2012: D+8.1 2008: D+19.6
Not yet ingested
- Civics
- —
Market trends
- HPI YoY
- ▼ -39.49%
- Current HPI
- 203.6911
- Rent YoY
- —
- Metro
- —
- State GDP YoY
- ▲ 1.59%
- F500 in state
- 60
Industry mix (Fortune 500 HQ in IL)
| Industry | F500 HQs | Revenue |
|---|---|---|
| Insurance | 4 | $201B |
|
||
| Consumer Goods | 4 | $87B |
|
||
| Industrial Machinery | 3 | $64B |
|
||
| Healthcare | 2 | $55B |
|
||
| Retail / Pharmacy | 1 | $148B |
|
||
| Agriculture / Food | 1 | $86B |
|
||
Price history
+19.0% since first listed5 events — show timeline
- 2026-06-17 Listed $345,000 MRED as Distributed by MLS Grid
- 2007-05-15 Sold (Public Records) $285,000 Public Records
- 2007-04-30 Sold (MLS) $285,000 MRED as Distributed by MLS Grid
- 2007-03-16 Listing Removed — MRED as Distributed by MLS Grid
- 2007-02-09 Listed $289,900 MRED as Distributed by MLS Grid
Property tax history
-0.5%/yrLatest (2024): $4,756 · -6.2% YoY. Source: county tax records.
Cash-flow waterfall
monthlySold comps — $/sqft
last 12 mo · ≤1 miLoading sold comps…