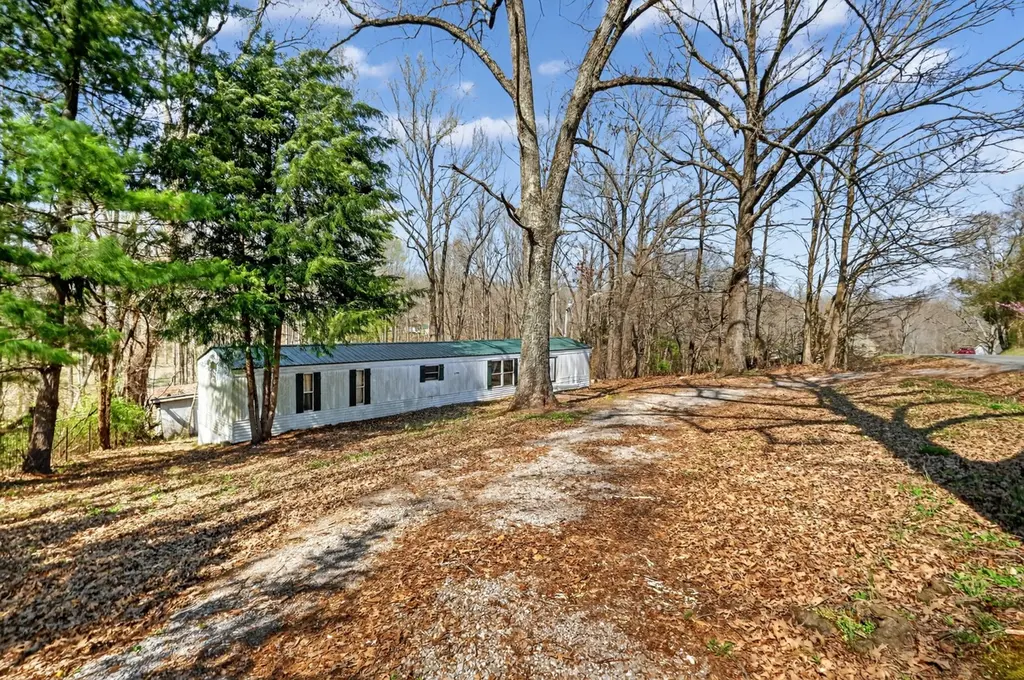
285 George Akins Rd · Westmoreland, TN
Flood risk 1/10 · Minimal
- FEMA flood zone
- X (unshaded)
- Chance of flooding over 30 yrs
- 0.0%
- Est. flood insurance / yr
- $507 – $1,088
Fire risk 3/10 · Minor
- Est. fire insurance / yr
- $949 – $1,763
Heat risk 5/10 · Moderate
- Hot days now (above 106°F)
- 7 days/yr
- Hot days in 30 yrs
- 20 days/yr
Wind risk 3/10 · Minor
- Chance of severe wind over 30 yrs
- 5.0%
Air-quality risk 2/10 · Minimal
- Unhealthy air days now
- 0 days/yr
- Unhealthy air days in 30 yrs
- 2 days/yr
Risk factors via First Street. Map © Google.
Why this score? — see what drove the B+ grade
The composite is a weighted blend of 9 inputs, each scored 0–100. Each bar is that input's sub-score; the figure is the points it added to the 100-point composite (weight × sub-score).
- Cash flow +30.0/30.0
- ARV discount +15.0/15.0
- 1% rule +10.0/10.0
- DSCR +10.0/10.0
- Schools +3.6/10.0
- Livability +3.4/5.0
- Appreciation +2.7/10.0
- Rent growth +2.5/5.0
- Condition / age +2.5/5.0
$89,000
🖨 Deal sheet (PDF) 📄 Offer letter ✓ Due diligence
Listing remarks MLS
Fixer-upper home offering a great opportunity for a rental or fix-and-flip project. Property is surrounded by trees in a quiet setting, providing privacy and a peaceful feel. Home appears to have solid bones and is ready for interior finishes to be completed. Selling as-is. Cash or in-house conventional financing only.
Key facts
- Solid bones
- Interior finishes
- Quiet setting
Tags
Neighborhood map
What this means for you Summary
Snapshot
- This is a 2-bed/1.0-bath other listed at $89k.
Deal economics
- At list price, monthly cash flow is $797 ($10k/yr) — positive.
- The deal already cash-flows at list — no discount required.
- Meets the 1% rule at list price ($2k rent vs $89k).
- Recommended offer: $86k (3.0% below list) — sets the bar for market timing.
- Cap rate 17.0% vs local median 4.3% in Westmoreland — top-decile yield for the area; either an underpriced asset or a hidden risk that comps aren't pricing in. Stress-test before assuming the spread holds.
Location & tenants
- Location reads 68/100 on livability (#91 in TN) — a middle-class / working-renter tenant base. Strengths: crime A+, cost of living A+, housing A+; Watch: amenities F, commute F, employment D-.
- Sumner County (suburban): math 44% / reading 39% proficiency, ranked #12 of 139 in TN (top 9%) — families likely to look elsewhere, expect single-tenant / working-renter base with shorter leases.
- Zoned schools: Union Elementary School (math 74% / reading 57%, grade B+, #37 of 952 statewide, top 4%, 576 students, 0% FRL); Westmoreland Middle School (math 39% / reading 28%, grade F, #73 of 333 statewide, top 23%, 430 students, 0% FRL); Westmoreland High School (math 27% / reading 37%, grade F, #56 of 332 statewide, top 20%, 526 students, 0% FRL) — zoned schools average 0% FRL vs 34% district-wide (34 pts lower); this property's tenant base skews higher-income than the district average.
- Market conditions: 145 active listings in the ZIP; 1,748 units permitted in Sumner County in 2024 (124 in 5+ unit buildings).
Forward outlook
- Local home prices are declining (-3.0%/yr); year-one equity from $615 of loan paydown is wiped out by about $3k of value loss. Plan a longer hold.
- Sumner County population projected at +35% by 2050 — long-run rental-demand tailwind backs the buy-and-hold thesis.
- At projected returns (-3.0% appreciation + 3.0% rent growth), your $25k cash investment doubles in ~4 years — after that, you're playing with house money.
Negotiation context
- It's been on market 46 days — a 3% lower offer ($86k) is reasonable based on typical stale-listing flexibility.
- 3 sale attempts since 8y ago with the ask held roughly flat each time — persistent listings suggest the price (not the market) is what's stuck; bring a comps-based counter.
- Current owner paid $73k; 22% above their basis — modest negotiation headroom, anchor on the comps not their cost.
Risks & watch-outs
- Climate carrying-cost: extreme-heat days projected 7→20/yr by 2055 (HVAC capex compounding) — expect insurance premiums to compound above CPI over the hold.
Questions for the listing agent
- It's been on market 46 days. Have you received any prior offers? Is the seller open to a 3% concession, seller financing, or rate buy-down credit?
- Is there a deadline driving the sale (1031 exchange, divorce, estate, relocation)? That informs how much negotiation room exists.
- Schools are D-rated, which usually means shorter tenancies and higher turnover. Who's the typical renter profile here, and what's been the actual vacancy rate?
- What's the average days-on-market for RENTAL listings here right now (not sales)? A rising rental-DOM trend means longer vacancies and softer asking-rent achievability than the comps imply.
- What's the recent tenant-quality profile in this submarket — average credit score on applications, eviction rate, late-payment / NSF rate, and stable-employment percentage? A property-management company in the area should have these aggregated.
- How much new for-sale + rental construction is in the pipeline within 1–3 miles? Heavy new supply typically softens prices + rents 12–24 months out; constrained supply supports both.
Investment metrics
- 1% rule
- 1.89% ✓
- Cap rate
- 17.04%
- Cash-on-cash
- 38.39%
- DSCR
- 2.71
- GRM
- 4.4
CMA / ARV
- ARV (median comp)
- $130,000
- List price
- $89,000
- Delta
- -31.54%
- Verdict
- UNDERPRICED
- Comps
- 2 within 2.0 mi
Projected returns pro-forma
-3.0% appreciation · 3.0% rent growth · sell at horizon
- IRR
- 34.5%
- Equity multiple
- 2.46×
- Total profit
- $36,324
- Equity at exit
- $13,270
- IRR
- 41.3%
- Equity multiple
- 4.89×
- Total profit
- $96,903
- Equity at exit
- $7,695
Cash invested: $24,920 (down + closing). Projections, not guarantees.
Landlord ↔ Tenant lean methodology
- Overall (STATE)
- 87 Strongly Landlord-Friendly
- State Tennessee
- 87 Strongly Landlord-Friendly · R+13
- County
- — inherits STATE
- City
- — inherits STATE
ZIP-level market 37186
- Home prices YoY
- -1.4%
- Active inventory
- 145
- Price-to-rent
- 4.4×
Monthly cashflow live
- Estimated rent
- $1,683 medium interval (Pro) →
- Mortgage (P&I)
- −$467
- Tax from tax record
- −$28 /mo · $342/yr
- Insurance
- −$37
- HOA
- −$0
- Vacancy / Maint / Mgmt
- −$353
- Net cashflow
- $797
Break-even live
Sensitivity live
| Price | -10% $848 | -5% $822 | +0% $797 | +5% $772 | +10% $747 |
|---|---|---|---|---|---|
| Rent | -10% $664 | -5% $731 | +0% $797 | +5% $864 | +10% $930 |
| Rate | -1.0pp $842 | -0.5pp $820 | base $797 | +0.5pp $774 | +1.0pp $751 |
UW: 25.0% down · 7.5% · 30yr · 1.5% tax · 5.0% vac · 8.0% maint · 8.0% mgmt
Financing live
Cash to close
- Down payment
- $22,250
- Closing costs
- $2,670
- Reserves months
- —
- Total cash needed
- —
Loan-product check · same deal, 3 products live
Conventional
25% down · 7.5% · 30yr
- Down + closing
- —
- Monthly P&I
- —
- Monthly cashflow
- —
- DSCR
- —
- Eligible?
- —
Personal DTI + credit; lowest rate.
DSCR
20% down · 8.5% · 30yr
- Down + closing
- —
- Monthly P&I
- —
- Monthly cashflow
- —
- DSCR
- —
- Eligible?
- —
No personal income docs; deal must DSCR.
Hard money
10% down · 12.0% · 12mo
- Down + closing
- —
- Monthly P&I
- —
- Monthly cashflow
- —
- DSCR
- —
- Eligible?
- —
Short-term bridge; refi at stabilization.
Listing history 13 events
-
2026-05-13status Pending 320-char remark
Show marketing remark (320 chars)
Fixer-upper home offering a great opportunity for a rental or fix-and-flip project. Property is surrounded by trees in a quiet setting, providing privacy and a peaceful feel. Home appears to have solid bones and is ready for interior finishes to be completed. Selling as-is. Cash or in-house conventional financing only.
-
2026-05-12status Pending 320-char remark
Show marketing remark (320 chars)
Fixer-upper home offering a great opportunity for a rental or fix-and-flip project. Property is surrounded by trees in a quiet setting, providing privacy and a peaceful feel. Home appears to have solid bones and is ready for interior finishes to be completed. Selling as-is. Cash or in-house conventional financing only.
-
2026-03-27$89,000 Active 320-char remark
Show marketing remark (320 chars)
Fixer-upper home offering a great opportunity for a rental or fix-and-flip project. Property is surrounded by trees in a quiet setting, providing privacy and a peaceful feel. Home appears to have solid bones and is ready for interior finishes to be completed. Selling as-is. Cash or in-house conventional financing only.
-
2026-01-30soldstatus $73,000
-
2019-02-21soldstatus $51,000
-
2019-02-15soldstatus $51,000 Closed
-
2019-01-22historical Contingent - Financing
-
2019-01-21status Pending
-
2018-12-15price $59,000
-
2018-10-10$79,900 Active
-
2005-04-29soldstatus $20,000
-
2003-11-26soldstatus $11,000
ⓘ Source: listings_history table (triggers on properties + properties_extension) + one-shot
backfill from property_details.listing_events for pre-trigger history.
Tax reassessment forecast TN · Resets to sale price
- Current annual tax
- $342 · $28/mo
- Projected year-2 tax
- $632 · $53/mo
- Expected delta
- +$290/yr (+$24/mo · 84.8%)
ⓘ Screening estimate from a state-policy table — verify with the county assessor before closing.
Climate risk First Street
- Flood 1/10 Low FEMA zone X (unshaded) · 0% chance over 30 yrs
- Wildfire 3/10 Moderate
- Heat 5/10 Major 7 d/yr ≥106°F today · 20 d/yr by 30 yrs out
- Wind 3/10 Moderate 5% chance of damaging wind over 30 yrs
- Air quality 2/10 Low 0 unhealthy d/yr today · 2 by 30 yrs out
Nearby sold comps map
Loading sold comps map…
Walkable amenities ~0.75 mi
Loading nearby amenities…
Taxation est. · year 1
- Rental income
- $20,194
- − Mortgage interest
- −$4,985
- − Property taxes
- −$342
- − Insurance
- −$445
- − Repairs & maintenance
- −$1,616
- − Management
- −$1,616
- − Depreciation
- −$2,589
- Taxable income
- $8,602
- Est. tax owed @ 24.0%
- −$2,064
- After-tax cash flow
- $7,501/yr
For passive investors: Depreciation is non-cash, so a rental often shows a tax loss while cash-flowing — sheltering income. Rental losses are passive: they offset passive income freely, and up to $25,000/yr can offset ordinary (W-2) income if you actively participate and your MAGI is under $100k (phasing out to $0 by $150k); unused losses carry forward. On sale, claimed depreciation is recaptured at up to 25%, and gains may owe capital-gains tax (a 1031 exchange can defer both). Figures are a year-1 estimate at your 24.0% rate — not tax advice; consult a CPA.
Schools (NCES district)
- District
- Sumner County
- NCES district ID
- 4704020
- Math proficiency
- 44% ▼ -11.00%
- Reading proficiency
- 39% ▼ -5.00%
- Median HH income
- $56,998
- Composite
- 36.44/100
- National rank
- #4667
- State rank
- #12 of 139 in TN
Livability — Westmoreland
- Score
- 68/100
- State rank
- #91
- US rank
- #9706
Category grades
Schools grade is shown separately in the Schools card above.
Census & demographics
- Population (ZIP)
- 10,644
Population outlook (Sumner County) Hauer SSP2
- Today (2025)
- 208,284 people
- By 2030
- 223,902 · +7.5%
- By 2040
- 253,892 · +21.9%
- By 2050
- 281,199 · +35.0%
- By 2075
- 344,866 · +65.6%
- By 2100
- 384,369 · +84.5%
Race, ethnicity, and origin ACS 2023
- Neighborhood character
- Predominantly White (92%)
- Race & ethnicity
- White 92% Two or more races 5% Asian 1% Hispanic / Latino 1%
- Common ancestry
- Slovak 2% Lithuanian 1% Serbian 1%
- Foreign-born
- 1%
- Languages at home
- 98% English-only · Other Indo-European 1% Spanish 1%
Political lean MEDSL · Sumner
- 2024 margin
- Solid R (+41.8) · D 28.5% · R 70.3% · Other 1.1%
- 2008→2024 swing
- -6.9pp toward R · 2008: -34.9pp · 2024: -41.8pp
- All cycles
- 2024: R+41.8 2020: R+38.6 2016: R+45.0 2012: R+42.0 2008: R+34.9
Not yet ingested
- Civics
- —
Market trends
- HPI YoY
- ▼ -4.60%
- Current HPI
- 336.4711
- Rent YoY
- —
- Metro
- —
- State GDP YoY
- ▲ 2.78%
- F500 in state
- 22
Industry mix (Fortune 500 HQ in TN)
| Industry | F500 HQs | Revenue |
|---|---|---|
| Healthcare | 3 | $91B |
|
||
| Retail | 3 | $72B |
|
||
| Transportation / Logistics | 1 | $88B |
|
||
| Paper / Packaging | 1 | $19B |
|
||
| Insurance | 1 | $13B |
|
||
| Energy | 1 | $12B |
|
||
Price history
+709.1% since first listed13 events — show timeline
- 2026-05-13 Pending — UCMLS
- 2026-05-12 Pending — REALTRACS as Distributed by MLS Grid
- 2026-03-27 Listed $89,000 REALTRACS as Distributed by MLS Grid
- 2026-03-27 Listed $89,000 UCMLS
- 2026-01-30 Sold (Public Records) $73,000 Public Records
- 2019-02-21 Sold (Public Records) $51,000 Public Records
- 2019-02-15 Sold (MLS) $51,000 REALTRACS as Distributed by MLS Grid
- 2019-01-22 Contingent — REALTRACS as Distributed by MLS Grid
- 2019-01-21 Pending — REALTRACS as Distributed by MLS Grid
- 2018-12-15 Price Changed $59,000 REALTRACS as Distributed by MLS Grid
- 2018-10-10 Listed $79,900 REALTRACS as Distributed by MLS Grid
- 2005-04-29 Sold (Public Records) $20,000 Public Records
- 2003-11-26 Sold (Public Records) $11,000 Public Records
Property tax history
+3.9%/yrLatest (2025): $342 · +58.3% YoY. Source: county tax records.
Cash-flow waterfall
monthlySold comps — $/sqft
last 12 mo · ≤1 miLoading sold comps…