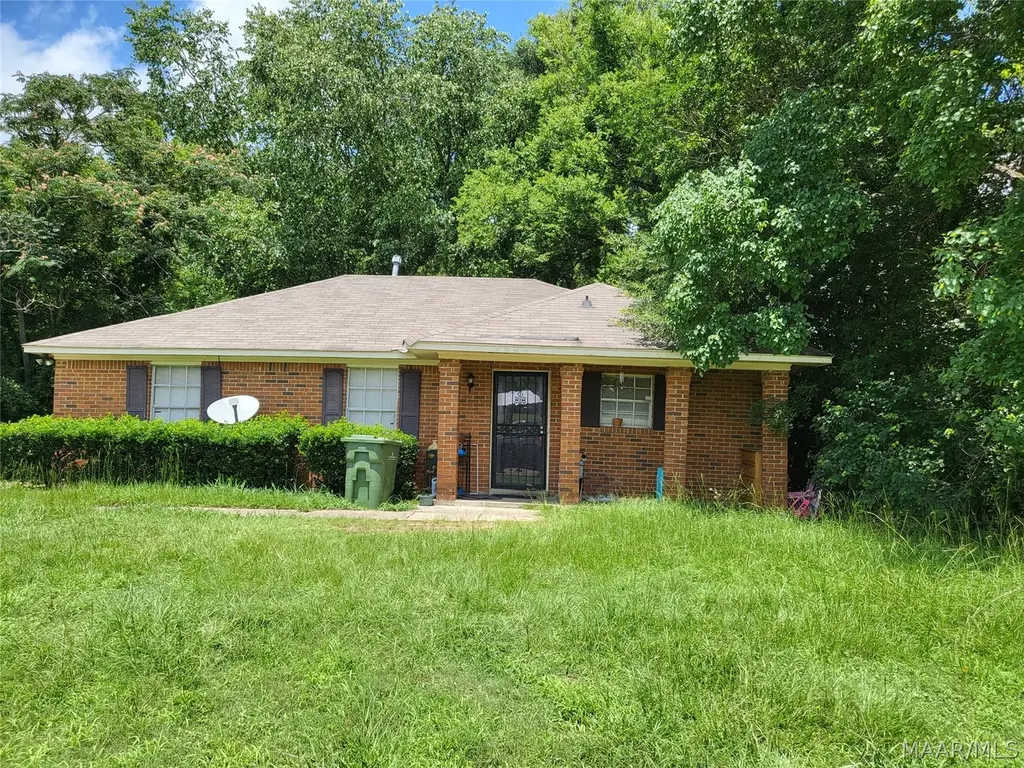
5813 Hyde Park Dr · Montgomery, AL
Flood risk 1/10 · Minimal
- FEMA flood zone
- X (unshaded)
- Chance of flooding over 30 yrs
- 0.0%
- Est. flood insurance / yr
- $507 – $1,088
Fire risk 4/10 · Minor
- Est. fire insurance / yr
- $916 – $1,700
Heat risk 8/10 · Major
- Hot days now (above 107°F)
- 7 days/yr
- Hot days in 30 yrs
- 20 days/yr
Wind risk 8/10 · Major
- Chance of severe wind over 30 yrs
- 80.0%
Air-quality risk 4/10 · Minor
- Unhealthy air days now
- 4 days/yr
- Unhealthy air days in 30 yrs
- 5 days/yr
Risk factors via First Street. Map © Google.
Why this score? — see what drove the B+ grade
The composite is a weighted blend of 9 inputs, each scored 0–100. Each bar is that input's sub-score; the figure is the points it added to the 100-point composite (weight × sub-score).
- Cash flow +30.0/30.0
- ARV discount +15.0/15.0
- 1% rule +10.0/10.0
- DSCR +10.0/10.0
- Rent growth +3.2/5.0
- Livability +3.2/5.0
- Condition / age +2.5/5.0
- Schools +1.7/10.0
- Appreciation +0.0/10.0
$82,000
🖨 Deal sheet 📄 Offer letter ✓ Due diligence
Listing remarks MLS
SECURITY SYSTEM!! CODE IN LOCK BOX!!! SUPER CONDITION-NEW A/C COMPRESSOR MAY REQUIRE FLOOD INS-ALL NEW APPLIANCES READY TO SELL-CALL FIRST
Key facts
- Large front yard
- Large backyard
- Ac heating unit
Tags
Property features AI
Exterior
- Parking: Driveway; 1-car garage
- Utilities: Cable available; Electricity available; Natural gas available; Public water; Public sewer
- Home design: Single-story; Brick construction; Slab foundation
- Construction: Brick exterior; Built in public-records year; Slab foundation
- Exterior features: Fully fenced yard; Covered porch; Patio
Interior
- Kitchen: Kitchen on the first floor
- Bedrooms: Bedrooms located on the first floor
- Flooring: Carpet
- Bathrooms: 2 full bathrooms
- Heating & cooling: Central heating (electric); Central electric air conditioning
- Interior features: Carpet flooring; Satellite dish
- Laundry & utility: Laundry room on the first floor; Gas water heater
Neighborhood map
What this means for you Summary
Snapshot
- This is a 3-bed/2.0-bath single-family listed at $82k.
Deal economics
- At list price, monthly cash flow is $638 ($8k/yr) — positive.
- The deal already cash-flows at list — no discount required.
- Meets the 1% rule at list price ($1k rent vs $82k).
- Recommended offer: $81k (1.5% below list) — sets the bar for market timing.
- Cap rate 15.6% vs local median 6.0% in Montgomery — top-decile yield for the area; either an underpriced asset or a hidden risk that comps aren't pricing in. Stress-test before assuming the spread holds.
Location & tenants
- Location reads 65/100 on livability (#138 in AL) — a middle-class / working-renter tenant base. Strengths: cost of living A+, housing A+; Watch: schools C-, employment D, crime F.
- Montgomery County (urban): math 9% / reading 31% proficiency, ranked #106 of 129 in AL (top 82%) — low school quality limits family demand, transient renter base, plan for 1-2y turnover; 70% free/reduced lunch — lower-income household profile, screen leases tightly.
- Market conditions: Rents rising (+3.0%/yr); 407 active listings in the ZIP; 28 comparable units currently listed for rent nearby; rentals at typical pace (median 21d on market — plan ~3-4 weeks tenant-placement turnaround); 46% of comp listings sitting > 30 days — soft ceiling on asking rent; 460 units permitted in Montgomery County in 2024 (37 in 5+ unit buildings).
Forward outlook
- Local home prices are declining (-3.0%/yr); year-one equity from $567 of loan paydown is wiped out by about $2k of value loss. Plan a longer hold.
- Montgomery County population projected to shrink 8% by 2050 — rents likely to lag national; underwrite the cash flow, not the appreciation.
- At projected returns (-3.0% appreciation + 3.0% rent growth), your $23k cash investment doubles in ~4 years — after that, you're playing with house money.
Negotiation context
- It's been on market 17 days — a 2% lower offer ($81k) is reasonable based on typical stale-listing flexibility.
- 2 sale attempts since 27y ago with the ask held roughly flat each time — persistent listings suggest the price (not the market) is what's stuck; bring a comps-based counter.
Risks & watch-outs
- Climate carrying-cost: severe wind risk, 80% chance of damaging wind over 30y; extreme-heat days projected 7→20/yr by 2055 (HVAC capex compounding) — expect insurance premiums to compound above CPI over the hold.
Questions for the listing agent
- Is there a deadline driving the sale (1031 exchange, divorce, estate, relocation)? That informs how much negotiation room exists.
- Crime grade is F in this area — have there been break-ins, vandalism, or insurance claims at this property in the last 3 years? What carrier currently insures it and at what premium?
- What's the average days-on-market for RENTAL listings here right now (not sales)? A rising rental-DOM trend means longer vacancies and softer asking-rent achievability than the comps imply.
- What's the recent tenant-quality profile in this submarket — average credit score on applications, eviction rate, late-payment / NSF rate, and stable-employment percentage? A property-management company in the area should have these aggregated.
- How much new for-sale + rental construction is in the pipeline within 1–3 miles? Heavy new supply typically softens prices + rents 12–24 months out; constrained supply supports both.
Investment metrics
- 1% rule
- 1.76% ✓
- Cap rate
- 15.63%
- Cash-on-cash
- 33.35%
- DSCR
- 2.48
- GRM
- 4.7
CMA / ARV
- ARV (on-the-fly)
- $127,305
- Comps found
- 12
Show comp detail 12 sales within ~0.75 mi
| Address | Dist | Beds/Ba | Sqft | Sold | Price | $/sf | Match |
|---|---|---|---|---|---|---|---|
| 1020 N Burbank Dr | 0.30mi | 3/2.0 | 1,111 (+0%) | 4mo | $142,500 | $128 | 83 |
| 1320 Dunbarton Rd | 0.41mi | 3/2.0 | 1,084 (-2%) | 10mo | $144,000 | $133 | 70 |
| 6439 Yates Ct | 0.59mi | 3/2.0 | 1,120 (+1%) | 2mo | $72,500 | $65 | 69 |
| 5805 Acacia Ct | 0.19mi | 3/2.0 | 1,228 (+11%) | 7mo | $115,000 | $94 | 67 |
| 6459 Pinebrook Dr | 0.61mi | 3/2.0 | 1,144 (+3%) | 1mo | $130,750 | $114 | 66 |
| 728 Amity Ln | 0.25mi | 4/2.0 (+1) | 1,218 (+10%) | 2mo | $140,500 | $115 | 65 |
| 6119 Hinchcliff Rd | 0.46mi | 3/2.0 | 1,170 (+6%) | 7mo | $150,000 | $128 | 63 |
| 944 David Dr | 0.58mi | 3/2.0 | 1,074 (-3%) | 6mo | $122,500 | $114 | 63 |
| 6382 Pinebrook Dr | 0.70mi | 3/2.0 | 1,144 (+3%) | 4mo | $131,500 | $115 | 58 |
| 5736 Roxboro Dr | 0.41mi | 3/2.0 | 1,215 (+10%) | 9mo | $148,000 | $122 | 57 |
| 426 Stroll Dr | 0.51mi | 3/1.5 | 1,226 (+11%) | 4mo | $137,500 | $112 | 53 |
| 329 Sultan Ct | 0.64mi | 3/1.5 | 1,260 (+14%) | 10mo | $128,500 | $102 | 36 |
Match score weights: distance 35% · size 25% · config 20% · recency 20%. Top-matched comps best support the ARV.
Projected returns pro-forma
-3.0% appreciation · 2.99% rent growth · sell at horizon
- IRR
- 28.6%
- Equity multiple
- 2.19×
- Total profit
- $27,326
- Equity at exit
- $12,226
- IRR
- 36.0%
- Equity multiple
- 4.31×
- Total profit
- $76,006
- Equity at exit
- $7,090
Cash invested: $22,960 (down + closing). Projections, not guarantees.
Landlord ↔ Tenant lean methodology
- Overall (STATE)
- 90 Strongly Landlord-Friendly
- State Alabama
- 90 Strongly Landlord-Friendly · R+15
- County
- — inherits STATE
- City
- — inherits STATE
ZIP-level market 36117
- Home prices YoY
- -20.0%
- Rents YoY
- 3.0%
- Active inventory
- 407
- Price-to-rent
- 4.7×
Monthly cashflow live
- Estimated rent
- $1,447 high interval (Pro) →
- Mortgage (P&I)
- −$430
- Tax from tax record
- −$41 /mo · $489/yr
- Insurance
- −$34
- HOA
- −$0
- Vacancy / Maint / Mgmt
- −$304
- Net cashflow
- $638
Break-even live
UW: 25.0% down · 7.5% · 30yr · 1.5% tax · 5.0% vac · 8.0% maint · 8.0% mgmt
Financing live
Cash to close
- Down payment
- $20,500
- Closing costs
- $2,460
- Reserves months
- —
- Total cash needed
- —
Loan-product check · same deal, 3 products live
Conventional
25% down · 7.5% · 30yr
- Down + closing
- —
- Monthly P&I
- —
- Monthly cashflow
- —
- DSCR
- —
- Eligible?
- —
Personal DTI + credit; lowest rate.
DSCR
20% down · 8.5% · 30yr
- Down + closing
- —
- Monthly P&I
- —
- Monthly cashflow
- —
- DSCR
- —
- Eligible?
- —
No personal income docs; deal must DSCR.
Hard money
10% down · 12.0% · 12mo
- Down + closing
- —
- Monthly P&I
- —
- Monthly cashflow
- —
- DSCR
- —
- Eligible?
- —
Short-term bridge; refi at stabilization.
Rent comps 28 comps
| Address | Beds | Baths | Sqft | Rent | $/sqft | DOM | Units | Dist |
|---|---|---|---|---|---|---|---|---|
| 760 N Burbank Dr Montgomery, AL | 3.0 | 2.0 | 1102 | $1,400 | $1.27 | 43d | 1 | 0.12mi |
| 728 Amity Ln Montgomery, AL | 4.0 | 2.0 | 1218 | $1,700 | $1.40 | 13d | 1 | 0.27mi |
| 6265 Wares Ferry Rd Montgomery, AL | 3.0 | 2.0 | 1336 | $1,600 | $1.20 | 13d | 1 | 0.40mi |
| 457 Mulligan Dr Montgomery, AL | 3.0 | 2.0 | 1344 | $1,335 | $0.99 | 43d | 1 | 0.49mi |
| 706 Placid Dr Montgomery, AL | 3.0 | 1.5 | 1120 | $1,400 | $1.25 | 13d | 1 | 0.49mi |
| 5735 Sweet Meadow Dr Montgomery, AL | 3.0 | 2.0 | 1413 | $1,525 | $1.08 | 43d | 1 | 0.50mi |
| 438 Mulligan Dr Montgomery, AL | 4.0 | 2.0 | 1232 | $1,500 | $1.22 | 43d | 1 | 0.53mi |
| 523 Placid Dr Montgomery, AL | 3.0 | 2.0 | 1122 | $1,195 | $1.07 | 43d | 1 | 0.55mi |
| 428 Fieldbrook Dr Montgomery, AL | 3.0 | 1.5 | 1440 | $995 | $0.69 | 21d | 1 | 0.61mi |
| 6411 Pinebrook Dr Montgomery, AL | 3.0 | 1.5 | 1120 | $1,095 | $0.98 | 43d | 1 | 0.63mi |
| 241 Kroy Dr Montgomery, AL | 4.0 | 2.0 | 1450 | $1,195 | $0.82 | 43d | 1 | 0.77mi |
| 6320 Burbank Crossing Loop Montgomery, AL | 3.0 | 2.0 | 1238 | $1,600 | $1.29 | 43d | 1 | 0.79mi |
| 6265 Nature Dr Montgomery, AL | 3.0 | 2.0 | 1400 | $1,050 | $0.75 | 13d | 1 | 0.88mi |
| 516 Lawndale Ln Montgomery, AL | 3.0 | 1.0 | 1125 | $1,150 | $1.02 | 43d | 1 | 0.90mi |
| 535 Lawndale Ln Montgomery, AL | 4.0 | 1.5 | 1260 | $1,100 | $0.87 | 13d | 1 | 0.93mi |
| 6121 Boardwalk Blvd Montgomery, AL | 3.0 | 2.0 | 1155 | $1,075 | $0.93 | 21d | 1 | 1.00mi |
| 6121 Boardwalk Blvd Montgomery, AL | 1.0–3.0 | 1.0–2.0 | 877 | $1,075 | $1.23 | 13d | 4 | 1.00mi |
| 633 Groveland Dr Montgomery, AL | 3.0 | 2.0 | 1424 | $1,200 | $0.84 | 43d | 1 | 1.03mi |
| 538 Hollow Wood Rd Montgomery, AL | 2.0 | 2.0 | 1053 | $1,100 | $1.04 | 43d | 1 | 1.16mi |
| 4732 Retreat Rd Montgomery, AL | 2.0 | 2.0 | 1034 | $995 | $0.96 | 21d | 1 | 1.18mi |
| 6637 Ridgeview Cir Montgomery, AL | 3.0 | 2.5 | 1458 | $1,700 | $1.17 | 21d | 1 | 1.26mi |
| 564 Glade Park Loop Unit 1043856P Montgomery, AL | 4.0 | 2.0 | 1496 | $2,736 | $1.83 | 13d | 1 | 1.27mi |
| 185 Eastdale Rd S Montgomery, AL | 1.0–2.0 | 1.0–2.0 | 846 | $1,100 | $1.30 | 21d | 4 | 1.35mi |
| 101 S Burbank Dr Montgomery, AL | 1.0–2.0 | 1.0–1.5 | 850 | $997 | $1.17 | 13d | 5 | 1.35mi |
| 203 Eastdale Rd S Montgomery, AL | 1.0–3.0 | 1.0–2.0 | 931 | $1,290 | $1.39 | 13d | 13 | 1.43mi |
| 5926 Carmel Dr Montgomery, AL | 3.0 | 2.0 | 1158 | $1,200 | $1.04 | 43d | 1 | 1.46mi |
| 5918 Carmel Dr Montgomery, AL | 2.0 | 2.0 | 1026 | $1,100 | $1.07 | 43d | 1 | 1.46mi |
| 529 Mitylene Dr Montgomery, AL | 3.0 | 2.0 | 1463 | $1,550 | $1.06 | 21d | 1 | 1.47mi |
Listing history 13 events
-
2026-06-18days on market $82,000 Active 17 DOM
-
2026-06-17days on market $82,000 Active 16 DOM
-
2026-06-16days on market $82,000 Active 15 DOM
-
2026-06-15days on market $82,000 Active 14 DOM
-
2026-06-14days on market $82,000 Active 12 DOM
-
2026-06-13days on market $82,000 Active 11 DOM
-
2026-06-10days on market $82,000 Active 9 DOM
-
2026-06-09days on market $82,000 Active 8 DOM
-
2026-06-08days on market $82,000 Active 7 DOM
-
2026-06-07days on market $82,000 Active 6 DOM
-
2026-06-03days on market $82,000 Active 2 DOM
-
2026-06-02remarks 582-char remark
-
2026-06-02$82,000 Active 1 DOM
ⓘ Source: listings_history table (triggers on properties + properties_extension) + one-shot
backfill from property_details.listing_events for pre-trigger history.
Tax reassessment forecast AL · Resets to sale price
- Current annual tax
- $489 · $41/mo
- Projected year-2 tax
- $489 · $41/mo
- Expected delta
- $0/yr ($0/mo · 0.0%)
ⓘ Screening estimate from a state-policy table — verify with the county assessor before closing.
Climate risk First Street
- Flood 1/10 Low FEMA zone X (unshaded) · 0% chance over 30 yrs
- Wildfire 4/10 Moderate
- Heat 8/10 Severe 7 d/yr ≥107°F today · 20 d/yr by 30 yrs out
- Wind 8/10 Severe 80% chance of damaging wind over 30 yrs
- Air quality 4/10 Moderate 4 unhealthy d/yr today · 5 by 30 yrs out
Nearby sold comps map
Loading sold comps map…
Walkable amenities ~0.75 mi
Loading nearby amenities…
Taxation est. · year 1
- Rental income
- $17,363
- − Mortgage interest
- −$4,593
- − Property taxes
- −$489
- − Insurance
- −$410
- − Repairs & maintenance
- −$1,389
- − Management
- −$1,389
- − Depreciation
- −$2,385
- Taxable income
- $6,708
- Est. tax owed @ 24.0%
- −$1,610
- After-tax cash flow
- $6,048/yr
For passive investors: Depreciation is non-cash, so a rental often shows a tax loss while cash-flowing — sheltering income. Rental losses are passive: they offset passive income freely, and up to $25,000/yr can offset ordinary (W-2) income if you actively participate and your MAGI is under $100k (phasing out to $0 by $150k); unused losses carry forward. On sale, claimed depreciation is recaptured at up to 25%, and gains may owe capital-gains tax (a 1031 exchange can defer both). Figures are a year-1 estimate at your 24.0% rate — not tax advice; consult a CPA.
Schools (NCES district)
- District
- Montgomery County
- NCES district ID
- 0102430
- Math proficiency
- 9% ▼ -21.00%
- Reading proficiency
- 31% ▼ -1.00%
- Median HH income
- $43,902
- Composite
- 17.24/100
- National rank
- #9093
- State rank
- #106 of 129 in AL
Livability — Montgomery
- Score
- 65/100
- State rank
- #138
- US rank
- #13416
Category grades
Schools grade is shown separately in the Schools card above.
Census & demographics
- Census place
- Montgomery, AL
- County
- Montgomery County · 190,016 people
- City population
- 175,913
- Metro
- Montgomery, AL
- Population (ZIP)
- 53,172
- Household income
- $74,720
- Rent vs Own
- Severe rent burden
- 1742.0
Population outlook (Montgomery County) Hauer SSP2
- Today (2025)
- 224,008 people
- By 2030
- 221,460 · -1.1%
- By 2040
- 214,179 · -4.4%
- By 2050
- 204,912 · -8.5%
- By 2075
- 177,821 · -20.6%
- By 2100
- 145,134 · -35.2%
Race, ethnicity, and origin ACS 2023
- Neighborhood character
- Diverse neighborhood (Simpson 0.60)
- Race & ethnicity
- Black 53% White 34% Asian 8% Two or more races 3% Hispanic / Latino 3%
- Common ancestry
- Italian 1% Slovak 1% Lithuanian 1%
- Foreign-born
- 9% · South Korea, Canada, China
- Languages at home
- 90% English-only · Korean 4% Spanish 3% Other Indo-European 1%
Political lean MEDSL · Montgomery
- 2024 margin
- Solid D (+30.7) · D 64.8% · R 34.1% · Other 1.1%
- 2008→2024 swing
- +11.5pp toward D · 2008: 19.2pp · 2024: 30.7pp
- All cycles
- 2024: D+30.7 2020: D+31.5 2016: D+26.2 2012: D+24.3 2008: D+19.2
Not yet ingested
- Civics
- —
Market trends
- HPI YoY
- ▼ -37.24%
- Current HPI
- 148.7728
- Rent YoY
- ▲ 2.99%
- Metro
- Montgomery, AL
- State GDP YoY
- ▲ 2.94%
- F500 in state
- 4
Industry mix (Fortune 500 HQ in AL)
| Industry | F500 HQs | Revenue |
|---|---|---|
| Financial Services | 1 | $8B |
|
||
| Healthcare | 1 | $5B |
|
||
Price history
+19.7% since first listed4 events — show timeline
- 2026-06-01 Listed $82,000 MAAR
- 2007-05-07 Sold (Public Records) $166,000 Public Records
- 2000-05-31 Sold (MLS) $76,500 MAAR
- 1999-01-27 Listed $68,500 MAAR
Property tax history
+7.6%/yrLatest (2025): $489 · +2.4% YoY. Source: county tax records.
Cash-flow waterfall
monthlySold comps — $/sqft
last 12 mo · ≤1 miLoading sold comps…