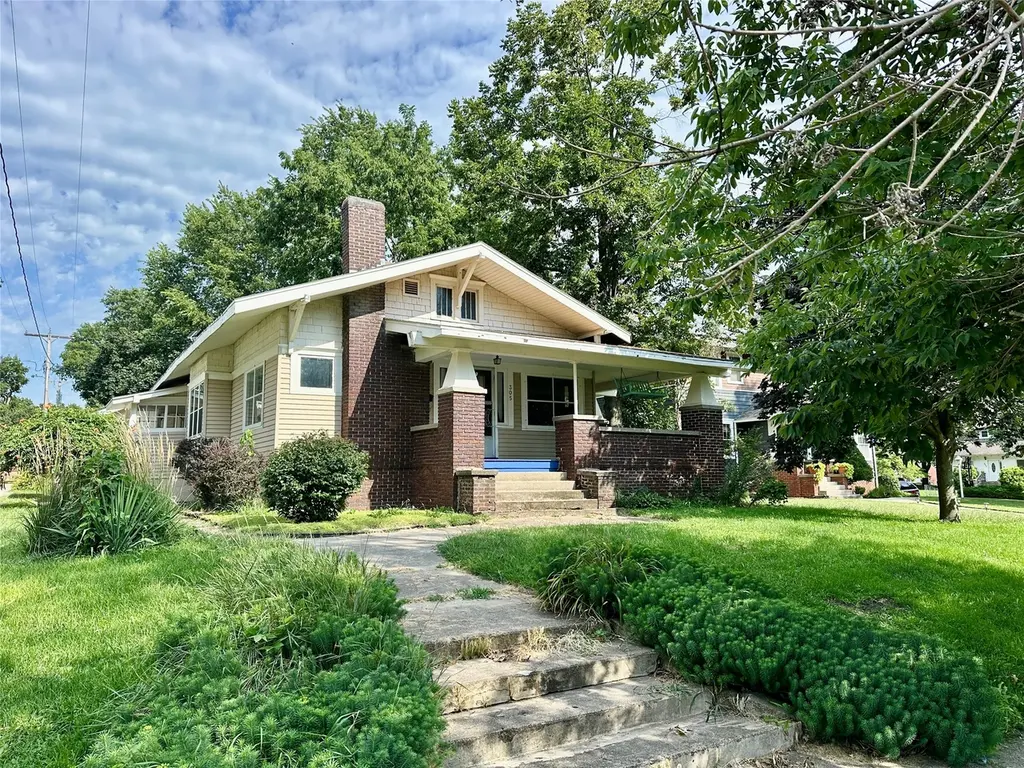
305 S Chestnut St · Jefferson, IA
Flood risk 1/10 · Minimal
- FEMA flood zone
- X (unshaded)
- Chance of flooding over 30 yrs
- 0.0%
- Est. flood insurance / yr
- $473 – $860
Fire risk 2/10 · Minimal
- Est. fire insurance / yr
- $902 – $1,676
Heat risk 3/10 · Minor
- Hot days now (above 104°F)
- 7 days/yr
- Hot days in 30 yrs
- 15 days/yr
Wind risk 2/10 · Minimal
- Chance of severe wind over 30 yrs
- —
Air-quality risk 1/10 · Minimal
- Unhealthy air days now
- 0 days/yr
- Unhealthy air days in 30 yrs
- 0 days/yr
Risk factors via First Street. Map © Google.
Why this score? — see what drove the C grade
The composite is a weighted blend of 9 inputs, each scored 0–100. Each bar is that input's sub-score; the figure is the points it added to the 100-point composite (weight × sub-score).
- Cash flow +17.6/30.0
- ARV discount +15.0/15.0
- DSCR +5.5/10.0
- Schools +5.3/10.0
- 1% rule +5.0/10.0
- Livability +4.0/5.0
- Rent growth +2.5/5.0
- Condition / age +2.5/5.0
- Appreciation +0.0/10.0
$130,000
🖨 Deal sheet 📄 Offer letter ✓ Due diligence
Listing remarks
Charming 4-bedroom Craftsman cottage in Jefferson, Iowa is now available! Welcoming wrap-around porch greets you as it leads into a large 12' x 25' living room with a wood burning fireplace. Formal dining room with an emphasis on attractive woodwork accents delivers a warm inviting feel. Pristine solid wood doors and trim showcase the craftsmanship of this home. Thoughtful updates over the years include newer windows, flooring, paint, plumbing, and electrical. Outside, you’ll find a two-car detached garage, large rear parking area, and a newer 10' x 10' utility shed for extra storage. Tucked away on a quiet street in a welcoming community, this move-in ready home offers the charm and
Key facts
- Quiet street
- Newer utility shed
- Wrap-around porch
Tags
Property features AI
Exterior
- Parking: Detached two-car garage
- Utilities: Public water; Public sewer
- Home design: Single-story home; R-Res zoning
- Construction: Brick and metal siding exterior; Shingle/asphalt roof; Block foundation
- Exterior features: Open patio
Interior
- Kitchen: Dishwasher; Microwave; Stove
- Bedrooms: Four main-level bedrooms
- Flooring: Carpet; Laminate; Vinyl
- Bathrooms: One three-quarter bathroom; One half bathroom
- Heating & cooling: Forced air heating (gas); Central air conditioning
- Interior features: Separate/formal dining room; Unfinished basement
Neighborhood map
What this means for you Summary
Snapshot
- This is a 4-bed/1.5-bath other listed at $130k.
Deal economics
- At list price, monthly cash flow is $103 ($1k/yr) — positive.
- The deal already cash-flows at list — no discount required.
- Meets the 1% rule at list price ($1k rent vs $130k).
- Recommended offer: $126k (3.0% below list) — sets the bar for market timing.
- Cap rate 7.2% vs local median 3.8% in Jefferson — top-decile yield for the area; either an underpriced asset or a hidden risk that comps aren't pricing in. Stress-test before assuming the spread holds.
Location & tenants
- Location reads 79/100 on livability (#115 in IA, #2,186 nationally) — a middle-class / working-renter tenant base. Strengths: cost of living A+, health & safety A+, crime A; Watch: employment C-, amenities F, commute F.
- Greene County Community School District (town): math 58% / reading 67% proficiency, ranked #223 of 289 in IA (top 77%) — acceptable for families but not a draw, mixed tenant base, ~2y average lease.
- Market conditions: 56 active listings in the ZIP; 15 units permitted in Greene County in 2024 (0 in 5+ unit buildings).
Forward outlook
- Local home prices are declining (-3.0%/yr); year-one equity from $899 of loan paydown is wiped out by about $4k of value loss. Plan a longer hold.
- Greene County population projected at -14% by 2050 — secular population decline; favor cash flow + early exit over multi-decade hold.
Negotiation context
- It's been on market 47 days — a 3% lower offer ($126k) is reasonable based on typical stale-listing flexibility.
- 3 sale attempts with the ask held roughly flat each time — persistent listings suggest the price (not the market) is what's stuck; bring a comps-based counter.
Risks & watch-outs
- Watch-outs: built in 1928 — expect roof / HVAC / electrical / plumbing capex.
Questions for the listing agent
- It's been on market 47 days. Have you received any prior offers? Is the seller open to a 3% concession, seller financing, or rate buy-down credit?
- Built in 1928 — when were the roof, HVAC, electrical panel, plumbing, and water heater last replaced?
- Is there a deadline driving the sale (1031 exchange, divorce, estate, relocation)? That informs how much negotiation room exists.
- Schools are B-rated — typically a magnet for longer-tenancy family renters. What's the average tenant stay here, and is there a school-zone premium baked into asking?
- What's the average days-on-market for RENTAL listings here right now (not sales)? A rising rental-DOM trend means longer vacancies and softer asking-rent achievability than the comps imply.
- What's the recent tenant-quality profile in this submarket — average credit score on applications, eviction rate, late-payment / NSF rate, and stable-employment percentage? A property-management company in the area should have these aggregated.
- How much new for-sale + rental construction is in the pipeline within 1–3 miles? Heavy new supply typically softens prices + rents 12–24 months out; constrained supply supports both.
Investment metrics
- 1% rule
- 1.00% ✓
- Cap rate
- 7.24%
- Cash-on-cash
- 3.38%
- DSCR
- 1.15
- GRM
- 8.3
CMA / ARV
- ARV (median comp)
- $157,865
- List price
- $130,000
- Delta
- -17.65%
- Verdict
- UNDERPRICED
- Comps
- 20 within 1.0 mi
Projected returns pro-forma
-3.0% appreciation · 3.0% rent growth · sell at horizon
- IRR
- -10.9%
- Equity multiple
- 0.60×
- Total profit
- $-14,490
- Equity at exit
- $19,383
- IRR
- -1.6%
- Equity multiple
- 0.89×
- Total profit
- $-4,047
- Equity at exit
- $11,240
Cash invested: $36,400 (down + closing). Projections, not guarantees.
Landlord ↔ Tenant lean methodology
- Overall (STATE)
- 83 Strongly Landlord-Friendly
- State Iowa
- 83 Strongly Landlord-Friendly · R+6
- County
- — inherits STATE
- City
- — inherits STATE
ZIP-level market 50129
- Home prices YoY
- -4.1%
- Active inventory
- 56
- Price-to-rent
- 8.3×
Monthly cashflow live
- Estimated rent
- $1,303 medium interval (Pro) →
- Mortgage (P&I)
- −$682
- Tax from tax record
- −$191 /mo · $2,294/yr
- Insurance
- −$54
- HOA
- −$0
- Vacancy / Maint / Mgmt
- −$274
- Net cashflow
- $103
Break-even live
UW: 25.0% down · 7.5% · 30yr · 1.5% tax · 5.0% vac · 8.0% maint · 8.0% mgmt
Financing live
Cash to close
- Down payment
- $32,500
- Closing costs
- $3,900
- Reserves months
- —
- Total cash needed
- —
Loan-product check · same deal, 3 products live
Conventional
25% down · 7.5% · 30yr
- Down + closing
- —
- Monthly P&I
- —
- Monthly cashflow
- —
- DSCR
- —
- Eligible?
- —
Personal DTI + credit; lowest rate.
DSCR
20% down · 8.5% · 30yr
- Down + closing
- —
- Monthly P&I
- —
- Monthly cashflow
- —
- DSCR
- —
- Eligible?
- —
No personal income docs; deal must DSCR.
Hard money
10% down · 12.0% · 12mo
- Down + closing
- —
- Monthly P&I
- —
- Monthly cashflow
- —
- DSCR
- —
- Eligible?
- —
Short-term bridge; refi at stabilization.
Listing history 20 events
-
2026-06-18days on market $130,000 Active 47 DOM
-
2026-06-17days on market $130,000 Active 46 DOM
-
2026-06-16days on market $130,000 Active 45 DOM
-
2026-06-15days on market $130,000 Active 44 DOM
-
2026-06-13days on market $130,000 Active 42 DOM
-
2026-06-12days on market $130,000 Active 41 DOM
-
2026-06-09days on market $130,000 Active 38 DOM
-
2026-06-08days on market $130,000 Active 37 DOM
-
2026-06-07days on market $130,000 Active 36 DOM
-
2026-06-07days on market $130,000 Active 35 DOM
-
2026-06-04days on market $130,000 Active 32 DOM
-
2026-06-02days on market $130,000 Active 31 DOM
-
2026-06-01days on market $130,000 Active 30 DOM
-
2026-05-31days on market $130,000 Active 29 DOM
-
2026-05-31days on market $130,000 Active 28 DOM
-
2026-05-02$130,000 Active 790-char remark
-
2025-11-15historical
-
2025-08-15$139,000 Active
-
2025-04-10status Pending
-
2025-03-03$140,000 Active
ⓘ Source: listings_history table (triggers on properties + properties_extension) + one-shot
backfill from property_details.listing_events for pre-trigger history.
Tax reassessment forecast IA · Partial reset (capped growth)
- Current annual tax
- $2,294 · $191/mo
- Projected year-2 tax
- $2,294 · $191/mo
- Expected delta
- $0/yr ($0/mo · 0.0%)
ⓘ Screening estimate from a state-policy table — verify with the county assessor before closing.
Climate risk First Street
- Flood 1/10 Low FEMA zone X (unshaded) · 0% chance over 30 yrs
- Wildfire 2/10 Low
- Heat 3/10 Moderate 7 d/yr ≥104°F today · 15 d/yr by 30 yrs out
- Wind 2/10 Low
- Air quality 1/10 Low 0 unhealthy d/yr today · 0 by 30 yrs out
Nearby sold comps map
Loading sold comps map…
Walkable amenities ~0.75 mi
Loading nearby amenities…
Taxation est. · year 1
- Rental income
- $15,641
- − Mortgage interest
- −$7,282
- − Property taxes
- −$2,294
- − Insurance
- −$650
- − Repairs & maintenance
- −$1,251
- − Management
- −$1,251
- − Depreciation
- −$3,782
- Taxable loss
- −$869
- Est. tax savings @ 24.0%
- +$209
- After-tax cash flow
- $1,440/yr
For passive investors: Depreciation is non-cash, so a rental often shows a tax loss while cash-flowing — sheltering income. Rental losses are passive: they offset passive income freely, and up to $25,000/yr can offset ordinary (W-2) income if you actively participate and your MAGI is under $100k (phasing out to $0 by $150k); unused losses carry forward. On sale, claimed depreciation is recaptured at up to 25%, and gains may owe capital-gains tax (a 1031 exchange can defer both). Figures are a year-1 estimate at your 24.0% rate — not tax advice; consult a CPA.
Schools (NCES district)
- District
- Greene County Community School District
- NCES district ID
- 1915210
- Math proficiency
- 58% ▼ -6.00%
- Reading proficiency
- 67% ▲ 2.00%
- Median HH income
- $46,051
- Composite
- 52.74/100
- National rank
- #1548
- State rank
- #223 of 289 in IA
Livability — Jefferson
- Score
- 79/100
- State rank
- #115
- US rank
- #2186
Category grades
Schools grade is shown separately in the Schools card above.
Census & demographics
- Census place
- Jefferson, IA
- City population
- 5,116
- Population (ZIP)
- 5,116
Population outlook (Greene County) Hauer SSP2
- Today (2025)
- 8,361 people
- By 2030
- 8,090 · -3.2%
- By 2040
- 7,607 · -9.0%
- By 2050
- 7,186 · -14.1%
- By 2075
- 6,528 · -21.9%
- By 2100
- 5,799 · -30.6%
Race, ethnicity, and origin ACS 2023
- Neighborhood character
- Predominantly White (93%)
- Race & ethnicity
- White 93% Hispanic / Latino 4% Two or more races 4%
- Common ancestry
- Portuguese 6% Lithuanian 4% Iranian 3%
- Foreign-born
- 2% · Canada
- Languages at home
- 97% English-only · Spanish 3% German/W. Germanic 1%
Political lean MEDSL · Greene
- 2024 margin
- Solid R (+33.0) · D 32.9% · R 65.9% · Other 1.2%
- 2008→2024 swing
- -33.4pp toward R · 2008: 0.5pp · 2024: -33.0pp
- All cycles
- 2024: R+33.0 2020: R+28.8 2016: R+23.8 2012: R+0.1 2008: D+0.5
Not yet ingested
- Civics
- —
Market trends
- HPI YoY
- ▼ -10.16%
- Current HPI
- 240.0907
- Rent YoY
- —
- Metro
- —
- State GDP YoY
- ▲ 2.48%
- F500 in state
- 4
Industry mix (Fortune 500 HQ in IA)
| Industry | F500 HQs | Revenue |
|---|---|---|
| Financial Services | 1 | $16B |
|
||
| Retail / Convenience | 1 | $15B |
|
||
Price history
-7.1% since first listed5 events — show timeline
- 2026-05-02 Listed $130,000 DMMLS
- 2025-11-15 Listing Removed — DMMLS
- 2025-08-15 Listed $139,000 DMMLS
- 2025-04-10 Pending — IAR
- 2025-03-03 Listed $140,000 IAR
Property tax history
+10.2%/yrLatest (2025): $2,294 · +2.0% YoY. Source: county tax records.
Cash-flow waterfall
monthlySold comps — $/sqft
last 12 mo · ≤1 miLoading sold comps…