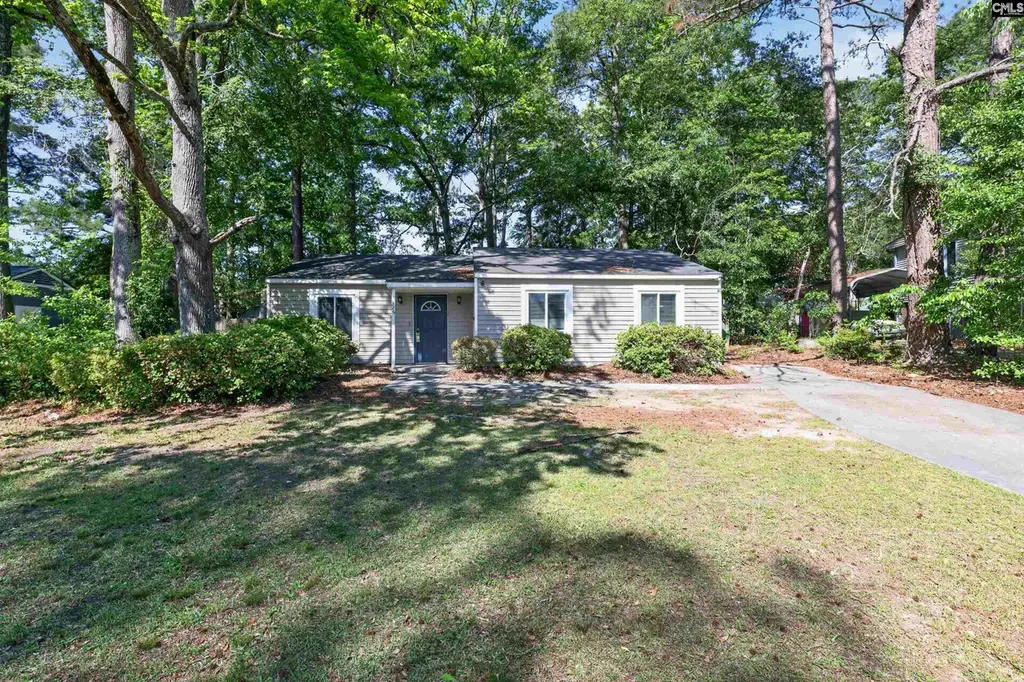
326 Rockingham Rd · Dentsville, SC
Flood risk 1/10 · Minimal
- FEMA flood zone
- X
- Chance of flooding over 30 yrs
- 0.0%
- Est. flood insurance / yr
- $435 – $905
Fire risk 2/10 · Minimal
- Est. fire insurance / yr
- $783 – $1,453
Heat risk 6/10 · Moderate
- Hot days now (above threshold)
- 7 days/yr
- Hot days in 30 yrs
- 16 days/yr
Wind risk No data
- Chance of severe wind over 30 yrs
- —
Air-quality risk No data
- Unhealthy air days now
- —
- Unhealthy air days in 30 yrs
- —
Risk factors via First Street. Map © Google.
Why this score? — see what drove the D+ grade
The composite is a weighted blend of 9 inputs, each scored 0–100. Each bar is that input's sub-score; the figure is the points it added to the 100-point composite (weight × sub-score).
- Cash flow +17.6/30.0
- ARV discount +7.5/15.0
- 1% rule +6.1/10.0
- DSCR +5.5/10.0
- Schools +3.6/10.0
- Livability +3.6/5.0
- Rent growth +2.6/5.0
- Condition / age +2.5/5.0
- Appreciation +0.0/10.0
$154,900
🖨 Deal sheet (PDF) 📄 Offer letter ✓ Due diligence
Listing remarks
Classic 3-bedroom, 1.5-bathroom brick ranch perfectly situated on a generous 0.36-acre lot. Spanning 1,313 sq. ft. , this home features a functional floor plan with formal living and dining areas, ideal for both daily life and hosting guests. The durable brick exterior and attached carport allows for low-maintenance living and convenience. Outside, the large level backyard provides a private retreat for gardening or recreation. Located in the award-winning Richland 02 school district and just minutes from the shopping and dining of Two Notch Road and Decker Blvd. Quick access to I-20 and I-77 makes for an effortless commute. Disclaimer: CMLS has not reviewed and, therefore, does not endors
Key facts
- Generous lot
- Large level backyard
- Quick access to i-20
Tags
Property features AI
Exterior
- Utilities: Public water; Public sewer
- Home design: Single-story home
- Construction: Vinyl exterior; Slab foundation
- Exterior features: Patio; Shed; Rear chain-link fence
Interior
- Kitchen: Eat-in kitchen; Formica countertops; Stained wood cabinets; Dishwasher; Refrigerator; Disposal; Free-standing range
- Bedrooms: Master bedroom on main level with walk-in closet; Bedroom 2 on main level; Bedroom 3 on main level
- Bathrooms: One full bathroom; One half bathroom
- Heating & cooling: Central heat; Central cooling; Heat pump on first level
- Interior features: Dishwasher; Disposal; Refrigerator; Free-standing range; Formal dining area with molding; Eat-in kitchen with Formica countertops and stained wood cabinets
Neighborhood map
What this means for you Summary
Snapshot
- This is a 3-bed/2.0-bath single-family listed at $155k.
Deal economics
- At list price, monthly cash flow is $121 ($1k/yr) — positive.
- The deal already cash-flows at list — no discount required.
- Meets the 1% rule at list price ($2k rent vs $155k).
- Recommended offer: $153k (1.5% below list) — sets the bar for market timing.
Location & tenants
- Location reads 71/100 on livability (#50 in SC) — a middle-class / working-renter tenant base. Strengths: cost of living A+, health & safety A+, housing A; Watch: amenities D+, crime F, commute F.
- Richland 02 (suburban): math 35% / reading 47% proficiency, ranked #29 of 80 in SC (top 36%) — families likely to look elsewhere, expect single-tenant / working-renter base with shorter leases.
- Zoned schools: Killian Elementary (math 18% / reading 24%, grade F, #488 of 597 statewide, top 82%, 742 students, 100% FRL); Longleaf Middle (math 19% / reading 41%, grade F, #136 of 229 statewide, top 60%, 802 students, 69% FRL); Spring Valley High (math 53% / reading 92%, grade B+, #46 of 196 statewide, top 24%, 2,187 students, 49% FRL) — zoned schools average 73% FRL vs 38% district-wide (34 pts higher); higher-poverty schools than district average — tighter screening recommended.
- Market conditions: Rents flat; 341 active listings in the ZIP; 11 comparable units currently listed for rent nearby; rentals at typical pace (median 16d on market — plan ~3-4 weeks tenant-placement turnaround); 3,472 units permitted in Richland County in 2024 (1,096 in 5+ unit buildings).
- This rent runs 33% of the median local income ($62k/yr) — at the standard rent-burdened threshold; future hikes will face affordability resistance.
Forward outlook
- Local home prices are declining (-3.0%/yr); year-one equity from $1k of loan paydown is wiped out by about $5k of value loss. Plan a longer hold.
- Richland County population projected at +30% by 2050 — long-run rental-demand tailwind backs the buy-and-hold thesis.
Negotiation context
- It's been on market 16 days — a 2% lower offer ($153k) is reasonable based on typical stale-listing flexibility.
- Current owner paid $108k; 44% above their basis — modest negotiation headroom, anchor on the comps not their cost.
Risks & watch-outs
- Watch-outs: property tax is 2.8% of price.
- Climate carrying-cost: extreme-heat days projected 7→16/yr by 2055 (HVAC capex compounding) — expect insurance premiums to compound above CPI over the hold.
Questions for the listing agent
- Built in 1977 — when were the roof, HVAC, electrical panel, plumbing, and water heater last replaced?
- Property tax is high relative to price — has the assessment been appealed recently, and will the sale trigger a re-assessment?
- Is there a deadline driving the sale (1031 exchange, divorce, estate, relocation)? That informs how much negotiation room exists.
- Schools are D-rated, which usually means shorter tenancies and higher turnover. Who's the typical renter profile here, and what's been the actual vacancy rate?
- Crime grade is F in this area — have there been break-ins, vandalism, or insurance claims at this property in the last 3 years? What carrier currently insures it and at what premium?
- The area grade is low — what's the realistic commute time and amenity access for the typical tenant pool here? Any planned neighborhood developments (good or bad) we should know about?
- What's the average days-on-market for RENTAL listings here right now (not sales)? A rising rental-DOM trend means longer vacancies and softer asking-rent achievability than the comps imply.
- What's the recent tenant-quality profile in this submarket — average credit score on applications, eviction rate, late-payment / NSF rate, and stable-employment percentage? A property-management company in the area should have these aggregated.
- How much new for-sale + rental construction is in the pipeline within 1–3 miles? Heavy new supply typically softens prices + rents 12–24 months out; constrained supply supports both.
Investment metrics
- 1% rule
- 1.11% ✓
- Cap rate
- 7.23%
- Cash-on-cash
- 3.34%
- DSCR
- 1.15
- GRM
- 7.5
CMA / ARV
No comps found within radius.
Projected returns pro-forma
-3.0% appreciation · 0.21% rent growth · sell at horizon
- IRR
- -14.6%
- Equity multiple
- 0.49×
- Total profit
- $-22,000
- Equity at exit
- $23,096
- IRR
- -12.3%
- Equity multiple
- 0.38×
- Total profit
- $-27,013
- Equity at exit
- $13,393
Cash invested: $43,372 (down + closing). Projections, not guarantees.
Landlord ↔ Tenant lean methodology
- Overall (STATE)
- 90 Strongly Landlord-Friendly
- State South Carolina
- 90 Strongly Landlord-Friendly · R+6
- County
- — inherits STATE
- City
- — inherits STATE
ZIP-level market 29223
- Rents YoY
- 0.2%
- Active inventory
- 341
- Price-to-rent
- 7.5×
Monthly cashflow live
- Estimated rent
- $1,724 high interval (Pro) →
- Mortgage (P&I)
- −$812
- Tax from tax record
- −$365 /mo · $4,378/yr
- Insurance
- −$65
- HOA
- −$0
- Vacancy / Maint / Mgmt
- −$362
- Net cashflow
- $121
Break-even live
Sensitivity live
| Price | -10% $208 | -5% $164 | +0% $121 | +5% $77 | +10% $33 |
|---|---|---|---|---|---|
| Rent | -10% $-16 | -5% $52 | +0% $121 | +5% $189 | +10% $257 |
| Rate | -1.0pp $199 | -0.5pp $160 | base $121 | +0.5pp $80 | +1.0pp $40 |
UW: 25.0% down · 7.5% · 30yr · 1.5% tax · 5.0% vac · 8.0% maint · 8.0% mgmt
Financing live
Cash to close
- Down payment
- $38,725
- Closing costs
- $4,647
- Reserves months
- —
- Total cash needed
- —
Loan-product check · same deal, 3 products live
Conventional
25% down · 7.5% · 30yr
- Down + closing
- —
- Monthly P&I
- —
- Monthly cashflow
- —
- DSCR
- —
- Eligible?
- —
Personal DTI + credit; lowest rate.
DSCR
20% down · 8.5% · 30yr
- Down + closing
- —
- Monthly P&I
- —
- Monthly cashflow
- —
- DSCR
- —
- Eligible?
- —
No personal income docs; deal must DSCR.
Hard money
10% down · 12.0% · 12mo
- Down + closing
- —
- Monthly P&I
- —
- Monthly cashflow
- —
- DSCR
- —
- Eligible?
- —
Short-term bridge; refi at stabilization.
Rent comps 11 comps
| Address | Beds | Baths | Sqft | Rent | $/sqft | DOM | Units | Dist |
|---|---|---|---|---|---|---|---|---|
| 916 N Brickyard Rd Columbia, SC | 3.0 | 2.0 | 1350 | $1,695 | $1.26 | 16d | 1 | 0.35mi |
| 1340 N Brickyard Rd Columbia, SC | 1.0–3.0 | 1.0–2.0 | 1061 | $1,860 | $1.75 | 4d | 34 | 1.04mi |
| 500 Rockhaven Dr Columbia, SC | 3.0 | 2.0 | 1064 | $1,649 | $1.55 | 25d | 1 | 1.11mi |
| 113 Charleswood Dr Columbia, SC | 4.0 | 1.5 | 1196 | $1,555 | $1.30 | 5d | 1 | 1.19mi |
| 381 Valley Heights Ln Columbia, SC | 3.0 | 2.5 | 1471 | $1,719 | $1.17 | 25d | 1 | 1.20mi |
| 125 Charleswood Dr Columbia, SC | 3.0 | 1.0 | 1074 | $1,350 | $1.26 | 25d | 1 | 1.21mi |
| 109 Jaybird Ln Columbia, SC | 3.0 | 2.0 | 1250 | $1,679 | $1.34 | 4d | 1 | 1.27mi |
| 21 Winslow Ct Columbia, SC | 3.0 | 2.0 | 1220 | $1,649 | $1.35 | 23d | 1 | 1.42mi |
| 1800 Killian Lakes Dr Columbia, SC | 1.0–3.0 | 1.0–2.5 | 1401 | $2,657 | $1.90 | 4d | 47 | 1.43mi |
| 237 Foxhunt Rd Columbia, SC | 3.0 | 1.5 | 1008 | $1,250 | $1.24 | 16d | 1 | 1.45mi |
| 712 Blazing Star Trl Columbia, SC | 3.0 | 2.0 | 1100 | $1,699 | $1.54 | 5d | 1 | 1.49mi |
Listing history 12 events
-
2026-06-22days on market $154,900 Active 16 DOM
-
2026-06-18days on market $154,900 Active 13 DOM
-
2026-06-17days on market $154,900 Active 12 DOM
-
2026-06-16days on market $154,900 Active 11 DOM
-
2026-06-15days on market $154,900 Active 10 DOM
-
2026-06-14days on market $154,900 Active 8 DOM
-
2026-06-13days on market $154,900 Active 7 DOM
-
2026-06-10days on market $154,900 Active 5 DOM
-
2026-06-09days on market $154,900 Active 4 DOM
-
2026-06-08days on market $154,900 Active 3 DOM
-
2026-06-07remarks 699-char remark
-
2026-06-07$154,900 Active 2 DOM
ⓘ Source: listings_history table (triggers on properties + properties_extension) + one-shot
backfill from property_details.listing_events for pre-trigger history.
Tax reassessment forecast SC · Resets to sale price
- Current annual tax
- $4,378 · $365/mo
- Projected year-2 tax
- $4,378 · $365/mo
- Expected delta
- $0/yr ($0/mo · 0.0%)
ⓘ Screening estimate from a state-policy table — verify with the county assessor before closing.
Climate risk First Street
- Flood 1/10 Low FEMA zone X · 0% chance over 30 yrs
- Wildfire 2/10 Low
- Heat 6/10 Major
Nearby sold comps map
Loading sold comps map…
Walkable amenities ~0.75 mi
Loading nearby amenities…
Taxation est. · year 1
- Rental income
- $20,692
- − Mortgage interest
- −$8,677
- − Property taxes
- −$4,378
- − Insurance
- −$774
- − Repairs & maintenance
- −$1,655
- − Management
- −$1,655
- − Depreciation
- −$4,506
- Taxable loss
- −$954
- Est. tax savings @ 24.0%
- +$229
- After-tax cash flow
- $1,676/yr
For passive investors: Depreciation is non-cash, so a rental often shows a tax loss while cash-flowing — sheltering income. Rental losses are passive: they offset passive income freely, and up to $25,000/yr can offset ordinary (W-2) income if you actively participate and your MAGI is under $100k (phasing out to $0 by $150k); unused losses carry forward. On sale, claimed depreciation is recaptured at up to 25%, and gains may owe capital-gains tax (a 1031 exchange can defer both). Figures are a year-1 estimate at your 24.0% rate — not tax advice; consult a CPA.
Schools (NCES district)
- District
- Richland 02
- NCES district ID
- 4503390
- Math proficiency
- 35% ▼ -15.00%
- Reading proficiency
- 47% ▼ -5.00%
- Median HH income
- $59,684
- Composite
- 36.2/100
- National rank
- #4730
- State rank
- #29 of 80 in SC
Livability — Dentsville
- Score
- 71/100
- State rank
- #50
- US rank
- #6940
Category grades
Schools grade is shown separately in the Schools card above.
Census & demographics
- County
- Richland County · 389,530 people
- City population
- 52,835
- Metro
- Columbia, SC
- Population (ZIP)
- 53,074
- Household income
- $62,408
- Rent vs Own
- Severe rent burden
- 2857.0
Population outlook (Richland County) Hauer SSP2
- Today (2025)
- 459,667 people
- By 2030
- 487,524 · +6.1%
- By 2040
- 542,035 · +17.9%
- By 2050
- 595,371 · +29.5%
- By 2075
- 732,998 · +59.5%
- By 2100
- 820,415 · +78.5%
Race, ethnicity, and origin ACS 2023
- Neighborhood character
- Diverse neighborhood (Simpson 0.60)
- Race & ethnicity
- Black 57% White 23% Hispanic / Latino 11% Two or more races 6% Asian 4%
- Hispanic origin (detail)
- Mexican 5% Puerto Rican 2%
- Common ancestry
- Slovak 1% Serbian 1% Italian 1%
- Foreign-born
- 10% · Canada, South Korea
- Languages at home
- 86% English-only · Spanish 8% Other Indo-European 2% Korean 1%
Political lean MEDSL · Richland
- 2024 margin
- Solid D (+34.6) · D 66.4% · R 31.8% · Other 1.8%
- 2008→2024 swing
- +5.7pp toward D · 2008: 28.9pp · 2024: 34.6pp
- All cycles
- 2024: D+34.6 2020: D+38.3 2016: D+32.9 2012: D+33.3 2008: D+28.9
Not yet ingested
- Civics
- —
Market trends
- HPI YoY
- ▼ -135.96%
- Current HPI
- 195.3158
- Rent YoY
- ▲ 0.21%
- Metro
- Columbia, SC
- State GDP YoY
- ▲ 4.51%
- F500 in state
- 2
Industry mix (Fortune 500 HQ in SC)
| Industry | F500 HQs | Revenue |
|---|---|---|
| Packaging | 1 | $7B |
|
||
Price history
+171.8% since first listed4 events — show timeline
- 2026-06-05 Listed $154,900 Consolidated MLS
- 2022-10-11 Sold (Public Records) $107,500 Public Records
- 2007-11-06 Sold (Public Records) $91,000 Public Records
- 1994-02-07 Sold (Public Records) $57,000 Public Records
Property tax history
+15.8%/yrLatest (2025): $4,378 · +2.6% YoY. Source: county tax records.
Cash-flow waterfall
monthlySold comps — $/sqft
last 12 mo · ≤1 miLoading sold comps…