 Multi-family
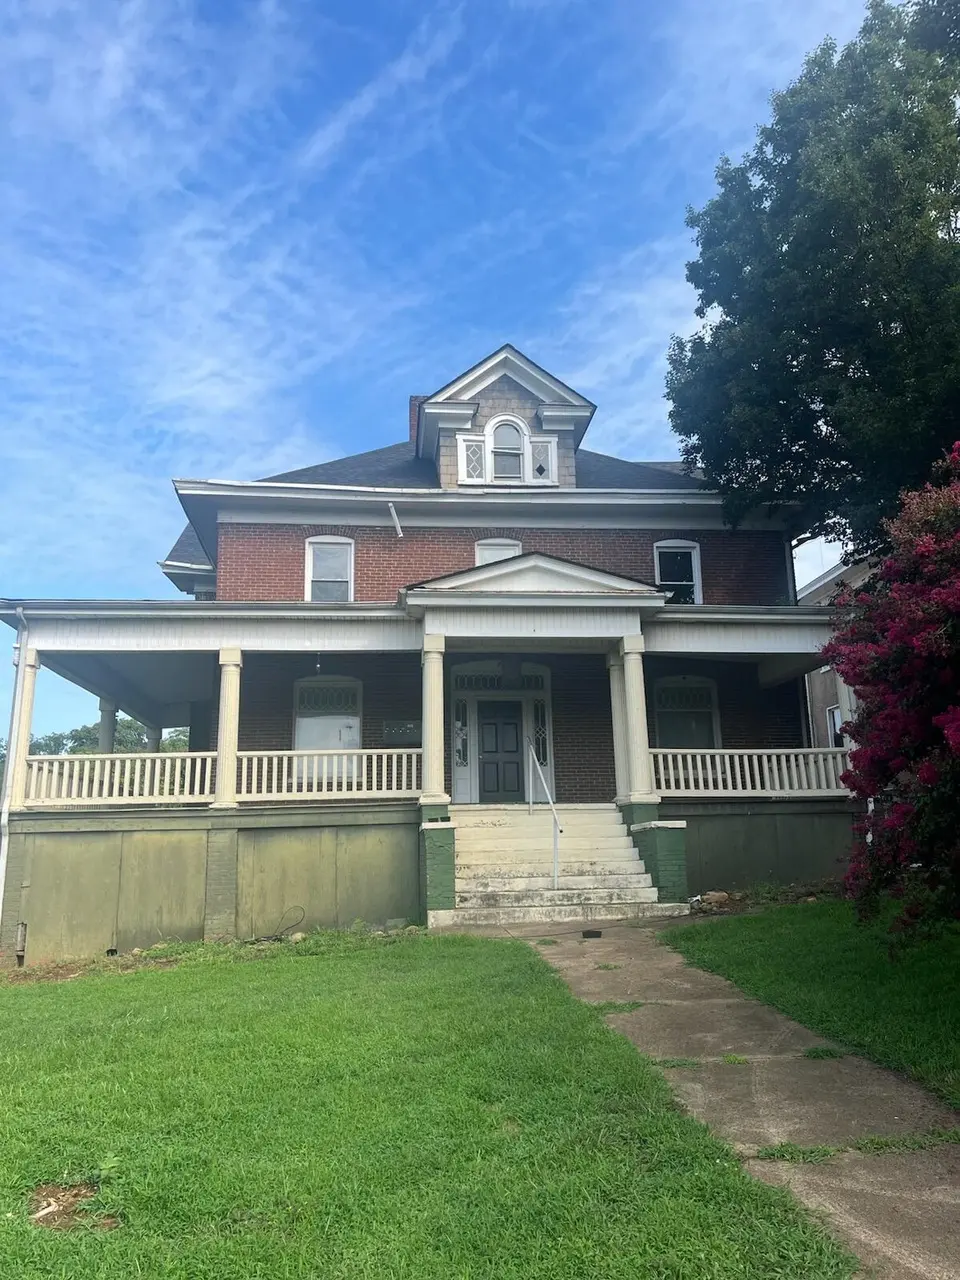
813 13th St SW Unit & 821 · Roanoke, VA
Flood risk 1/10 · Minimal
- FEMA flood zone
- X (unshaded)
- Chance of flooding over 30 yrs
- 0.0%
- Est. flood insurance / yr
- $507 – $1,088
Fire risk 1/10 · Minimal
- Est. fire insurance / yr
- $666 – $1,236
Heat risk 5/10 · Moderate
- Hot days now (above 101°F)
- 7 days/yr
- Hot days in 30 yrs
- 19 days/yr
Wind risk 2/10 · Minimal
- Chance of severe wind over 30 yrs
- 1.0%
Air-quality risk 1/10 · Minimal
- Unhealthy air days now
- 0 days/yr
- Unhealthy air days in 30 yrs
- 0 days/yr
Risk factors via First Street. Map © Google.
Why this score? — see what drove the C+ grade
The composite is a weighted blend of 9 inputs, each scored 0–100. Each bar is that input's sub-score; the figure is the points it added to the 100-point composite (weight × sub-score).
- Cash flow +25.4/30.0
- DSCR +8.4/10.0
- ARV discount +7.5/15.0
- 1% rule +6.7/10.0
- Schools +4.1/10.0
- Livability +3.7/5.0
- Rent growth +2.7/5.0
- Condition / age +2.2/5.0
- Appreciation +0.0/10.0
$1,084,705
🖨 Deal sheet 📄 Offer letter ✓ Due diligence
Multi-family units
County records classify this as Multi-Family (5+ Unit). Listing-text estimate: 1 unit. estimate disagrees with records
5+ unit building — per-unit beds/baths from public records are typically unavailable; the breakdown below (if shown) is an estimate from the listing text.
Listing remarks MLS
11 units occupied, 1 unit vacant. Full basement in 813, partial basement in 821.
Key facts
- 0.67 acre lot
- 10 parking spots
- Built 1924
Neighborhood map
What this means for you Summary
Snapshot
- This is a multifamily listed at $1.08M. Condition is rated fair.
Deal economics
- At list price, monthly cash flow is $2k ($30k/yr) — positive.
- The deal already cash-flows at list — no discount required.
- Meets the 1% rule at list price ($13k rent vs $1.08M).
- Recommended offer: $955k (12.0% below list) — sets the bar for market timing.
- Cap rate 9.0% vs local median 4.2% in Roanoke — top-decile yield for the area; either an underpriced asset or a hidden risk that comps aren't pricing in. Stress-test before assuming the spread holds.
Location & tenants
- Location reads 73/100 on livability (#163 in VA) — a middle-class / working-renter tenant base. Strengths: cost of living A+, health & safety A+, housing A; Watch: amenities C-, employment D, crime F.
- Roanoke City Public School District (urban): math 40% / reading 58% proficiency, ranked #102 of 131 in VA (top 78%) — families likely to look elsewhere, expect single-tenant / working-renter base with shorter leases; 67% free/reduced lunch — lower-income household profile, screen leases tightly.
- Market conditions: Rents flat; 89 active listings in the ZIP; 40 comparable units currently listed for rent nearby; rentals lingering (median 44d on market — plan ~5-8 weeks vacancy on turnover, expect pricing pressure); 52% of comp listings sitting > 30 days — soft ceiling on asking rent; 113 units permitted in Roanoke city in 2024 (0 in 5+ unit buildings).
- At $12,639/mo this rent would consume 326% of the median local household income ($47k/yr) (locally 728% of renters already pay >50% of income on rent) — very limited rent-growth headroom before tenants either downsize or default.
Forward outlook
- Local home prices are declining (-3.0%/yr); year-one equity from $8k of loan paydown is wiped out by about $33k of value loss. Plan a longer hold.
- Roanoke County population projected at +11% by 2050 — modest demand growth; plan on rents tracking national, not racing it.
Negotiation context
- It's been on market 329 days — a 12% lower offer ($955k) is reasonable based on typical stale-listing flexibility.
Risks & watch-outs
- Watch-outs: built in 1924 — expect roof / HVAC / electrical / plumbing capex.
- Climate carrying-cost: extreme-heat days projected 7→19/yr by 2055 (HVAC capex compounding) — expect insurance premiums to compound above CPI over the hold.
Questions for the listing agent
- It's been on market 329 days. Have you received any prior offers? Is the seller open to a 12% concession, seller financing, or rate buy-down credit?
- Have any recent inspections been done? Can we get a copy of the seller's disclosures and any deferred-maintenance estimates?
- Built in 1924 — when were the roof, HVAC, electrical panel, plumbing, and water heater last replaced?
- Why hasn't it sold? Are there any deal-killer items the seller is aware of (foundation, flood, title, zoning, code violations)?
- Is there a deadline driving the sale (1031 exchange, divorce, estate, relocation)? That informs how much negotiation room exists.
- Schools are A-rated — typically a magnet for longer-tenancy family renters. What's the average tenant stay here, and is there a school-zone premium baked into asking?
- Crime grade is F in this area — have there been break-ins, vandalism, or insurance claims at this property in the last 3 years? What carrier currently insures it and at what premium?
- What's the average days-on-market for RENTAL listings here right now (not sales)? A rising rental-DOM trend means longer vacancies and softer asking-rent achievability than the comps imply.
- What's the recent tenant-quality profile in this submarket — average credit score on applications, eviction rate, late-payment / NSF rate, and stable-employment percentage? A property-management company in the area should have these aggregated.
- How much new apartment / multifamily construction is in the pipeline within 1–3 miles? Heavy new supply (>2% of stock underway) typically softens rents 12–24 months out; light construction supports rent growth.
Investment metrics
- 1% rule
- 1.17% ✓
- Cap rate
- 9.05%
- Cash-on-cash
- 9.83%
- DSCR
- 1.44
- GRM
- 7.2
CMA / ARV
- ARV (median comp)
- $212,070
- List price
- $1,084,705
- Delta
- 411.48%
- Verdict
- OVERPRICED
- Comps
- 3 within 2.0 mi
Show comp detail 12 sales within ~0.75 mi
| Address | Dist | Beds/Ba | Sqft | Sold | Price | $/sf | Match |
|---|---|---|---|---|---|---|---|
| 1110 Campbell Ave SW | 0.29mi | —/— | — | 1mo | $140,000 | — | 73 |
| 1622 Roanoke Ave SW | 0.31mi | —/— | — | 2mo | $635,000 | — | 71 |
| 1517 Lexington Ave SW | 0.31mi | —/— | — | 4mo | $680,000 | — | 70 |
| 1138 Wasena Ave SW | 0.33mi | —/— | — | 4mo | $310,000 | — | 69 |
| 1629 Chapman Ave SW | 0.33mi | —/— | — | 7mo | $85,000 | — | 66 |
| 1825 Cambridge Ave SW | 0.47mi | —/— | — | 1mo | $350,000 | — | 65 |
| 1802 Patterson Ave SW | 0.44mi | —/— | — | 5mo | $339,950 | — | 63 |
| 1205 Kerns Ave SW | 0.49mi | —/— | — | 8mo | $181,500 | — | 58 |
| 832 Patterson Ave SW | 0.50mi | —/— | — | 8mo | $140,000 | — | 58 |
| 1327 Main St SW | 0.57mi | —/— | — | 5mo | $191,000 | — | 56 |
| 1811 Windsor Ave SW | 0.69mi | —/— | — | 0mo | $300,000 | — | 55 |
| 1410 Main St SW | 0.59mi | —/— | — | 6mo | $130,000 | — | 55 |
Match score weights: distance 35% · size 25% · config 20% · recency 20%. Top-matched comps best support the ARV.
Projected returns pro-forma
-3.0% appreciation · 0.72% rent growth · sell at horizon
- IRR
- -4.1%
- Equity multiple
- 0.85×
- Total profit
- $-45,425
- Equity at exit
- $161,733
- IRR
- 2.8%
- Equity multiple
- 1.18×
- Total profit
- $54,183
- Equity at exit
- $93,785
Cash invested: $303,717 (down + closing). Projections, not guarantees.
Landlord ↔ Tenant lean methodology
- Overall (STATE)
- 55 Moderately Landlord-Leaning
- State Virginia
- 55 Moderately Landlord-Leaning · D+2
- County
- — inherits STATE
- City
- — inherits STATE
ZIP-level market 24016
- Home prices YoY
- -27.6%
- Rents YoY
- 0.7%
- Active inventory
- 89
- Price-to-rent
- 78.7×
Monthly cashflow live
- Estimated rent
- $12,639 high interval (Pro) →
- Mortgage (P&I)
- −$5,688
- Tax est. 1.5%
- −$1,356 /mo · $16,271/yr
- Insurance
- −$452
- HOA
- −$0
- Vacancy / Maint / Mgmt
- −$2,654
- Net cashflow
- $2,489
Break-even live
11-unit breakdown (identical units grouped — click to expand)
| Units | Beds | Baths | Est. rent |
|---|---|---|---|
| 11× units | 1 | 1 | $12,639 |
| #1 | 1 | 1 | $1,149 |
| #2 | 1 | 1 | $1,149 |
| #3 | 1 | 1 | $1,149 |
| #4 | 1 | 1 | $1,149 |
| #5 | 1 | 1 | $1,149 |
| #6 | 1 | 1 | $1,149 |
| #7 | 1 | 1 | $1,149 |
| #8 | 1 | 1 | $1,149 |
| #9 | 1 | 1 | $1,149 |
| #10 | 1 | 1 | $1,149 |
| #11 | 1 | 1 | $1,149 |
| Total (11 units) | $12,639 | ||
UW: 25.0% down · 7.5% · 30yr · 1.5% tax · 5.0% vac · 8.0% maint · 8.0% mgmt
Financing live
Cash to close
- Down payment
- $271,176
- Closing costs
- $32,541
- Reserves months
- —
- Total cash needed
- —
Loan-product check · same deal, 3 products live
Conventional
25% down · 7.5% · 30yr
- Down + closing
- —
- Monthly P&I
- —
- Monthly cashflow
- —
- DSCR
- —
- Eligible?
- —
Personal DTI + credit; lowest rate.
DSCR
20% down · 8.5% · 30yr
- Down + closing
- —
- Monthly P&I
- —
- Monthly cashflow
- —
- DSCR
- —
- Eligible?
- —
No personal income docs; deal must DSCR.
Hard money
10% down · 12.0% · 12mo
- Down + closing
- —
- Monthly P&I
- —
- Monthly cashflow
- —
- DSCR
- —
- Eligible?
- —
Short-term bridge; refi at stabilization.
Rent comps 40 comps
| Address | Beds | Baths | Sqft | Rent | $/sqft | DOM | Units | Dist |
|---|---|---|---|---|---|---|---|---|
| 1334 Chapman Ave SW Apt 4 Roanoke, VA | 2.0 | 1.0 | — | $1,075 | — | 43d | 1 | 0.18mi |
| 1430 Chapman Ave SW Unit 2 Roanoke, VA | 2.0 | 1.0 | — | $1,150 | — | 13d | 1 | 0.20mi |
| 1405 Chapman Ave SW Roanoke, VA | 1.0 | 1.0 | — | $815 | — | 43d | 1 | 0.21mi |
| 1422 Patterson Ave SW Unit 1 Roanoke, VA | 2.0 | 1.0 | — | $1,125 | — | 13d | 1 | 0.25mi |
| 1106 Campbell Ave SW Roanoke, VA | 2.0 | 1.0 | 850 | $950 | $1.12 | 13d | 1 | 0.29mi |
| 1624 Chapman Ave SW Unit A6 Roanoke, VA | 1.0 | 1.0 | 650 | $799 | $1.23 | 20d | 1 | 0.30mi |
| 1517 Lexington Ave SW Unit 1 Roanoke, VA | 2.0 | 1.0 | 813 | $1,050 | $1.29 | 43d | 1 | 0.31mi |
| 1517 Lexington Ave SW Unit 3 Roanoke, VA | 2.0 | 1.0 | 813 | $1,025 | $1.26 | 43d | 1 | 0.31mi |
| 1601 Memorial Ave SW Unit A5 Roanoke, VA | 2.0 | 1.0 | — | $1,050 | — | 43d | 1 | 0.32mi |
| 1131 Wasena Ave SW Roanoke, VA | 1.0 | 1.0 | — | $1,150 | — | 20d | 1 | 0.32mi |
| 1602 Memorial Ave SW Roanoke, VA | 1.0 | 1.0 | 1250 | $1,800 | $1.44 | 43d | 1 | 0.34mi |
| 1630 Patterson Ave SW Unit B Roanoke, VA | 3.0 | 1.0 | 1200 | $1,395 | $1.16 | 43d | 1 | 0.35mi |
| 1717 Chapman Ave SW Roanoke, VA | 2.0 | 1.0 | — | $1,195 | — | 13d | 1 | 0.37mi |
| 1813 Oxford Ave SW Roanoke, VA | 2.0 | 1.0 | 800 | $1,200 | $1.50 | 43d | 1 | 0.39mi |
| 1215 Valley Ave SW Roanoke, VA | 2.0 | 2.0 | 840 | $1,650 | $1.96 | 20d | 1 | 0.41mi |
| 1219 Valley Ave SW Roanoke, VA | 2.0 | 2.0 | 840 | $1,750 | $2.08 | 20d | 1 | 0.41mi |
| 1701 Westover Ave SW Roanoke, VA | 1.0–2.0 | 1.0 | 876 | $1,045 | $1.19 | 43d | 4 | 0.46mi |
| 1825 Patterson Ave SW Unit B Roanoke, VA | 2.0 | 1.0 | 1000 | $850 | $0.85 | 43d | 1 | 0.50mi |
| 10 12 1/2 St SW Roanoke, VA | 3.0 | 1.5 | 999 | $1,023 | $1.02 | 43d | 1 | 0.53mi |
| 1901 Patterson Ave SW Apt A Roanoke, VA | 3.0 | 1.0 | — | $1,200 | — | 43d | 1 | 0.53mi |
| 1331 Main St SW Roanoke, VA | 2.0 | 1.0 | 877 | $1,023 | $1.17 | 20d | 1 | 0.58mi |
| 829 Salem Ave SW Unit 3 Roanoke, VA | 1.0 | 1.0 | 443 | $1,900 | $4.29 | 13d | 1 | 0.59mi |
| 802 Rorer Ave SW Apt A Roanoke, VA | 2.0 | 1.0 | 820 | $895 | $1.09 | 43d | 1 | 0.60mi |
| 934 Floyd Ave SW Unit B Roanoke, VA | 2.0 | 1.0 | — | $1,095 | — | 13d | 1 | 0.64mi |
| 631 Campbell Ave SW Unit 111 Roanoke, VA | 1.0 | 1.0 | 575 | $1,035 | $1.80 | 20d | 1 | 0.69mi |
| 701 Salem Ave SW Roanoke, VA | 2.0 | 1.0 | 1250 | $1,950 | $1.56 | 43d | 1 | 0.71mi |
| 605 Calvary St SW Apt A Roanoke, VA | 1.0 | 1.0 | 838 | $2,100 | $2.51 | 13d | 1 | 0.71mi |
| 605 Calvary St SW Apt A Roanoke, VA | 1.0 | 1.0 | 838 | $2,100 | $2.51 | 20d | 1 | 0.71mi |
| 505 6th St SW Unit 229 Roanoke, VA | 1.0 | 1.0 | 800 | $1,275 | $1.59 | 44d | 1 | 0.72mi |
| 602 Elm Ave Unit B Roanoke, VA | 2.0 | 1.0 | 1804 | $1,250 | $0.69 | 43d | 1 | 0.73mi |
| 1933 Windsor Ave SW Unit 4 Roanoke, VA | 1.0 | 1.0 | 1000 | $1,800 | $1.80 | 43d | 1 | 0.77mi |
| 1709 Sherwood Ave SW Roanoke, VA | 2.0 | 1.0 | 1271 | $1,650 | $1.30 | 43d | 1 | 0.79mi |
| 743 Suburban Ave SW Unit Suburban 745 Roanoke, VA | 2.0 | 1.0 | 1134 | $1,100 | $0.97 | 13d | 1 | 0.79mi |
| 711 Suburban Ave SW Roanoke, VA | 2.0 | 1.5 | 910 | $1,050 | $1.15 | 20d | 1 | 0.81mi |
| 518 Elm Ave Unit B Roanoke, VA | 2.0 | 1.0 | 3062 | $1,200 | $0.39 | 20d | 1 | 0.81mi |
| 1520 Sherwood Ave SW Roanoke, VA | 2.0 | 1.0 | 900 | $1,500 | $1.67 | 13d | 1 | 0.83mi |
| 2102 Westover Ave SW Unit 3 Roanoke, VA | 1.0 | 1.0 | 600 | $899 | $1.50 | 43d | 1 | 0.84mi |
| 1502 Gilmer Ave NW Apt B Roanoke, VA | 2.0 | 1.0 | — | $995 | — | 13d | 1 | 0.87mi |
| 1716 Grandin Rd SW Unit 7 Roanoke, VA | 2.0 | 1.0 | 1000 | $1,025 | $1.02 | 43d | 1 | 0.87mi |
| 1732 Grandin Rd SW Unit 57 Roanoke, VA | 2.0 | 1.0 | 814 | $1,045 | $1.28 | 43d | 1 | 0.87mi |
Listing history 21 events
-
2026-06-18days on market $1,084,705 Active 329 DOM
-
2026-06-17days on market $1,084,705 Active 328 DOM
-
2026-06-16days on market $1,084,705 Active 327 DOM
-
2026-06-15days on market $1,084,705 Active 326 DOM
-
2026-06-14days on market $1,084,705 Active 324 DOM
-
2026-06-13days on market $1,084,705 Active 323 DOM
-
2026-06-10days on market $1,084,705 Active 321 DOM
-
2026-06-09days on market $1,084,705 Active 320 DOM
-
2026-06-08days on market $1,084,705 Active 319 DOM
-
2026-06-05days on market $1,084,705 Active 315 DOM
-
2026-06-03days on market $1,084,705 Active 314 DOM
-
2026-06-02days on market $1,084,705 Active 313 DOM
-
2026-06-01days on market $1,084,705 Active 312 DOM
-
2026-05-31days on market $1,084,705 Active 311 DOM
-
2026-05-30days on market $1,084,705 Active 310 DOM
-
2026-02-05price $1,084,705 80-char remark
Show marketing remark (80 chars)
11 units occupied, 1 unit vacant. Full basement in 813, partial basement in 821.
-
2026-01-05price $1,106,842 80-char remark
Show marketing remark (80 chars)
11 units occupied, 1 unit vacant. Full basement in 813, partial basement in 821.
-
2025-11-12price $1,129,430 80-char remark
Show marketing remark (80 chars)
11 units occupied, 1 unit vacant. Full basement in 813, partial basement in 821.
-
2025-10-08price $1,152,480 80-char remark
Show marketing remark (80 chars)
11 units occupied, 1 unit vacant. Full basement in 813, partial basement in 821.
-
2025-09-03price $1,176,000 80-char remark
Show marketing remark (80 chars)
11 units occupied, 1 unit vacant. Full basement in 813, partial basement in 821.
-
2025-07-24$1,200,000 Active 80-char remark
Show marketing remark (80 chars)
11 units occupied, 1 unit vacant. Full basement in 813, partial basement in 821.
ⓘ Source: listings_history table (triggers on properties + properties_extension) + one-shot
backfill from property_details.listing_events for pre-trigger history.
Climate risk First Street
- Flood 1/10 Low FEMA zone X (unshaded) · 0% chance over 30 yrs
- Wildfire 1/10 Low
- Heat 5/10 Major 7 d/yr ≥101°F today · 19 d/yr by 30 yrs out
- Wind 2/10 Low 100% chance of damaging wind over 30 yrs
- Air quality 1/10 Low 0 unhealthy d/yr today · 0 by 30 yrs out
Nearby sold comps map
Loading sold comps map…
Walkable amenities ~0.75 mi
Loading nearby amenities…
Taxation est. · year 1
- Rental income
- $151,668
- − Mortgage interest
- −$60,760
- − Property taxes
- −$16,271
- − Insurance
- −$5,424
- − Repairs & maintenance
- −$12,133
- − Management
- −$12,133
- − Depreciation
- −$31,555
- Taxable income
- $13,392
- Est. tax owed @ 24.0%
- −$3,214
- After-tax cash flow
- $26,650/yr
For passive investors: Depreciation is non-cash, so a rental often shows a tax loss while cash-flowing — sheltering income. Rental losses are passive: they offset passive income freely, and up to $25,000/yr can offset ordinary (W-2) income if you actively participate and your MAGI is under $100k (phasing out to $0 by $150k); unused losses carry forward. On sale, claimed depreciation is recaptured at up to 25%, and gains may owe capital-gains tax (a 1031 exchange can defer both). Figures are a year-1 estimate at your 24.0% rate — not tax advice; consult a CPA.
Condition & rehab AI · 13 photos
The property is in fair condition with some minor repairs and maintenance needed. It has a good kitchen and bathrooms, but the exterior and landscaping require attention. Value can be added with a fresh coat of paint and some landscaping work.
Repairs flagged
- Minor Paint touch-up — Paint appears slightly worn on exterior.
- Minor Landscaping — Needs some landscaping work to improve curb appeal.
Value-add opportunities
- Both Paint touch-up — Improves curb appeal and overall appearance.
- Both Landscaping — Enhances curb appeal and makes the property more inviting.
Renovation cost estimate screening
| Repair item | Severity | Est. cost |
|---|---|---|
| Paint touch-up · Paint appears slightly worn on exterior. | Minor | $500–3,000 |
| Landscaping · Needs some landscaping work to improve curb appeal. | Minor | $500–3,000 |
| Total estimated repair cost · 2 items | $1,000–6,000 |
Value-add ROI direction
- Both Paint touch-up — Improves curb appeal and overall appearance. ↑
- Both Landscaping — Enhances curb appeal and makes the property more inviting. ↑
ⓘ Cost ranges are severity-bucket heuristics (US national rule-of-thumb). Get contractor quotes + a written scope before underwriting a rehab budget.
Schools (NCES district)
- District
- Roanoke City Public School District
- NCES district ID
- 5103300
- Math proficiency
- 40% ▼ -38.00%
- Reading proficiency
- 58% ▼ -12.00%
- Median HH income
- $38,592
- Composite
- 40.8/100
- National rank
- #3639
- State rank
- #102 of 131 in VA
Livability — Roanoke
- Score
- 73/100
- State rank
- #163
- US rank
- #5055
Category grades
Schools grade is shown separately in the Schools card above.
Census & demographics
- Census place
- Roanoke, VA
- County
- Roanoke City · 101,625 people
- City population
- 168,930
- Metro
- Roanoke, VA
- Population (ZIP)
- 10,521
- Household income
- $46,512
- Rent vs Own
- Severe rent burden
- 728.0
Population outlook (Roanoke County) Hauer SSP2
- Today (2025)
- 106,094 people
- By 2030
- 108,927 · +2.7%
- By 2040
- 114,104 · +7.5%
- By 2050
- 118,032 · +11.3%
- By 2075
- 123,363 · +16.3%
- By 2100
- 116,827 · +10.1%
Race, ethnicity, and origin ACS 2023
- Neighborhood character
- Diverse neighborhood (Simpson 0.58)
- Race & ethnicity
- Black 48% White 42% Two or more races 5% Hispanic / Latino 4% Asian 2%
- Common ancestry
- Italian 2% Serbian 1% Lithuanian 1%
- Foreign-born
- 5% · Canada, South Korea
- Languages at home
- 95% English-only · Spanish 2% French/Haitian/Cajun 1% Other Indo-European 1%
Political lean MEDSL · Roanoke
- 2024 margin
- Strong D (+23.6) · D 61.1% · R 37.5% · Other 1.4%
- 2008→2024 swing
- +0.2pp no change · 2008: 23.4pp · 2024: 23.6pp
- All cycles
- 2024: D+23.6 2020: D+25.8 2016: D+17.6 2012: D+21.5 2008: D+23.4
Not yet ingested
- Civics
- —
Market trends
- HPI YoY
- ▼ -98.06%
- Current HPI
- 257.8158
- Rent YoY
- ▲ 0.72%
- Metro
- Roanoke, VA
- State GDP YoY
- ▲ 2.40%
- F500 in state
- 50
Industry mix (Fortune 500 HQ in VA)
| Industry | F500 HQs | Revenue |
|---|---|---|
| Aerospace / Defense | 4 | $236B |
|
||
| Technology / Defense | 3 | $32B |
|
||
| Financial Services | 2 | $176B |
|
||
| Utilities | 2 | $27B |
|
||
| Insurance | 2 | $25B |
|
||
| Technology | 2 | $15B |
|
||
Price history
-9.6% since first listed6 events — show timeline
- 2026-02-05 Price Changed $1,084,705 MLSRV
- 2026-01-05 Price Changed $1,106,842 MLSRV
- 2025-11-12 Price Changed $1,129,430 MLSRV
- 2025-10-08 Price Changed $1,152,480 MLSRV
- 2025-09-03 Price Changed $1,176,000 MLSRV
- 2025-07-24 Listed $1,200,000 MLSRV
Cash-flow waterfall
monthlySold comps — $/sqft
last 12 mo · ≤1 miLoading sold comps…