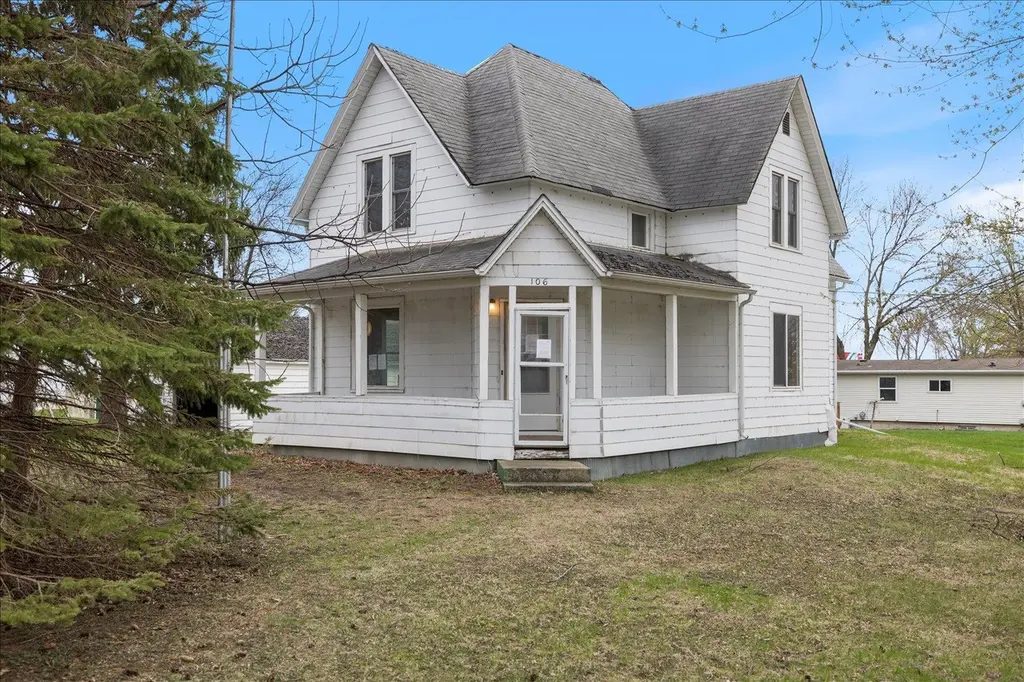
106 E Park Ave · Fairfax, MN
Flood risk 1/10 · Minimal
- FEMA flood zone
- X (unshaded)
- Chance of flooding over 30 yrs
- 0.0%
- Est. flood insurance / yr
- $473 – $860
Fire risk 1/10 · Minimal
- Est. fire insurance / yr
- $888 – $1,650
Heat risk 2/10 · Minimal
- Hot days now (above 99°F)
- 7 days/yr
- Hot days in 30 yrs
- 15 days/yr
Wind risk 2/10 · Minimal
- Chance of severe wind over 30 yrs
- —
Air-quality risk 1/10 · Minimal
- Unhealthy air days now
- 0 days/yr
- Unhealthy air days in 30 yrs
- 0 days/yr
Risk factors via First Street. Map © Google.
Why this score? — see what drove the A grade
The composite is a weighted blend of 9 inputs, each scored 0–100. Each bar is that input's sub-score; the figure is the points it added to the 100-point composite (weight × sub-score).
- Cash flow +30.0/30.0
- ARV discount +15.0/15.0
- 1% rule +10.0/10.0
- DSCR +10.0/10.0
- Appreciation +10.0/10.0
- Schools +3.8/10.0
- Livability +3.7/5.0
- Rent growth +2.5/5.0
- Condition / age +2.5/5.0
$69,900
🖨 Deal sheet 📄 Offer letter ✓ Due diligence
Listing remarks
Step into timeless character and space with this 1910-built home offering 1,516 finished square feet, 3 bedrooms, and 2 baths. Situated on a large corner lot in the heart of Buffalo Lake, this property features generously sized rooms, two fireplaces, and a classic wraparound front porch—perfect for relaxing. Inside, you’ll find spacious living areas with original charm and a layout that offers flexibility for a variety of needs. The home presents a great opportunity for those looking to build equity and bring their own vision to life, with room to enhance and update over time. The oversized four-car detached garage is a standout feature, offering abundant space for vehicles, sto
Key facts
- Large corner lot
- Two fireplaces
- 0.64 acre lot
Tags
Property features AI
Exterior
- Parking: Attached or detached 4-car garage
- Utilities: City water connected; City sewer connected; Natural gas
- Home design: Residential two-story home; Entry on main level; Above-grade finished living area approximately 1,516
- Construction: Stone foundation; Roof older than 8 years
- Exterior features: Wrap-around front porch; Wood siding; Corner lot with 142x150 dimensions; City street frontage on a public maintained road
Interior
- Kitchen: Kitchen on main level (10x14)
- Bedrooms: Three bedrooms (all on upper level except den on main level); Bedroom sizes: 14x14, 13x11, 10x10; Den on main level (11x13)
- Bathrooms: One three-quarter bath; One half bath
- Heating & cooling: Baseboard heating; No central air
- Interior features: Main floor laundry; Partial unfinished basement; Two wood-burning fireplaces
- Laundry & utility: Laundry room on main level
Neighborhood map
What this means for you Summary
Snapshot
- This is a 3-bed/2.0-bath single-family listed at $70k.
Deal economics
- At list price, monthly cash flow is $354 ($4k/yr) — positive.
- The deal already cash-flows at list — no discount required.
- Meets the 1% rule at list price ($1k rent vs $70k).
- Recommended offer: $68k (3.0% below list) — sets the bar for market timing.
Location & tenants
- Location reads 73/100 on livability (#261 in MN) — a middle-class / working-renter tenant base. Strengths: crime A+, cost of living A+, housing A+; Watch: health & safety D+, amenities F, commute F.
- G.F.W. (rural): math 40% / reading 48% proficiency, ranked #186 of 301 in MN (top 62%) — families likely to look elsewhere, expect single-tenant / working-renter base with shorter leases.
- Market conditions: 12 active listings in the ZIP; 17 units permitted in Renville County in 2024 (0 in 5+ unit buildings).
Forward outlook
- In year one you build about $7k of equity ($483 loan paydown + $7k appreciation (10.0% local appreciation)).
- Renville County population projected at -28% by 2050 — secular population decline; favor cash flow + early exit over multi-decade hold.
- At projected returns (10.0% appreciation + 3.0% rent growth), your $20k cash investment doubles in ~2 years — after that, you're playing with house money.
- By year 5, paydown + projected appreciation supports a ~$35k cash-out refi (75% LTV) — recoverable capital for the next deal without selling this one.
Negotiation context
- It's been on market 55 days — a 3% lower offer ($68k) is reasonable based on typical stale-listing flexibility.
Risks & watch-outs
- Watch-outs: built in 1905 — expect roof / HVAC / electrical / plumbing capex.
Questions for the listing agent
- It's been on market 55 days. Have you received any prior offers? Is the seller open to a 3% concession, seller financing, or rate buy-down credit?
- Built in 1905 — when were the roof, HVAC, electrical panel, plumbing, and water heater last replaced?
- Is there a deadline driving the sale (1031 exchange, divorce, estate, relocation)? That informs how much negotiation room exists.
- What's the average days-on-market for RENTAL listings here right now (not sales)? A rising rental-DOM trend means longer vacancies and softer asking-rent achievability than the comps imply.
- What's the recent tenant-quality profile in this submarket — average credit score on applications, eviction rate, late-payment / NSF rate, and stable-employment percentage? A property-management company in the area should have these aggregated.
- How much new for-sale + rental construction is in the pipeline within 1–3 miles? Heavy new supply typically softens prices + rents 12–24 months out; constrained supply supports both.
Investment metrics
- 1% rule
- 1.58% ✓
- Cap rate
- 12.37%
- Cash-on-cash
- 21.72%
- DSCR
- 1.97
- GRM
- 5.3
CMA / ARV
- ARV (on-the-fly)
- $126,558
- Comps found
- 3
Show comp detail 3 sales within ~0.75 mi
| Address | Dist | Beds/Ba | Sqft | Sold | Price | $/sf | Match |
|---|---|---|---|---|---|---|---|
| 17 NE 1st Ave | 0.05mi | 2/2.0 (-1) | 1,412 (-1%) | 12mo | $125,000 | $89 | 82 |
| 12 3rd St NE | 0.23mi | 4/1.0 (+1) | 1,520 (+7%) | 22mo | $110,000 | $72 | 51 |
| 12 NE 4th St | 0.35mi | 3/2.0 | 1,260 (-11%) | 22mo | $141,500 | $112 | 46 |
Match score weights: distance 35% · size 25% · config 20% · recency 20%. Top-matched comps best support the ARV.
Projected returns pro-forma
10.0% appreciation · 3.0% rent growth · sell at horizon
- IRR
- 40.6%
- Equity multiple
- 4.10×
- Total profit
- $60,670
- Equity at exit
- $62,971
- IRR
- 35.0%
- Equity multiple
- 9.23×
- Total profit
- $160,996
- Equity at exit
- $135,800
Cash invested: $19,572 (down + closing). Projections, not guarantees.
Landlord ↔ Tenant lean methodology
- Overall (STATE)
- 46 Balanced
- State Minnesota
- 46 Balanced · D+2
- County
- — inherits STATE
- City
- — inherits STATE
ZIP-level market 55332
- Home prices YoY
- 5.2%
- Active inventory
- 12
- Price-to-rent
- 5.3×
Monthly cashflow live
- Estimated rent
- $1,104 medium interval (Pro) →
- Mortgage (P&I)
- −$367
- Tax from tax record
- −$122 /mo · $1,470/yr
- Insurance
- −$29
- HOA
- −$0
- Vacancy / Maint / Mgmt
- −$232
- Net cashflow
- $354
Break-even live
UW: 25.0% down · 7.5% · 30yr · 1.5% tax · 5.0% vac · 8.0% maint · 8.0% mgmt
Financing live
Cash to close
- Down payment
- $17,475
- Closing costs
- $2,097
- Reserves months
- —
- Total cash needed
- —
Loan-product check · same deal, 3 products live
Conventional
25% down · 7.5% · 30yr
- Down + closing
- —
- Monthly P&I
- —
- Monthly cashflow
- —
- DSCR
- —
- Eligible?
- —
Personal DTI + credit; lowest rate.
DSCR
20% down · 8.5% · 30yr
- Down + closing
- —
- Monthly P&I
- —
- Monthly cashflow
- —
- DSCR
- —
- Eligible?
- —
No personal income docs; deal must DSCR.
Hard money
10% down · 12.0% · 12mo
- Down + closing
- —
- Monthly P&I
- —
- Monthly cashflow
- —
- DSCR
- —
- Eligible?
- —
Short-term bridge; refi at stabilization.
Listing history 17 events
-
2026-06-18days on market $69,900 Active 55 DOM
-
2026-06-17days on market $69,900 Active 54 DOM
-
2026-06-16days on market $69,900 Active 53 DOM
-
2026-06-15days on market $69,900 Active 52 DOM
-
2026-06-13days on market $69,900 Active 50 DOM
-
2026-06-12days on market $69,900 Active 49 DOM
-
2026-06-09days on market $69,900 Active 46 DOM
-
2026-06-08days on market $69,900 Active 45 DOM
-
2026-06-07days on market $69,900 Active 44 DOM
-
2026-06-07statusdays on market $69,900 Active 43 DOM
-
2026-06-04days on market $69,900 Contingent - Inspection 40 DOM
-
2026-06-02days on market $69,900 Contingent - Inspection 39 DOM
-
2026-06-01days on market $69,900 Contingent - Inspection 38 DOM
-
2026-05-31days on market $69,900 Contingent - Inspection 37 DOM
-
2026-05-31days on market $69,900 Contingent - Inspection 36 DOM
-
2026-05-23historical Contingent - Inspection
-
2026-04-24$69,900 Active
ⓘ Source: listings_history table (triggers on properties + properties_extension) + one-shot
backfill from property_details.listing_events for pre-trigger history.
Tax reassessment forecast MN · Partial reset (capped growth)
- Current annual tax
- $1,470 · $122/mo
- Projected year-2 tax
- $1,470 · $122/mo
- Expected delta
- $0/yr ($0/mo · 0.0%)
ⓘ Screening estimate from a state-policy table — verify with the county assessor before closing.
Climate risk First Street
- Flood 1/10 Low FEMA zone X (unshaded) · 0% chance over 30 yrs
- Wildfire 1/10 Low
- Heat 2/10 Low 7 d/yr ≥99°F today · 15 d/yr by 30 yrs out
- Wind 2/10 Low
- Air quality 1/10 Low 0 unhealthy d/yr today · 0 by 30 yrs out
Nearby sold comps map
Loading sold comps map…
Walkable amenities ~0.75 mi
Loading nearby amenities…
Taxation est. · year 1
- Rental income
- $13,252
- − Mortgage interest
- −$3,915
- − Property taxes
- −$1,470
- − Insurance
- −$350
- − Repairs & maintenance
- −$1,060
- − Management
- −$1,060
- − Depreciation
- −$2,033
- Taxable income
- $3,363
- Est. tax owed @ 24.0%
- −$807
- After-tax cash flow
- $3,444/yr
For passive investors: Depreciation is non-cash, so a rental often shows a tax loss while cash-flowing — sheltering income. Rental losses are passive: they offset passive income freely, and up to $25,000/yr can offset ordinary (W-2) income if you actively participate and your MAGI is under $100k (phasing out to $0 by $150k); unused losses carry forward. On sale, claimed depreciation is recaptured at up to 25%, and gains may owe capital-gains tax (a 1031 exchange can defer both). Figures are a year-1 estimate at your 24.0% rate — not tax advice; consult a CPA.
Schools (NCES district)
- District
- G.F.W.
- NCES district ID
- 2712580
- Math proficiency
- 40% ▼ -12.00%
- Reading proficiency
- 48% ▼ -13.00%
- Median HH income
- $50,233
- Composite
- 37.81/100
- National rank
- #4335
- State rank
- #186 of 301 in MN
Livability — Fairfax
- Score
- 73/100
- State rank
- #261
- US rank
- #5692
Category grades
Schools grade is shown separately in the Schools card above.
Census & demographics
- Census place
- Fairfax, MN
- Population (ZIP)
- 1,714
Population outlook (Renville County) Hauer SSP2
- Today (2025)
- 13,251 people
- By 2030
- 12,443 · -6.1%
- By 2040
- 10,946 · -17.4%
- By 2050
- 9,598 · -27.6%
- By 2075
- 7,411 · -44.1%
- By 2100
- 5,768 · -56.5%
Race, ethnicity, and origin ACS 2023
- Neighborhood character
- Predominantly White (78%)
- Race & ethnicity
- White 78% Hispanic / Latino 17% Two or more races 12% Asian 1%
- Hispanic origin (detail)
- Mexican 15% Cuban 2%
- Common ancestry
- Portuguese 12% Italian 4% Scottish 1%
- Foreign-born
- 10% · Canada, Jamaica
- Languages at home
- 86% English-only · Spanish 12% German/W. Germanic 1% Other Asian/Pacific 1%
Political lean MEDSL · Renville
- 2024 margin
- Solid R (+41.4) · D 28.4% · R 69.8% · Other 1.9%
- 2008→2024 swing
- -40.8pp toward R · 2008: -0.6pp · 2024: -41.4pp
- All cycles
- 2024: R+41.4 2020: R+36.5 2016: R+36.7 2012: R+9.8 2008: R+0.6
Not yet ingested
- Civics
- —
Market trends
- HPI YoY
- ▲ 12.54%
- Current HPI
- 252.2828
- Rent YoY
- —
- Metro
- —
- State GDP YoY
- ▲ 2.41%
- F500 in state
- 34
Industry mix (Fortune 500 HQ in MN)
| Industry | F500 HQs | Revenue |
|---|---|---|
| Healthcare | 2 | $407B |
|
||
| Retail | 2 | $150B |
|
||
| Consumer Goods | 2 | $32B |
|
||
| Industrial Machinery | 2 | $6B |
|
||
| Agriculture | 1 | $40B |
|
||
| Healthcare / Medical Devices | 1 | $32B |
|
||
Price history
2 events — show timeline
- 2026-05-23 Contingent — NORTHSTARMLS as Distributed by MLS Grid
- 2026-04-24 Listed $69,900 NORTHSTARMLS as Distributed by MLS Grid
Property tax history
+1.4%/yrLatest (2026): $1,470 · +16.7% YoY. Source: county tax records.
Cash-flow waterfall
monthlySold comps — $/sqft
last 12 mo · ≤1 miLoading sold comps…