 Multi-family
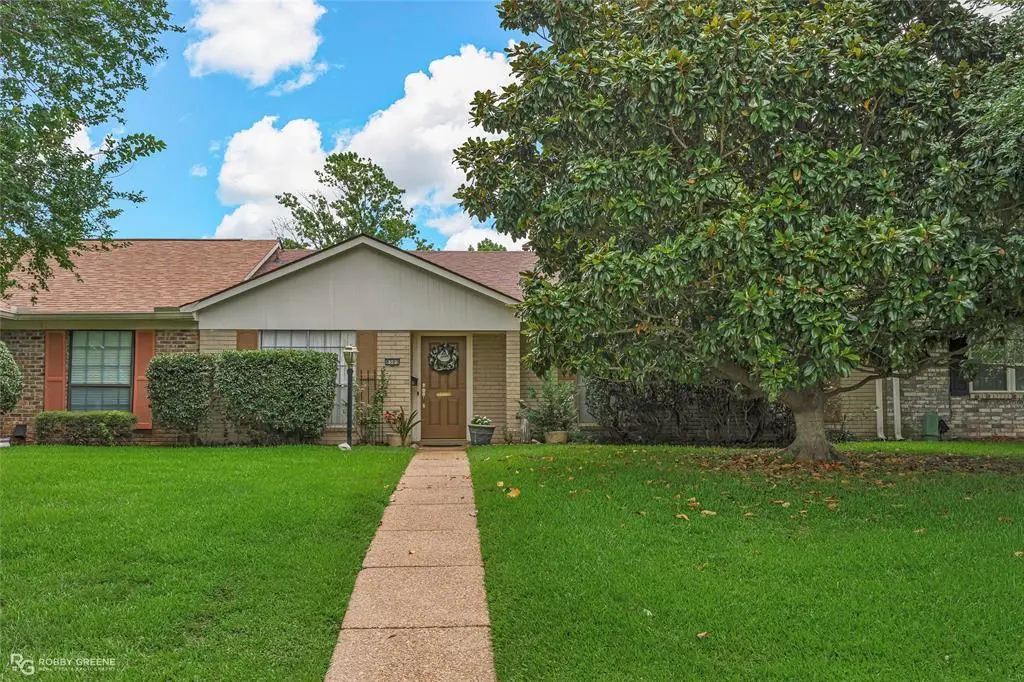
8503 Grover Pl · Shreveport, LA
Flood risk 1/10 · Minimal
- FEMA flood zone
- X
- Chance of flooding over 30 yrs
- 0.0%
- Est. flood insurance / yr
- $507 – $1,088
Fire risk 1/10 · Minimal
- Est. fire insurance / yr
- $1,269 – $2,357
Heat risk 7/10 · Major
- Hot days now (above 110°F)
- 7 days/yr
- Hot days in 30 yrs
- 22 days/yr
Wind risk 6/10 · Moderate
- Chance of severe wind over 30 yrs
- 68.0%
Air-quality risk 2/10 · Minimal
- Unhealthy air days now
- 0 days/yr
- Unhealthy air days in 30 yrs
- 1 days/yr
Risk factors via First Street. Map © Google.
Why this score? — see what drove the B- grade
The composite is a weighted blend of 9 inputs, each scored 0–100. Each bar is that input's sub-score; the figure is the points it added to the 100-point composite (weight × sub-score).
- Cash flow +30.0/30.0
- 1% rule +10.0/10.0
- DSCR +10.0/10.0
- ARV discount +7.5/15.0
- Livability +3.0/5.0
- Rent growth +2.5/5.0
- Condition / age +2.5/5.0
- Schools +2.2/10.0
- Appreciation +0.0/10.0
$175,500
🖨 Deal sheet 📄 Offer letter ✓ Due diligence
Multi-family units
County records classify this as Multi-Family (2-4 Unit). Listing-text estimate: 1 unit. estimate disagrees with records
Listing remarks
One story delightful 3 bedroom 2 bath convenient to shopping, schools restaurants, and hospitals with easy upkeep brick exterior. The cook will enjoy the updated kitchen with good cabinet space and opens to the dining and breakfast room. The spacious living room provides a great area for entertaining or relaxing. Another plus is a private covered back patio and an additional storage building has electricity can be shop or hobby room. 2 car carport at the rear. and a utility room. Refrigerator, washer and dryer may remain with the house if desired.
Key facts
- Brick exterior
- Utility room
- Updated kitchen
Tags
Property features AI
Finance
- Other: Subdivision: South Broadmoor Subn
- Financial info: No second mortgage indicated; Loan type treated as clear
- HOA & community: Mandatory association with monthly fee ($87); HOA includes grounds maintenance
Exterior
- Parking: Carport (detached) with 2 covered spaces; Additional storage in parking area
- Security: Smoke detectors; Carbon monoxide detector(s)
- Utilities: City water; City sewer; Individual gas meter
- Home design: Single-family residence; One story; Residential property (not attached)
- Construction: Brick construction; Composition (shingle) roof; Slab foundation; Built in 1976 (preowned)
- Exterior features: Covered courtyard; Covered rear porch; Covered porches; Sprinkler system; Fenced yard (full, masonry/rock/stone)
Interior
- Kitchen: Built-in cabinets; Pantry; Dual sinks; Dishwasher; Disposal; Electric cooktop; Electric range; Eat-in kitchen
- Bedrooms: Three bedrooms (all on main level); Primary bedroom with walk-in closet; Additional bedroom with walk-in closet
- Flooring: Carpet; Ceramic tile; Linoleum
- Bathrooms: Two full bathrooms; Bathroom(s) with built-in cabinets and solid surface counters; Kitchen with dual sinks (included in kitchen features)
- Heating & cooling: Central heating; Central air conditioning; Electric cooling
- Interior features: Cable TV available; Cathedral ceilings; Chandelier; Eat-in kitchen; Walk-in closets; Seven total rooms; One living area; Two dining areas; One-level home
- Laundry & utility: Utility room with built-in cabinets; Full-size washer/dryer area
Neighborhood map
What this means for you Summary
Snapshot
- This is a 3-bed/2.0-bath multifamily listed at $176k.
Deal economics
- At list price, monthly cash flow is $915 ($11k/yr) — positive.
- The deal already cash-flows at list — no discount required.
- Meets the 1% rule at list price ($3k rent vs $176k).
- Cap rate 12.5% vs local median 5.7% in Shreveport — top-decile yield for the area; either an underpriced asset or a hidden risk that comps aren't pricing in. Stress-test before assuming the spread holds.
Location & tenants
- Location reads 59/100 on livability (#270 in LA) — a working-class tenant base; expect higher turnover. Strengths: cost of living A+, housing A; Watch: schools D+, crime F, amenities F.
- Caddo Parish (urban): math 21% / reading 32% proficiency, ranked #53 of 98 in LA (top 54%) — low school quality limits family demand, transient renter base, plan for 1-2y turnover; 64% free/reduced lunch — lower-income household profile, screen leases tightly.
- Market conditions: Rents flat; 105 active listings in the ZIP; 18 comparable units currently listed for rent nearby; rentals at typical pace (median 21d on market — plan ~3-4 weeks tenant-placement turnaround); 221 units permitted in Caddo Parish in 2024 (0 in 5+ unit buildings).
- At $2,813/mo this rent would consume 52% of the median local household income ($66k/yr) (locally 582% of renters already pay >50% of income on rent) — very limited rent-growth headroom before tenants either downsize or default.
Forward outlook
- Local home prices are declining (-3.0%/yr); year-one equity from $1k of loan paydown is wiped out by about $5k of value loss. Plan a longer hold.
- Caddo County population projected at -15% by 2050 — secular population decline; favor cash flow + early exit over multi-decade hold.
- At projected returns (-3.0% appreciation + 0.1% rent growth), your $49k cash investment doubles in ~7 years — after that, you're playing with house money.
Negotiation context
- Only 9 days on market — expect competitive offers; lowballing is unlikely to land.
Risks & watch-outs
- Climate carrying-cost: major wind risk, 68% chance of damaging wind over 30y; extreme-heat days projected 7→22/yr by 2055 (HVAC capex compounding) — expect insurance premiums to compound above CPI over the hold.
Questions for the listing agent
- Built in 1976 — when were the roof, HVAC, electrical panel, plumbing, and water heater last replaced?
- What does the HOA fee cover, when was the last increase, and are there any pending special assessments or reserve-fund shortfalls?
- Is there a deadline driving the sale (1031 exchange, divorce, estate, relocation)? That informs how much negotiation room exists.
- Schools are D-rated, which usually means shorter tenancies and higher turnover. Who's the typical renter profile here, and what's been the actual vacancy rate?
- Crime grade is F in this area — have there been break-ins, vandalism, or insurance claims at this property in the last 3 years? What carrier currently insures it and at what premium?
- What's the average days-on-market for RENTAL listings here right now (not sales)? A rising rental-DOM trend means longer vacancies and softer asking-rent achievability than the comps imply.
- What's the recent tenant-quality profile in this submarket — average credit score on applications, eviction rate, late-payment / NSF rate, and stable-employment percentage? A property-management company in the area should have these aggregated.
- How much new apartment / multifamily construction is in the pipeline within 1–3 miles? Heavy new supply (>2% of stock underway) typically softens rents 12–24 months out; light construction supports rent growth.
Investment metrics
- 1% rule
- 1.60% ✓
- Cap rate
- 12.55%
- Cash-on-cash
- 22.33%
- DSCR
- 1.99
- GRM
- 5.2
CMA / ARV
No comps found within radius.
Projected returns pro-forma
-3.0% appreciation · 0.07% rent growth · sell at horizon
- IRR
- 11.6%
- Equity multiple
- 1.44×
- Total profit
- $21,851
- Equity at exit
- $26,168
- IRR
- 18.1%
- Equity multiple
- 2.29×
- Total profit
- $63,256
- Equity at exit
- $15,174
Cash invested: $49,140 (down + closing). Projections, not guarantees.
Landlord ↔ Tenant lean methodology
- Overall (STATE)
- 90 Strongly Landlord-Friendly
- State Louisiana
- 90 Strongly Landlord-Friendly · R+12
- County
- — inherits STATE
- City
- — inherits STATE
ZIP-level market 71115
- Home prices YoY
- -26.5%
- Rents YoY
- 0.1%
- Active inventory
- 105
- Price-to-rent
- 10.4×
Monthly cashflow live
- Estimated rent
- $2,813 high interval (Pro) →
- Mortgage (P&I)
- −$920
- Tax from tax record
- −$227 /mo · $2,728/yr
- Insurance
- −$73
- HOA
- −$87
- Vacancy / Maint / Mgmt
- −$591
- Net cashflow
- $915
Break-even live
2-unit breakdown (identical units grouped — click to expand)
| Units | Beds | Baths | Est. rent |
|---|---|---|---|
| 2× units | 3 | 2 | $2,812 |
| #1 | 3 | 2 | $1,406 |
| #2 | 3 | 2 | $1,406 |
| Total (2 units) | $2,813 | ||
UW: 25.0% down · 7.5% · 30yr · 1.5% tax · 5.0% vac · 8.0% maint · 8.0% mgmt
Financing live
Cash to close
- Down payment
- $43,875
- Closing costs
- $5,265
- Reserves months
- —
- Total cash needed
- —
Loan-product check · same deal, 3 products live
Conventional
25% down · 7.5% · 30yr
- Down + closing
- —
- Monthly P&I
- —
- Monthly cashflow
- —
- DSCR
- —
- Eligible?
- —
Personal DTI + credit; lowest rate.
DSCR
20% down · 8.5% · 30yr
- Down + closing
- —
- Monthly P&I
- —
- Monthly cashflow
- —
- DSCR
- —
- Eligible?
- —
No personal income docs; deal must DSCR.
Hard money
10% down · 12.0% · 12mo
- Down + closing
- —
- Monthly P&I
- —
- Monthly cashflow
- —
- DSCR
- —
- Eligible?
- —
Short-term bridge; refi at stabilization.
Rent comps 18 comps
| Address | Beds | Baths | Sqft | Rent | $/sqft | DOM | Units | Dist |
|---|---|---|---|---|---|---|---|---|
| 8820 Beau Chene Dr Shreveport, LA | 4.0 | 2.0 | 1932 | $2,500 | $1.29 | 43d | 1 | 0.17mi |
| 9505 Balsa Dr Shreveport, LA | 3.0 | 2.5 | 1744 | $1,900 | $1.09 | 13d | 1 | 0.51mi |
| 8117 Captain Mary Miller Dr Shreveport, LA | 3.0 | 2.0 | 1780 | $2,200 | $1.24 | 43d | 1 | 0.63mi |
| 409 Persimmon Dr Shreveport, LA | 3.0 | 2.0 | 1800 | $1,900 | $1.06 | 21d | 1 | 0.65mi |
| 9990 Smugglers Cove Ln Shreveport, LA | 2.0 | 1.5 | 1267 | $1,550 | $1.22 | 43d | 1 | 0.69mi |
| 9993 Smugglers Cove Ln Shreveport, LA | 2.0 | 1.5 | 1339 | $1,500 | $1.12 | 13d | 1 | 0.71mi |
| 9913 Dagger Point Ln Shreveport, LA | 2.0 | 2.5 | 1296 | $1,350 | $1.04 | 43d | 1 | 0.72mi |
| 119 Stratmore Dr Shreveport, LA | 4.0 | 3.0 | 2019 | $2,200 | $1.09 | 21d | 1 | 0.73mi |
| 10018 Artesia Dr Shreveport, LA | 3.0 | 2.5 | 1875 | $1,500 | $0.80 | 43d | 1 | 0.75mi |
| 10014 Stratmore Cir Unit 10014 Shreveport, LA | 3.0 | 2.5 | 1824 | $1,600 | $0.88 | 13d | 1 | 0.76mi |
| 293 Eagle Bend Way Shreveport, LA | 3.0 | 2.0 | 1800 | $2,025 | $1.12 | 43d | 1 | 0.90mi |
| 184 Riverbrooke Dr Shreveport, LA | 3.0 | 2.0 | 1620 | $2,000 | $1.23 | 21d | 1 | 0.93mi |
| 10305 Monet Dr Shreveport, LA | 3.0 | 2.5 | 1533 | $1,600 | $1.04 | 21d | 1 | 1.01mi |
| 10139 Carlsbad Dr Shreveport, LA | 3.0 | 2.0 | 1464 | $1,800 | $1.23 | 43d | 1 | 1.01mi |
| 10142 Carlsbad Dr Shreveport, LA | 3.0 | 2.5 | 1500 | $1,400 | $0.93 | 21d | 1 | 1.02mi |
| 10327 Loma Vista Dr Unit 10327 Shreveport, LA | 3.0 | 2.5 | 1474 | $1,590 | $1.08 | 21d | 1 | 1.05mi |
| 7800 Youree Dr Shreveport, LA | 1.0–3.0 | 1.0–2.0 | 1031 | $1,724 | $1.67 | 13d | 41 | 1.16mi |
| 522 S Dresden Ct Shreveport, LA | 4.0 | 3.0 | 1975 | $1,930 | $0.98 | 13d | 1 | 1.20mi |
HOA detail
- Monthly dues
- $87 · $1,044/yr
- Likely covers
- electric
Listing history 8 events
-
2026-06-18days on market $175,500 Active 9 DOM
-
2026-06-17days on market $175,500 Active 8 DOM
-
2026-06-16days on market $175,500 Active 7 DOM
-
2026-06-15days on market $175,500 Active 6 DOM
-
2026-06-14days on market $175,500 Active 4 DOM
-
2026-06-13days on market $175,500 Active 3 DOM
-
2026-06-10remarks 554-char remark
-
2026-06-10$175,500 Active 1 DOM
ⓘ Source: listings_history table (triggers on properties + properties_extension) + one-shot
backfill from property_details.listing_events for pre-trigger history.
Tax reassessment forecast LA · Resets to sale price
- Current annual tax
- $2,728 · $227/mo
- Projected year-2 tax
- $2,728 · $227/mo
- Expected delta
- $0/yr ($0/mo · 0.0%)
ⓘ Screening estimate from a state-policy table — verify with the county assessor before closing.
Climate risk First Street
- Flood 1/10 Low FEMA zone X · 0% chance over 30 yrs
- Wildfire 1/10 Low
- Heat 7/10 Severe 7 d/yr ≥110°F today · 22 d/yr by 30 yrs out
- Wind 6/10 Major 68% chance of damaging wind over 30 yrs
- Air quality 2/10 Low 0 unhealthy d/yr today · 1 by 30 yrs out
Nearby sold comps map
Loading sold comps map…
Walkable amenities ~0.75 mi
Loading nearby amenities…
Taxation est. · year 1
- Rental income
- $33,756
- − Mortgage interest
- −$9,831
- − Property taxes
- −$2,728
- − Insurance
- −$878
- − Repairs & maintenance
- −$2,700
- − Management
- −$2,700
- − HOA
- −$1,044
- − Depreciation
- −$5,105
- Taxable income
- $8,770
- Est. tax owed @ 24.0%
- −$2,105
- After-tax cash flow
- $8,869/yr
For passive investors: Depreciation is non-cash, so a rental often shows a tax loss while cash-flowing — sheltering income. Rental losses are passive: they offset passive income freely, and up to $25,000/yr can offset ordinary (W-2) income if you actively participate and your MAGI is under $100k (phasing out to $0 by $150k); unused losses carry forward. On sale, claimed depreciation is recaptured at up to 25%, and gains may owe capital-gains tax (a 1031 exchange can defer both). Figures are a year-1 estimate at your 24.0% rate — not tax advice; consult a CPA.
Schools (NCES district)
- District
- Caddo Parish
- NCES district ID
- 2200300
- Math proficiency
- 21% ▼ -33.00%
- Reading proficiency
- 32% ▼ -30.00%
- Median HH income
- $39,227
- Composite
- 22.23/100
- National rank
- #8148
- State rank
- #53 of 98 in LA
Livability — Shreveport
- Score
- 59/100
- State rank
- #270
- US rank
- #19730
Category grades
Schools grade is shown separately in the Schools card above.
Census & demographics
- Census place
- Shreveport, LA
- County
- Caddo Parish · 178,536 people
- City population
- 164,123
- Metro
- Shreveport-Bossier City, LA
- Population (ZIP)
- 14,413
- Household income
- $65,509
- Rent vs Own
- Severe rent burden
- 582.0
Population outlook (Caddo County) Hauer SSP2
- Today (2025)
- 243,190 people
- By 2030
- 237,231 · -2.5%
- By 2040
- 222,502 · -8.5%
- By 2050
- 206,516 · -15.1%
- By 2075
- 165,706 · -31.9%
- By 2100
- 122,262 · -49.7%
Race, ethnicity, and origin ACS 2023
- Neighborhood character
- Predominantly White (66%)
- Race & ethnicity
- White 66% Black 21% Two or more races 5% Asian 5% Hispanic / Latino 3%
- Common ancestry
- Lithuanian 5% Italian 2% Slovak 1%
- Foreign-born
- 6% · China, Canada, Vietnam
- Languages at home
- 91% English-only · Spanish 4% Chinese 2% Other Indo-European 2%
Political lean MEDSL · Caddo
- 2024 margin
- Toss-up / Even · D 51.6% · R 47.0% · Other 1.4%
- 2008→2024 swing
- +1.6pp toward D · 2008: 3.0pp · 2024: 4.6pp
- All cycles
- 2024: D+4.6 2020: D+6.8 2016: D+4.2 2012: D+4.9 2008: D+3.0
Not yet ingested
- Civics
- —
Market trends
- HPI YoY
- ▼ -45.95%
- Current HPI
- 127.4874
- Rent YoY
- ▲ 0.07%
- Metro
- Shreveport-Bossier City, LA
- State GDP YoY
- ▲ 3.29%
- F500 in state
- 10
Industry mix (Fortune 500 HQ in LA)
| Industry | F500 HQs | Revenue |
|---|---|---|
| Telecommunications | 2 | $23B |
|
||
| Utilities | 1 | $12B |
|
||
| Wholesale / Distribution | 1 | $5B |
|
||
| Advertising | 1 | $2B |
|
||
Price history
3 events — show timeline
- 2026-06-04 Listed $175,500 NTREIS
- 2005-12-15 Sold (Public Records) — Public Records
- 1995-02-24 Sold (Public Records) — Public Records
Property tax history
+0.7%/yrLatest (2025): $2,728 · +0.4% YoY. Source: county tax records.
Cash-flow waterfall
monthlySold comps — $/sqft
last 12 mo · ≤1 miLoading sold comps…