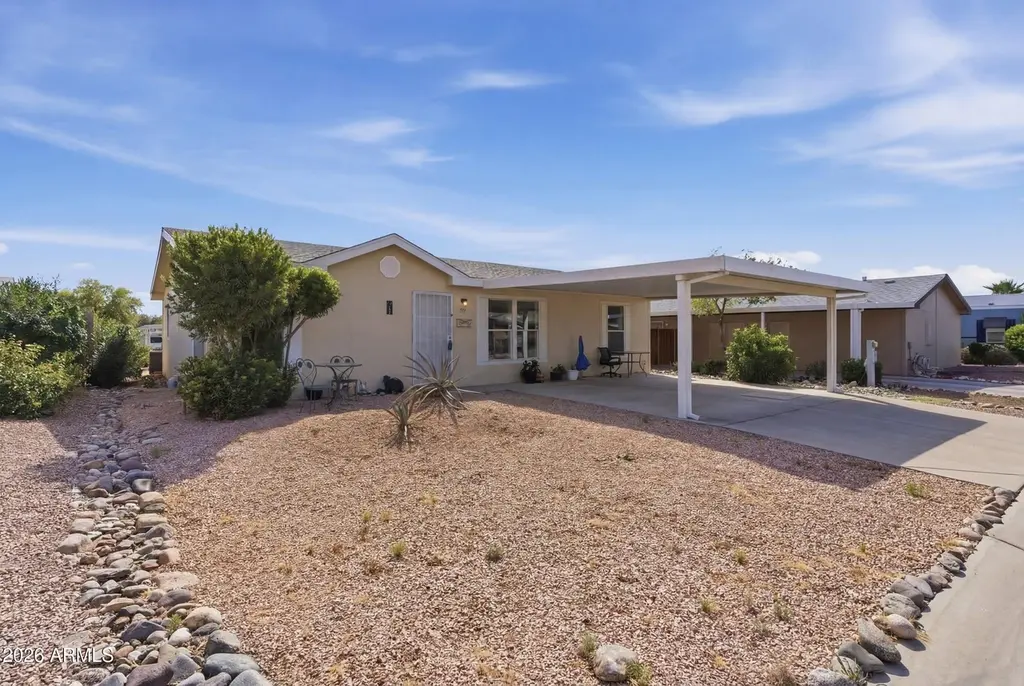
16101 N EL Mirage Rd #358 · El Mirage, AZ
Flood risk 1/10 · Minimal
- FEMA flood zone
- X (shaded)
- Chance of flooding over 30 yrs
- 0.0%
- Est. flood insurance / yr
- $507 – $1,088
Fire risk 4/10 · Minor
- Est. fire insurance / yr
- $610 – $1,132
Heat risk 9/10 · Severe
- Hot days now (above 114°F)
- 7 days/yr
- Hot days in 30 yrs
- 18 days/yr
Wind risk 1/10 · Minimal
- Chance of severe wind over 30 yrs
- —
Air-quality risk 2/10 · Minimal
- Unhealthy air days now
- 1 days/yr
- Unhealthy air days in 30 yrs
- 1 days/yr
Risk factors via First Street. Map © Google.
Why this score? — see what drove the B+ grade
The composite is a weighted blend of 9 inputs, each scored 0–100. Each bar is that input's sub-score; the figure is the points it added to the 100-point composite (weight × sub-score).
- Cash flow +30.0/30.0
- ARV discount +15.0/15.0
- 1% rule +10.0/10.0
- DSCR +10.0/10.0
- Schools +3.3/10.0
- Livability +3.2/5.0
- Condition / age +2.8/5.0
- Rent growth +2.5/5.0
- Appreciation +0.0/10.0
$66,000
🖨 Deal sheet 📄 Offer letter ✓ Due diligence
Listing remarks MLS
Welcome to this lovely home featuring 3 bedrooms and 2 bathrooms! What are you waiting for? Make it yours before it's gone! Any and all furniture can be included in sale price.
Key facts
- 2 parking spots
- Community pool
- Built 2001
Neighborhood map
What this means for you Summary
Snapshot
- This is a 3-bed/2.0-bath manufactured listed at $66k. Condition is rated average.
Deal economics
- At list price, monthly cash flow is $983 ($12k/yr) — positive.
- The deal already cash-flows at list — no discount required.
- Meets the 1% rule at list price ($2k rent vs $66k).
- Recommended offer: $60k (9.0% below list) — sets the bar for market timing.
- Cap rate 24.2% vs local median 4.5% in El Mirage — top-decile yield for the area; either an underpriced asset or a hidden risk that comps aren't pricing in. Stress-test before assuming the spread holds.
Location & tenants
- Location reads 63/100 on livability (#112 in AZ) — a middle-class / working-renter tenant base. Strengths: housing A+, cost of living A; Watch: schools D-, amenities F, commute F.
- Dysart Unified District (4243) (suburban): math 34% / reading 40% proficiency, ranked #73 of 249 in AZ (top 29%) — families likely to look elsewhere, expect single-tenant / working-renter base with shorter leases.
- Market conditions: Rents flat; 132 active listings in the ZIP; 26 comparable units currently listed for rent nearby; rentals at typical pace (median 24d on market — plan ~3-4 weeks tenant-placement turnaround); solid renter incomes; 36,011 units permitted in Maricopa County in 2024 (12,801 in 5+ unit buildings).
Forward outlook
- Local home prices are declining (-3.0%/yr); year-one equity from $456 of loan paydown is wiped out by about $2k of value loss. Plan a longer hold.
- Maricopa County population projected at +38% by 2050 — long-run rental-demand tailwind backs the buy-and-hold thesis.
- At projected returns (-3.0% appreciation + 0.1% rent growth), your $18k cash investment doubles in ~2 years — after that, you're playing with house money.
Negotiation context
- It's been on market 100 days — a 9% lower offer ($60k) is reasonable based on typical stale-listing flexibility.
Risks & watch-outs
- Climate carrying-cost: extreme-heat days projected 7→18/yr by 2055 (HVAC capex compounding) — expect insurance premiums to compound above CPI over the hold.
Questions for the listing agent
- It's been on market 100 days. Have you received any prior offers? Is the seller open to a 9% concession, seller financing, or rate buy-down credit?
- Why hasn't it sold? Are there any deal-killer items the seller is aware of (foundation, flood, title, zoning, code violations)?
- Is there a deadline driving the sale (1031 exchange, divorce, estate, relocation)? That informs how much negotiation room exists.
- Schools are D-rated, which usually means shorter tenancies and higher turnover. Who's the typical renter profile here, and what's been the actual vacancy rate?
- What's the average days-on-market for RENTAL listings here right now (not sales)? A rising rental-DOM trend means longer vacancies and softer asking-rent achievability than the comps imply.
- What's the recent tenant-quality profile in this submarket — average credit score on applications, eviction rate, late-payment / NSF rate, and stable-employment percentage? A property-management company in the area should have these aggregated.
- How much new for-sale + rental construction is in the pipeline within 1–3 miles? Heavy new supply typically softens prices + rents 12–24 months out; constrained supply supports both.
Investment metrics
- 1% rule
- 2.76% ✓
- Cap rate
- 24.17%
- Cash-on-cash
- 63.83%
- DSCR
- 3.84
- GRM
- 3.0
CMA / ARV
- ARV (median comp)
- $90,780
- List price
- $66,000
- Delta
- -27.30%
- Verdict
- UNDERPRICED
- Comps
- 20 within 1.0 mi
Show comp detail 7 sales within ~0.75 mi
| Address | Dist | Beds/Ba | Sqft | Sold | Price | $/sf | Match |
|---|---|---|---|---|---|---|---|
| 16101 N EL Mirage Rd #424 | 0.04mi | 3/2.0 | 1,200 (0%) | 19mo | $100,000 | $83 | 83 |
| 16101 N EL Mirage Rd #371 | 0.09mi | 3/2.0 | 1,344 (+12%) | 0mo | $64,000 | $48 | 76 |
| 16101 N EL Mirage Rd #369 | 0.00mi | 3/2.0 | 1,326 (+10%) | 8mo | $85,000 | $64 | 76 |
| 16101 N EL Mirage Rd #354 | 0.04mi | 3/2.0 | 1,326 (+10%) | 11mo | $90,000 | $68 | 71 |
| 16101 N EL Mirage Rd #378 | 0.06mi | 3/2.0 | 1,377 (+15%) | 4mo | $112,000 | $81 | 69 |
| 16101 N EL Mirage Rd #445 | 0.04mi | 3/2.0 | 1,351 (+13%) | 22mo | $92,000 | $68 | 59 |
| 15632 N Greasewood St | 0.43mi | 3/2.0 | 1,352 (+13%) | 20mo | $315,000 | $233 | 42 |
Match score weights: distance 35% · size 25% · config 20% · recency 20%. Top-matched comps best support the ARV.
Projected returns pro-forma
-3.0% appreciation · 0.08% rent growth · sell at horizon
- IRR
- 59.6%
- Equity multiple
- 3.53×
- Total profit
- $46,740
- Equity at exit
- $9,841
- IRR
- 63.3%
- Equity multiple
- 6.48×
- Total profit
- $101,300
- Equity at exit
- $5,706
Cash invested: $18,480 (down + closing). Projections, not guarantees.
Landlord ↔ Tenant lean methodology
- Overall (STATE)
- 87 Strongly Landlord-Friendly
- State Arizona
- 87 Strongly Landlord-Friendly · R+3
- County
- — inherits STATE
- City
- — inherits STATE
ZIP-level market 85335
- Home prices YoY
- -13.3%
- Rents YoY
- 0.1%
- Active inventory
- 132
- Price-to-rent
- 3.0×
Monthly cashflow live
- Estimated rent
- $1,822 high interval (Pro) →
- Mortgage (P&I)
- −$346
- Tax est. 1.5%
- −$82 /mo · $990/yr
- Insurance
- −$28
- HOA
- −$0
- Vacancy / Maint / Mgmt
- −$383
- Net cashflow
- $983
Break-even live
UW: 25.0% down · 7.5% · 30yr · 1.5% tax · 5.0% vac · 8.0% maint · 8.0% mgmt
Financing live
Cash to close
- Down payment
- $16,500
- Closing costs
- $1,980
- Reserves months
- —
- Total cash needed
- —
Loan-product check · same deal, 3 products live
Conventional
25% down · 7.5% · 30yr
- Down + closing
- —
- Monthly P&I
- —
- Monthly cashflow
- —
- DSCR
- —
- Eligible?
- —
Personal DTI + credit; lowest rate.
DSCR
20% down · 8.5% · 30yr
- Down + closing
- —
- Monthly P&I
- —
- Monthly cashflow
- —
- DSCR
- —
- Eligible?
- —
No personal income docs; deal must DSCR.
Hard money
10% down · 12.0% · 12mo
- Down + closing
- —
- Monthly P&I
- —
- Monthly cashflow
- —
- DSCR
- —
- Eligible?
- —
Short-term bridge; refi at stabilization.
Rent comps 26 comps
| Address | Beds | Baths | Sqft | Rent | $/sqft | DOM | Units | Dist |
|---|---|---|---|---|---|---|---|---|
| 15620 N El Mirage Rd Surprise, AZ | 3.0 | 2.5 | 1310 | $1,599 | $1.22 | 24d | 2 | 0.27mi |
| 15427 N Jerry St Surprise, AZ | 2.0 | 1.5 | 920 | $1,450 | $1.58 | 5d | 1 | 0.37mi |
| 16520 N Greasewood St Surprise, AZ | 2.0–3.0 | 2.5 | 1267 | $1,850 | $1.46 | 1d | 17 | 0.50mi |
| 16629 N Greasewood St Surprise, AZ | 2.0 | 1.5 | 1052 | $1,462 | $1.39 | 1d | 3 | 0.51mi |
| 12741 W Tasha Dr Surprise, AZ | 2.0 | 1.0 | 750 | $1,275 | $1.70 | 24d | 1 | 0.68mi |
| 12817 W Cottonwood St Unit 1 Surprise, AZ | 2.0 | 1.0 | 725 | $1,300 | $1.79 | 5d | 1 | 0.77mi |
| 14809 N El Frio Cir El Mirage, AZ | 4.0 | 2.0 | 1459 | $2,199 | $1.51 | 21d | 1 | 0.78mi |
| 12438 W Hearn Rd El Mirage, AZ | 3.0 | 2.0 | 1308 | $1,595 | $1.22 | 23d | 1 | 0.82mi |
| 11759 W Banff Ln El Mirage, AZ | 4.0 | 2.5 | 1495 | $2,000 | $1.34 | 43d | 1 | 0.92mi |
| 12945 W Greenway Rd El Mirage, AZ | 2.0 | 2.0 | 1060 | $1,300 | $1.23 | 23d | 4 | 0.99mi |
| 12574 W Lisbon Ln El Mirage, AZ | 3.0 | 2.0 | 1058 | $1,700 | $1.61 | 4d | 1 | 1.03mi |
| 11417 W Amber Trl Surprise, AZ | 3.0 | 2.0 | 1130 | $1,750 | $1.55 | 5d | 1 | 1.09mi |
| 15426 N Cactus Ln Surprise, AZ | 3.0 | 1.0 | 1376 | $1,634 | $1.19 | 43d | 1 | 1.09mi |
| 11345 W Loma Blanca Dr Surprise, AZ | 3.0 | 2.0 | 1368 | $1,930 | $1.41 | 43d | 1 | 1.11mi |
| 11755 W Thompson Ranch Rd El Mirage, AZ | 1.0–3.0 | 1.0–2.0 | 936 | $2,771 | $2.96 | 1d | 1 | 1.23mi |
| 14005 N Palm St Unit 4 El Mirage, AZ | 2.0 | 1.0 | 830 | $1,200 | $1.45 | 43d | 1 | 1.24mi |
| 13913 N Palm St Unit 12 El Mirage, AZ | 2.0 | 1.0 | 800 | $1,200 | $1.50 | 1d | 1 | 1.27mi |
| 13913 N Palm St Unit 14 El Mirage, AZ | 2.0 | 1.0 | 830 | $1,200 | $1.45 | 43d | 1 | 1.27mi |
| 17447 Avenue of the Arts Unit 2 Surprise, AZ | 2.0 | 2.0 | 1078 | $1,732 | $1.61 | 24d | 1 | 1.38mi |
| 17447 Avenue of the Arts Unit 3 Surprise, AZ | 3.0 | 2.0 | 1183 | $1,822 | $1.54 | 24d | 1 | 1.38mi |
| 17447 N Avenue of the Arts Surprise, AZ | 2.0 | 2.0 | 1078 | $1,813 | $1.68 | 12d | 1 | 1.44mi |
| 17447 N Avenue of the Arts Surprise, AZ | 3.0 | 2.0 | 1183 | $1,981 | $1.67 | 1d | 1 | 1.44mi |
| 13342 W Canyon Creek Dr Surprise, AZ | 3.0 | 2.0 | 1419 | $1,750 | $1.23 | 24d | 1 | 1.45mi |
| 12022 W Ash St El Mirage, AZ | 3.0 | 2.0 | 1040 | $1,800 | $1.73 | 24d | 1 | 1.45mi |
| 14417 N Gil Balcome Surprise, AZ | 3.0 | 2.0 | 1446 | $1,900 | $1.31 | 5d | 1 | 1.49mi |
| 12430 W Willow Ave El Mirage, AZ | 3.0 | 2.0 | 1183 | $5,900 | $4.99 | 4d | 1 | 1.49mi |
Listing history 17 events
-
2026-06-18days on market $66,000 Active 100 DOM
-
2026-06-17days on market $66,000 Active 99 DOM
-
2026-06-16days on market $66,000 Active 98 DOM
-
2026-06-15days on market $66,000 Active 97 DOM
-
2026-06-13days on market $66,000 Active 95 DOM
-
2026-06-09days on market $66,000 Active 91 DOM
-
2026-06-08days on market $66,000 Active 90 DOM
-
2026-06-07days on market $66,000 Active 89 DOM
-
2026-06-04days on market $66,000 Active 86 DOM
-
2026-06-03days on market $66,000 Active 85 DOM
-
2026-06-02days on market $66,000 Active 84 DOM
-
2026-06-02price $66,000 Active 83 DOM
-
2026-06-01days on market $79,000 Active 83 DOM
-
2026-05-31days on market $79,000 Active 82 DOM
-
2026-04-04price $79,000 177-char remark
Show marketing remark (177 chars)
Welcome to this lovely home featuring 3 bedrooms and 2 bathrooms! What are you waiting for? Make it yours before it's gone! Any and all furniture can be included in sale price.
-
2026-03-21price $89,000 177-char remark
Show marketing remark (177 chars)
Welcome to this lovely home featuring 3 bedrooms and 2 bathrooms! What are you waiting for? Make it yours before it's gone! Any and all furniture can be included in sale price.
-
2026-03-10$90,000 Active 177-char remark
Show marketing remark (177 chars)
Welcome to this lovely home featuring 3 bedrooms and 2 bathrooms! What are you waiting for? Make it yours before it's gone! Any and all furniture can be included in sale price.
ⓘ Source: listings_history table (triggers on properties + properties_extension) + one-shot
backfill from property_details.listing_events for pre-trigger history.
Climate risk First Street
- Flood 1/10 Low FEMA zone X (shaded) · 0% chance over 30 yrs
- Wildfire 4/10 Moderate
- Heat 9/10 Extreme 7 d/yr ≥114°F today · 18 d/yr by 30 yrs out
- Wind 1/10 Low
- Air quality 2/10 Low 1 unhealthy d/yr today · 1 by 30 yrs out
Nearby sold comps map
Loading sold comps map…
Walkable amenities ~0.75 mi
Loading nearby amenities…
Taxation est. · year 1
- Rental income
- $21,860
- − Mortgage interest
- −$3,697
- − Property taxes
- −$990
- − Insurance
- −$330
- − Repairs & maintenance
- −$1,749
- − Management
- −$1,749
- − Depreciation
- −$1,920
- Taxable income
- $11,425
- Est. tax owed @ 24.0%
- −$2,742
- After-tax cash flow
- $9,054/yr
For passive investors: Depreciation is non-cash, so a rental often shows a tax loss while cash-flowing — sheltering income. Rental losses are passive: they offset passive income freely, and up to $25,000/yr can offset ordinary (W-2) income if you actively participate and your MAGI is under $100k (phasing out to $0 by $150k); unused losses carry forward. On sale, claimed depreciation is recaptured at up to 25%, and gains may owe capital-gains tax (a 1031 exchange can defer both). Figures are a year-1 estimate at your 24.0% rate — not tax advice; consult a CPA.
Condition & rehab AI · 12 photos
This home requires moderate repairs and updates to improve its condition and value. Fresh paint, new flooring, and modernizing the kitchen and bathrooms can significantly enhance its appeal.
Repairs flagged
- Minor Exterior siding — Some discoloration and wear
- Minor Carpeted flooring — Worn and needs replacement
- Minor Paint — Chipped and worn in some areas
Value-add opportunities
- Both Paint — Fresh paint can improve curb appeal and interior aesthetics
- Both Flooring — New flooring can improve comfort and value
- Both Kitchen appliances — Upgrading to modern appliances can increase appeal and value
- Both Bathroom fixtures — Modernizing bathrooms can improve functionality and value
Renovation cost estimate screening
| Repair item | Severity | Est. cost |
|---|---|---|
| Exterior siding · Some discoloration and wear | Minor | $500–3,000 |
| Carpeted flooring · Worn and needs replacement | Minor | $500–3,000 |
| Paint · Chipped and worn in some areas | Minor | $500–3,000 |
| Total estimated repair cost · 3 items | $1,500–9,000 |
Value-add ROI direction
- Both Paint — Fresh paint can improve curb appeal and interior aesthetics ↑
- Both Flooring — New flooring can improve comfort and value ↑
- Both Kitchen appliances — Upgrading to modern appliances can increase appeal and value ↑
- Both Bathroom fixtures — Modernizing bathrooms can improve functionality and value ↑
ⓘ Cost ranges are severity-bucket heuristics (US national rule-of-thumb). Get contractor quotes + a written scope before underwriting a rehab budget.
Schools (NCES district)
- District
- Dysart Unified District (4243)
- NCES district ID
- 0402690
- Math proficiency
- 34% ▼ -10.00%
- Reading proficiency
- 40% ▼ -5.00%
- Median HH income
- $58,033
- Composite
- 32.76/100
- National rank
- #5634
- State rank
- #73 of 249 in AZ
Livability — El Mirage
- Score
- 63/100
- State rank
- #112
- US rank
- #15164
Category grades
Schools grade is shown separately in the Schools card above.
Census & demographics
- Census place
- El Mirage, AZ
- County
- Maricopa County · 4,537,380 people
- City population
- 36,088
- Metro
- Phoenix-Mesa-Chandler, AZ
- Population (ZIP)
- 36,088
- Household income
- $78,050
- Rent vs Own
- Severe rent burden
- 669.0
Population outlook (Maricopa County) Hauer SSP2
- Today (2025)
- 4,979,203 people
- By 2030
- 5,378,229 · +8.0%
- By 2040
- 6,156,598 · +23.6%
- By 2050
- 6,872,376 · +38.0%
- By 2075
- 8,401,270 · +68.7%
- By 2100
- 9,247,439 · +85.7%
Race, ethnicity, and origin ACS 2023
- Neighborhood character
- Diverse neighborhood (Simpson 0.62)
- Race & ethnicity
- Hispanic / Latino 50% White 35% Two or more races 28% Black 6% Native American 1% Pacific Islander 1%
- Hispanic origin (detail)
- Mexican 37%
- Common ancestry
- Lithuanian 2% Romanian 1% Iranian 1%
- Foreign-born
- 15% · Canada
- Languages at home
- 66% English-only · Spanish 30% Other Indo-European 1% Other Asian/Pacific 1%
Political lean MEDSL · Maricopa
- 2024 margin
- Toss-up / Even · D 47.7% · R 51.2% · Other 1.1%
- 2008→2024 swing
- +7.1pp toward D · 2008: -10.6pp · 2024: -3.5pp
- All cycles
- 2024: R+3.5 2020: D+2.2 2016: R+3.5 2012: R+12.0 2008: R+10.6
Not yet ingested
- Civics
- —
Market trends
- HPI YoY
- ▼ -52.81%
- Current HPI
- 342.6503
- Rent YoY
- ▲ 0.08%
- Metro
- Phoenix-Mesa-Chandler, AZ
- State GDP YoY
- ▲ 4.54%
- F500 in state
- 20
Industry mix (Fortune 500 HQ in AZ)
| Industry | F500 HQs | Revenue |
|---|---|---|
| Technology | 2 | $13B |
|
||
| Mining / Metals | 1 | $23B |
|
||
| Environmental Services | 1 | $16B |
|
||
| Metals / Steel | 1 | $14B |
|
||
| Technology Distribution | 1 | $9B |
|
||
| Homebuilding | 1 | $8B |
|
||
Price history
-12.2% since first listed3 events — show timeline
- 2026-04-04 Price Changed $79,000 ARMLS
- 2026-03-21 Price Changed $89,000 ARMLS
- 2026-03-10 Listed $90,000 ARMLS
Cash-flow waterfall
monthlySold comps — $/sqft
last 12 mo · ≤1 miLoading sold comps…